
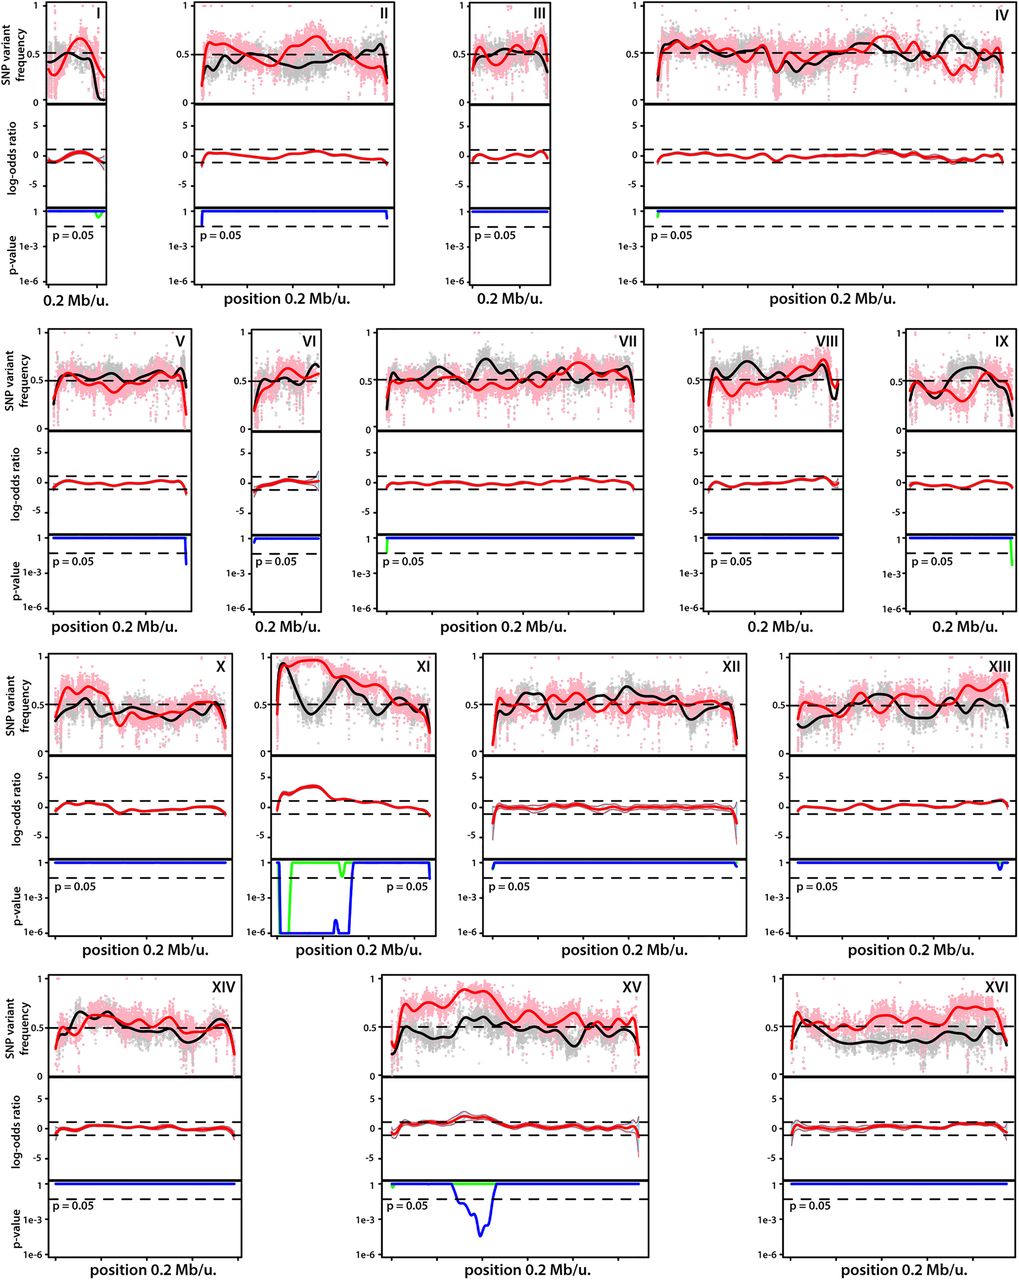
QTL mapping for very high acetic acid accumulation capacity with SNPs as genetic markers. Dot plots of SNP variant frequency from the superior pool (red) and the inferior pool (black) versus chromosomal position. Red and black lines on the dot plots represent smoothed data from the superior and inferior pools, respectively. The red line in the middle graph indicates deviation from the confidence interval. P-values (blue line) ≤ 0.05 for the difference between the smoothed lines of superior (blue line) or inferior (green line) pools at a particular locus versus 50% random segregation indicate statistically significant linkage to the genome of the superior (SBERH6) or inferior (S288c) parent at that locus. Two major QTLs (QTL1 and QTL2) with strong linkage to the genome of the superior parent are present in the first half of Chromosome XI and the first half of Chromosome XV, respectively.


