
Abstract
The origination of new genes contributes to phenotypic evolution in humans. Two major challenges in the study of new genes are the inference of gene ages and annotation of their protein-coding potential. To tackle these challenges, we created GenTree, an integrated online database that compiles age inferences from three major methods together with functional genomic data for new genes. Genome-wide comparison of the age inference methods revealed that the synteny-based pipeline (SBP) is most suited for recently duplicated genes, whereas the protein-family–based methods are useful for ancient genes. For SBP-dated primate-specific protein-coding genes (PSGs), we performed manual evaluation based on published PSG lists and showed that SBP generated a conservative data set of PSGs by masking less reliable syntenic regions. After assessing the coding potential based on evolutionary constraint and peptide evidence from proteomic data, we curated a list of 254 PSGs with different levels of protein evidence. This list also includes 41 candidate misannotated pseudogenes that encode primate-specific short proteins. Coexpression analysis showed that PSGs are preferentially recruited into organs with rapidly evolving pathways such as spermatogenesis, immune response, mother–fetus interaction, and brain development. For brain development, primate-specific KRAB zinc-finger proteins (KZNFs) are specifically up-regulated in the mid-fetal stage, which may have contributed to the evolution of this critical stage. Altogether, hundreds of PSGs are either recruited to processes under strong selection pressure or to processes supporting an evolving novel organ.
New genes have attracted the interest of evolutionary geneticists for decades. They are novel genetic units that have originated in the evolutionary period of interest (Long et al. 2003; Kaessmann 2010; Betrán 2015). Extensive studies have shown that various mechanisms, including DNA- or RNA-mediated duplication and de novo origination, lead to a high rate of protein-coding gene gain in human evolution (Zhang et al. 2012; Zhang and Long 2014). Transcriptome profiling has revealed that new genes in the human genome postdating the human and mouse split (i.e., primate-specific genes [PSGs]) are often expressed in the testis (Vinckenbosch et al. 2006; Tay et al. 2009; Kaessmann 2010; Xie et al. 2012) or brain (Tay et al. 2009; Zhang et al. 2011; Xie et al. 2012). Limited case studies have supported the functionality of PSGs in these tissues. For example, glutamate dehydrogenase 2 (GLUD2) is a hominoid-specific RNA-mediated duplicate (functional retrocopy or retrogene), which facilitates metabolism in the brain and testis (Burki and Kaessmann 2004; Spanaki et al. 2010). Anecdotal evidence has also implicated PSGs in other biological processes (e.g., injury response) (Costantini et al. 2015; Baird et al. 2016).
The explosion of new techniques, such as organoids derived from induced pluripotent stem cells (iPSCs) (Pääbo 2014; Giandomenico and Lancaster 2017) and gene editing using CRISPR-Cas9 (Hsu et al. 2014), makes it more feasible to investigate the functional roles of new genes in humans. However, progress in understanding the contribution of new genes to primate- or human-specific traits has been hindered by the lack of a consensus data set of PSGs. Actually, the estimated number of PSGs varies between five and 2000 (Demuth et al. 2006; Tay et al. 2009; Zhang et al. 2011; Ezkurdia et al. 2014). Similarly, the number of human-specific genes (HSGs), that is, genes that are not even present in the chimpanzee genome, ranges from 300 to 700 (Demuth et al. 2006; Zhang et al. 2010b).
Two key challenges in creating a consensus data set are the disagreement in age estimation between different methods and annotation instability. First, the main gene-dating methods, that is, the synteny-based gene-level dating strategy (Knowles and McLysaght 2009; Tay et al. 2009; Zhang et al. 2010b) and the homologous gene family-level dating strategy (Demuth et al. 2006; Toll-Riera et al. 2009; Ezkurdia et al. 2014), often assign different ages to the same gene. So far, no genome-wide comparison has been performed to assess their relative performance to allow a rational choice. Second, the annotation for new genes is unstable, often shifting between protein-coding and noncoding models across releases. For example, 660 primate-specific coding models annotated in Ensembl v51 were reannotated as noncoding models, for example, pseudogenes, in a later release (v65) (Hubbard et al. 2007; Zhang et al. 2010b, 2012). A major reason is the uncertainty of the protein-coding potential for these loci (Zhang et al. 2012). Two approaches have been proposed to assess the coding potential of new genes, namely, the detection of protein-level evolutionary constraint (Betrán et al. 2002; Mudge and Harrow 2016; Xu and Zhang 2016) and peptide search in proteomic data sets (Kim et al. 2014; Wright et al. 2016). Nevertheless, the performance of these two strategies has not been studied on a genome-wide level.
To tackle these challenges, we developed GenTree (http://gentree.ioz.ac.cn/). This resource features age inferences from major genome-wide dating methods or small-scale manual curation. GenTree also presents evolutionary and proteomic evidence for assessing the protein-coding potential. Based on such a resource, we performed extensive meta-analysis: (1) We compared the strengths and weaknesses between various dating methods; (2) we curated a data set of 254 PSGs with coding potential; and (3) we finally examined the overall functional properties of PSGs.
Results
GenTree is an integrated database for new genes in the human genome
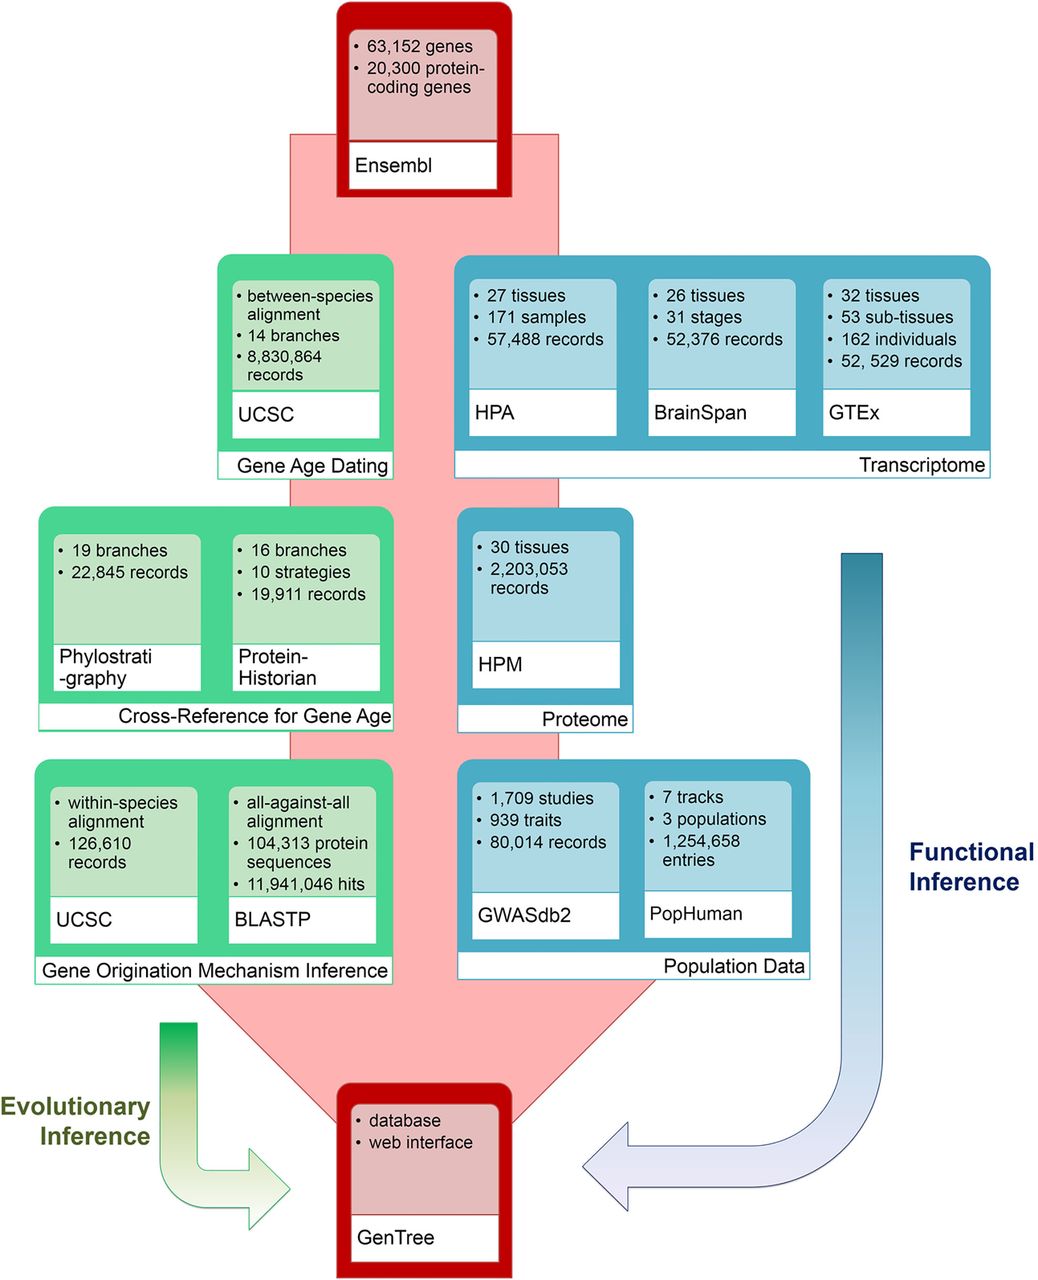
As a new-gene–focused database, GenTree is designed to enable users to evaluate when and how a gene arises and what type of function it may have (Fig. 1).
The overall architecture of GenTree. It integrates three types of data: (1) gene annotation data from Ensembl; (2) gene age inference and origination mechanism inference data; and (3) gene function information based on either functional genomic data including Human Protein Atlas (HPA), Genotype-Tissue Expression (GTEx), Human Proteome Map (HPM) and BrainSpan (http://www.brainspan.org) data, quantitative genetic data (genome-wide association data from GWASdb2), and selection data (positive selection tracks from PopHuman).
On the back end, we first applied our previously developed synteny-based dating pipeline (SBP) (Zhang et al. 2010a,b) to date all human protein-coding genes in Ensembl (Flicek et al. 2012) v73 (Supplemental Fig. S1; Methods). To compare SBP estimates with those from protein-family–based methods, we incorporated into GenTree two widely used age data sets from the phylostratigraphy (Domazet-Lošo and Tautz 2010) and ProteinHistorian (Capra et al. 2012) databases. Origination mechanisms were inferred for genes that postdated the vertebrate split. To assess the potential functions of new genes, we integrated publicly available functional genomics data and population genomic data while accounting for the uncertainty due to the similarity between paralogs if possible (Methods).
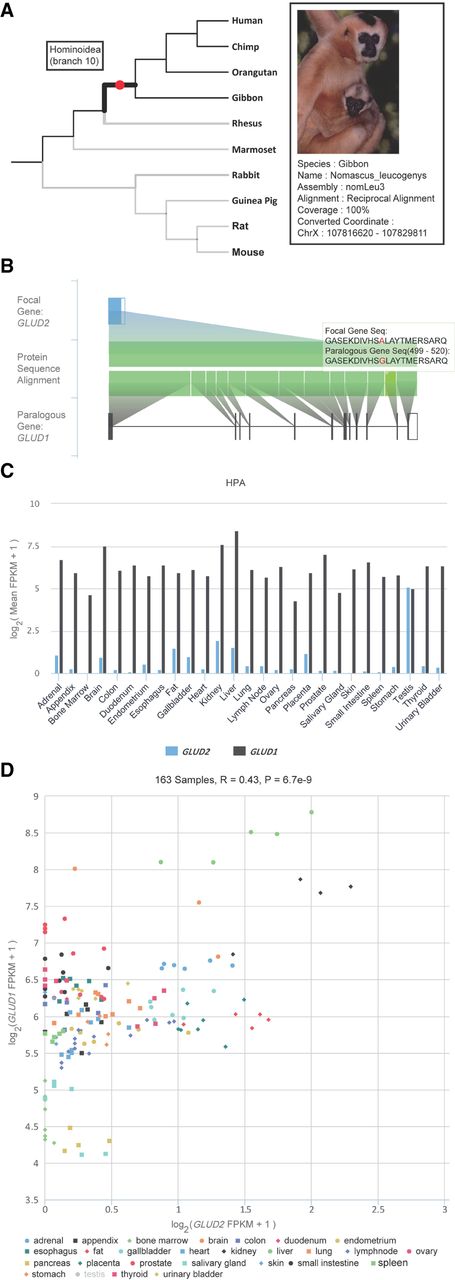
On the front end, GenTree implements a user-friendly web interface to provide both individual gene information and summary statistics of gene families or functional groups. To showcase the functionality of GenTree for individual genes, we use the aforementioned GLUD2 as an example. As shown in Figure 2A, a mouse-over will show the SBP dating result, which is in agreement with previous studies (Fig. 2A, branch 10; Supplemental Fig. S1; Burki and Kaessmann 2004). GenTree also shows evidence for GLUD2 originating via RNA-based duplication: It has a single exon, whereas the parental gene GLUD1 has multiple exons (Fig. 2B). Lastly, GenTree presents functional genomic data (Human Protein Atlas [HPA]), showing that GLUD2 is predominantly expressed in the testis (Fig. 2C), consistent with both the known testis bias of new genes (Vinckenbosch et al. 2006; Kaessmann 2010) and the previous literature for GLUD2 (Spanaki et al. 2010). GenTree allows the user to compare the expression profile of the new gene to the parental gene by showing that the parental copy for GLUD2, that is, GLUD1, is more strongly and more broadly expressed (Fig. 2C). Notably, after removing testis data, the expression levels of GLUD1 and GLUD2 are in fact positively correlated (Fig. 2D). This pattern has been discovered for retrogene and parental gene pairs in rice and zebrafish (Sakai et al. 2011; Zhong et al. 2015). The Genotype-Tissue Expression (GTEx) data (The GTEx Consortium 2015) show similar correlation (Supplemental Fig. S2).
Representative sections in the gene page of GenTree database showing the evolutionary and functional features of GLUD2. (A) Branch view of GLUD2. When the mouse is placed over the branch on which GLUD2 originated, the top left tooltip shows the inferred age, that is, branch 10. For the external leaf node, the black line indicates the syntenic alignment, and the gray line indicates the nonsyntenic alignment. When the mouse is placed over an external node, that is, gibbon, the top right tooltip shows the alignment details in this species. Photo courtesy of Jim Zuckerman, Gibbon Conservation Center. (B) Paralogous alignment between GLUD2 and its parental gene, GLUD1. The top row shows the gene structure of GLUD2 with the open reading frame (ORF) indicated in a blue block and the untranslated region (UTR) indicated in an unfilled block. The gene structure of GLUD1 on the bottom is likewise indicated. The diagram in the center shows the protein alignment at the exon level, which is triggered by mouse-over. Mismatches are indicated in red. Users can zoom into a specific region of interest. (C) HPA transcriptome profile across tissues for the two paralogs. For each tissue, the mean expression across replicates is shown as the log2-transformed FPKM value. (D) Scatter plot view of expression intensity. Users can disable samples from some tissue (e.g., testis) and zoom into an area filled with data points of interest. Accordingly, the Pearson's correlation and P-value across the remaining samples (e.g., without testis) are recalculated automatically.
Besides single gene annotation, GenTree provides summary statistics for genes with the same Gene Ontology (GO) term (Ashburner et al. 2000) or InterPro family annotation (Hunter et al. 2009). In both cases, we calculated the gene age distribution for each GO or InterPro family category, divided by chromosomes. For example, the Krueppel-associated box C2H2 zinc-finger protein family (KZNF) was known to have expanded especially on Chromosome 19 (Chr 19) of humans (Nowick et al. 2010, 2011). Consistent with this, the chromosomal browser view (Supplemental Fig. S3) revealed that KZNFs are enriched for PSGs (82 or 11%) compared with the genome-wide background (354 or 1.8%, Fisher's exact test [FET] P = 2.2 × 10⁻¹⁶), with Chr 19 harboring 55 (67%) entries.
SBP performs dating at the individual gene level based on syntenic alignment, whereas phylostratigraphy and ProteinHistorian act at the gene family level based on protein alignment
To be comprehensive, GenTree provides users with multiple gene dating data, namely, SBP and protein-family–based ages (phylostratigraphy and ProteinHistorian) (Fig. 1). We performed genome-wide comparisons between them to determine their suitability for dating PSGs.
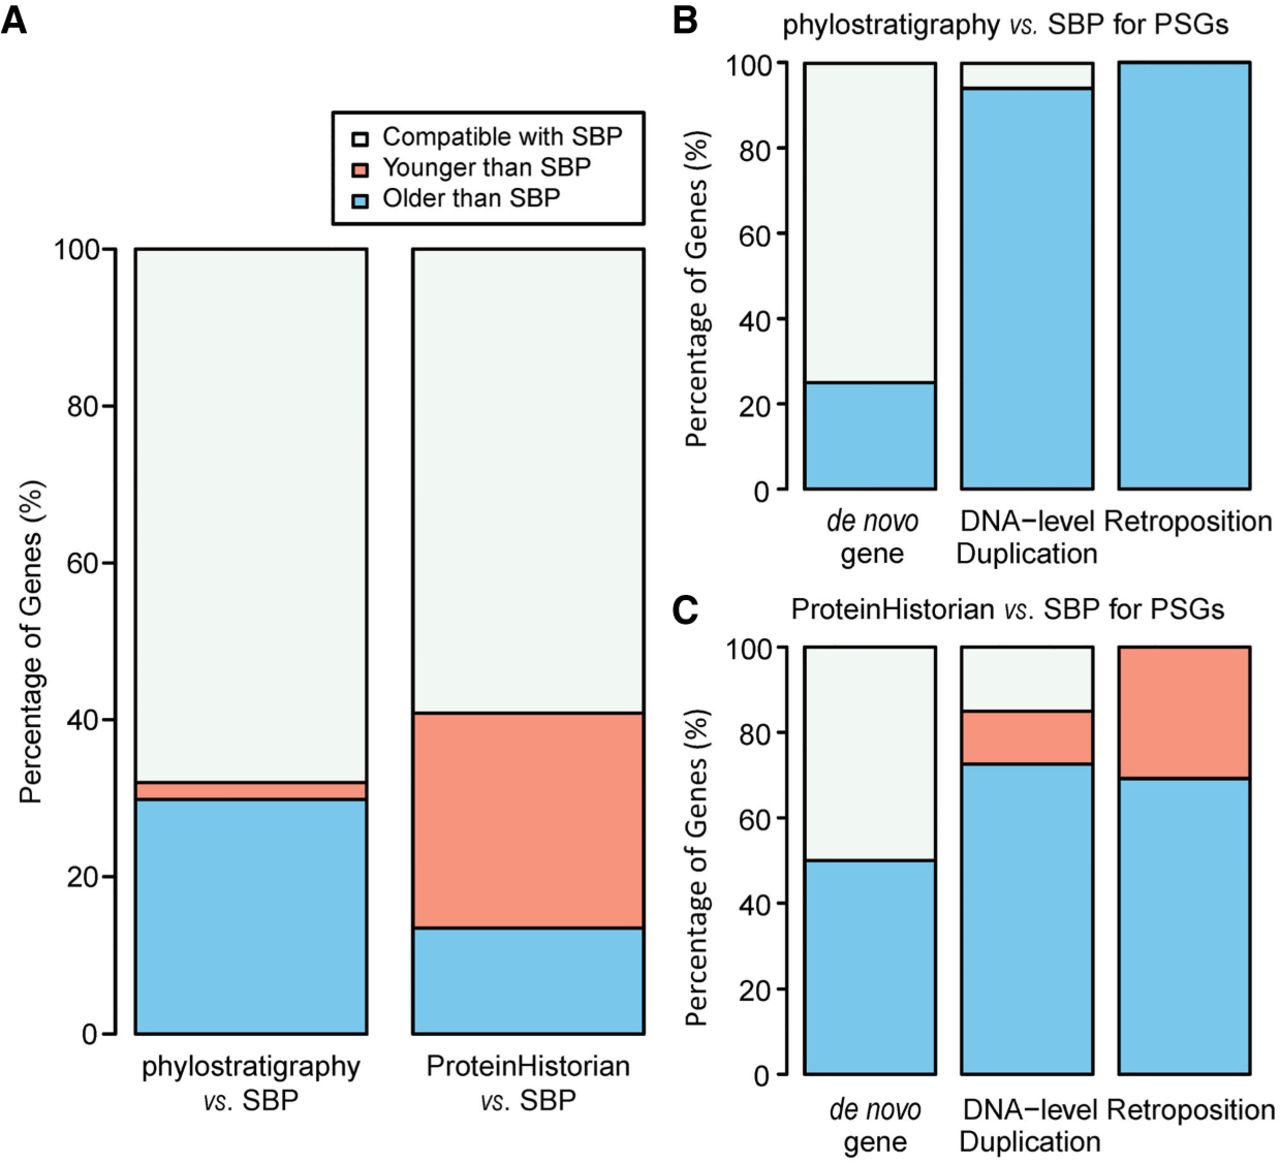
Overall, SBP was consistent with phylostratigraphy and ProteinHistorian for 60% of all genes (Fig. 3A). However, the consistency for young genes is much lower than that for older genes. Specifically, for PSGs dated by SBP, the majority (>90%) were assigned to older branches by phylostratigraphy, which mainly comprise DNA- and RNA-mediated duplicates (Fig. 3B). In comparison, orphans or candidate de novo genes show a higher consistently (75% vs. 6%, FET P = 9.8 × 10⁻⁴). Such a pattern is expected because phylostratigraphy assigns the age of the oldest member to the whole family (Domazet-Lošo et al. 2007). ProteinHistorian is similar as phylostratigraphy (Fig. 3C) except in the case of a patchy phylogenetic distribution, that is, candidate orthologs are lost in some ingroup lineages. In those situations, ProteinHistorian may infer multiple recent gains rather than one ancient origination (Capra et al. 2013). This should contribute to our observation that ProteinHistorian sometimes infers a younger age than SBP does (Fig. 3A,C).
Comparison of gene age estimates between SBP, phylostratigraphy, and ProteinHistorian. Panel A shows the statistics for all genes; panels B and C focus on SBP-dated PSGs and group them based on their origination mechanism.
Different from phylostratigraphy and ProteinHistorian, SBP relies on syntenic relationships based on whole-genome alignment and distinguishes different duplicates. Although this makes SBP suitable for dating recently originated genes, the same feature limits its ability to date evolutionarily old genes because only 70% of all genes show conserved synteny between humans and zebrafish (Barbazuk et al. 2000). In practice, SBP collapses all genes predating human–zebrafish split into a single age group. In contrast, family-level dating is applicable over a broader time range due to both its scalability and low decay rate of proteins (Albà and Castresana 2007; McLysaght and Hurst 2016).
Besides gene or family-level dating, SBP and protein-family–based methods differ with respect to their dependence on annotation quality for reference species. On one hand, SBP relies only on genomic alignment, hence it is insensitive to annotation quality, which is crucial for protein-family–based methods. On the other hand, SBP only tracks the presence or absence of syntenic DNA fragments in the reference species with respect to the gene in the focal species and not whether those syntenic fragments are transcribed and translated into a protein. Thus, SBP can overestimate age when a reference species harbors the orthologous DNA but does not express the protein. Taking the myeloma overexpressed (MYEOV) gene as an example, SBP showed that the DNA sequence emerged in a common ancestor of humans and opossums (Supplemental Fig. S4A). However, MYEOV has been reported to be a primate-specific de novo protein-coding gene (Chen et al. 2015), which is also supported by phylostratigraphy and ProteinHistorian (Supplemental Fig. S4B,C).
By presenting both the gene- and family-level dating results, GenTree allows users to have a comprehensive view and choose the most appropriate age estimate based on the specific context. Taking the aforementioned GLUD2 as an example, both SBP and the previous synteny-based report (Burki and Kaessmann 2004) showed that GLUD2 is a hominoid-specific retrogene, whereas phylostratigraphy and ProteinHistorian dated this gene back to the common ancestor of cellular life (Supplemental Fig. S5). The latter assignment is consistent with the gene family, including GLUD2, being evolutionarily old. Indeed, SBP dates the other member of the family, that is, GLUD1, as predating the vertebrate split (Supplemental Fig. S6). Together, the results of the three methods for this family suggest that GLUD1 is an old gene shared by cellular organisms, whereas GLUD2 is a PSG.
SBP detects and controls for less reliable synteny
The quality of synteny constructed by whole-genome alignment (Kent et al. 2003) determines the accuracy of dating result of SBP. In the initial release of SBP, we introduced two functionalities to detect and mask less reliable synteny (Zhang et al. 2010a,b). We first excluded genes that have >70% of exons consisting of transposable elements (TEs). TEs are known to form nested clusters in mammals (Abrusán et al. 2008) and thus cause difficulties in between-species alignment. Even if a TE does not form a cluster, the identification of its bona fide ortholog is often not straightforward. Following a similar reason, we excluded Y-linked genes because Chromosome Y is full of TEs and remains poorly assembled for most reference species. Overall, the filter of TEs led to the exclusion of 177 (0.9%) genes.
Second, we dealt with recently duplicated genes, which tend to have low-quality synteny because of the difficulty in assembly or alignment. We cannot simply mask all recent duplicates, however, because they account for a large number of PSGs (Bailey and Eichler 2006; Kemkemer et al. 2009). Instead, we identified and masked 661 (3%) genes that show patchy phylogenetic distribution of orthologs, which often suggest problematic synteny inference (Methods). For example, a well-known human-specific duplicated fusion gene, CHRFAM7A (Costantini et al. 2015), showed reciprocal synteny in orangutan but not in chimpanzee and gibbon (Supplemental Fig. S7A). Given such a patchy distribution of candidate orthologs, we masked this gene from dating. Actually, the aforementioned synteny was detected based on the old orangutan assembly (Supplemental Fig. S7A), which disappeared on the new orangutan assembly (Supplemental Fig. S7B). Such a scenario is likely due to a sequencing gap in the old assembly (Supplemental Fig. S7C), and thus it makes sense to mask this gene. Furthermore, primate-specific synteny breaks are known to be enriched with recent duplicates (Kemkemer et al. 2009). For 82 coding genes located in synteny breaks, 12 (15%, Supplemental Table S1, Methods) were masked and 27 (33%) were dated as PSGs, both of which are significantly higher than the background proportion (binomial test P < 1 × 10⁻⁴).
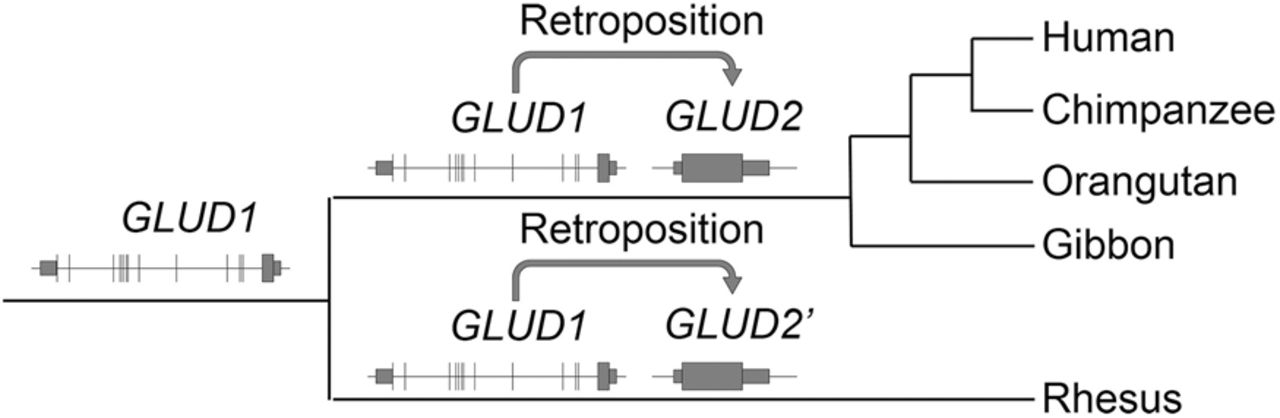
In this work, we added a third filter to control for spurious synteny caused by convergent dispersed duplication. As shown in the case of GLUD2, our original implementation of SBP (Zhang et al. 2010b) dated its origination to just before the split of human and rhesus macaque. However, the previous work (Burki and Kaessmann 2004) showed that GLUD2 predated the split of human and gibbon (Fig. 2A). We traced this discrepancy to errors in the synteny inference in which the UCSC synteny view and manual sequence alignments showed that an independent retroposition occurred in the evolution of rhesus monkey, which confounded the construction of synteny (Fig. 4; Supplemental Fig. S8). To handle such scenarios, we took advantage of UCSC annotations of synteny tracks and excluded nonsyntenic maps, which affected 182 (1%) genes (Methods).
Two independent retropositions of GLUD1 in primate evolution.
Gene dating by SBP is robust across Ensembl releases and conservative for PSGs
We previously showed the general consistency of SBP with a few small-scale synteny-based data sets of gene ages (Zhang et al. 2010a,b). Given the availability of multiple SBP-based genome-wide age data releases and recently generated data sets of PSGs and HSGs, we herein perform a more thorough comparison between this work and published data sets.
First, we compared the current estimates with previous SBP-based estimates (Zhang et al. 2010b, 2012). It is worth noting that the SBP method used in the present work is not different from what was used previously, except the newly added filter for nonsyntenic maps. We thus focused on how different Ensembl versions affect age estimates of SBP. As shown in Figure 5A, the effect of Ensembl releases on the age estimate is small: Between Ensembl v51 and v73, 18% of the genes were assigned different ages. The difference between Ensembl v65 and v73 is even smaller, affecting just 5% of the genes. The relatively large difference between v51 and v73 is attributable to the following factors: (1) differences in the human genome assemblies (NCBI build 36 vs. GRCh37); (2) changes in the genome alignments owing to updates in both the human genome and the reference genome assemblies; and (3) gene structure changes (e.g., newly annotated exons) owing to updates in human gene annotation. In contrast, v65- and v73-based age data share the same human genome assembly, and the differences of reference species assemblies or gene annotations are also minor.
Evaluation of SBP-dated ages. (A) Bar plot showing percentage of genes with consistent, older, or younger ages in earlier SBP dating based on Ensembl v51 and v65 compared to the current work based on Ensembl v73. Only coding gene models maintained across different Ensembl releases are used. (B) Comparison between the current SBP release (Ensembl v73) and three published human-specific gene (HSG) or primate-specific gene (PSG) lists.
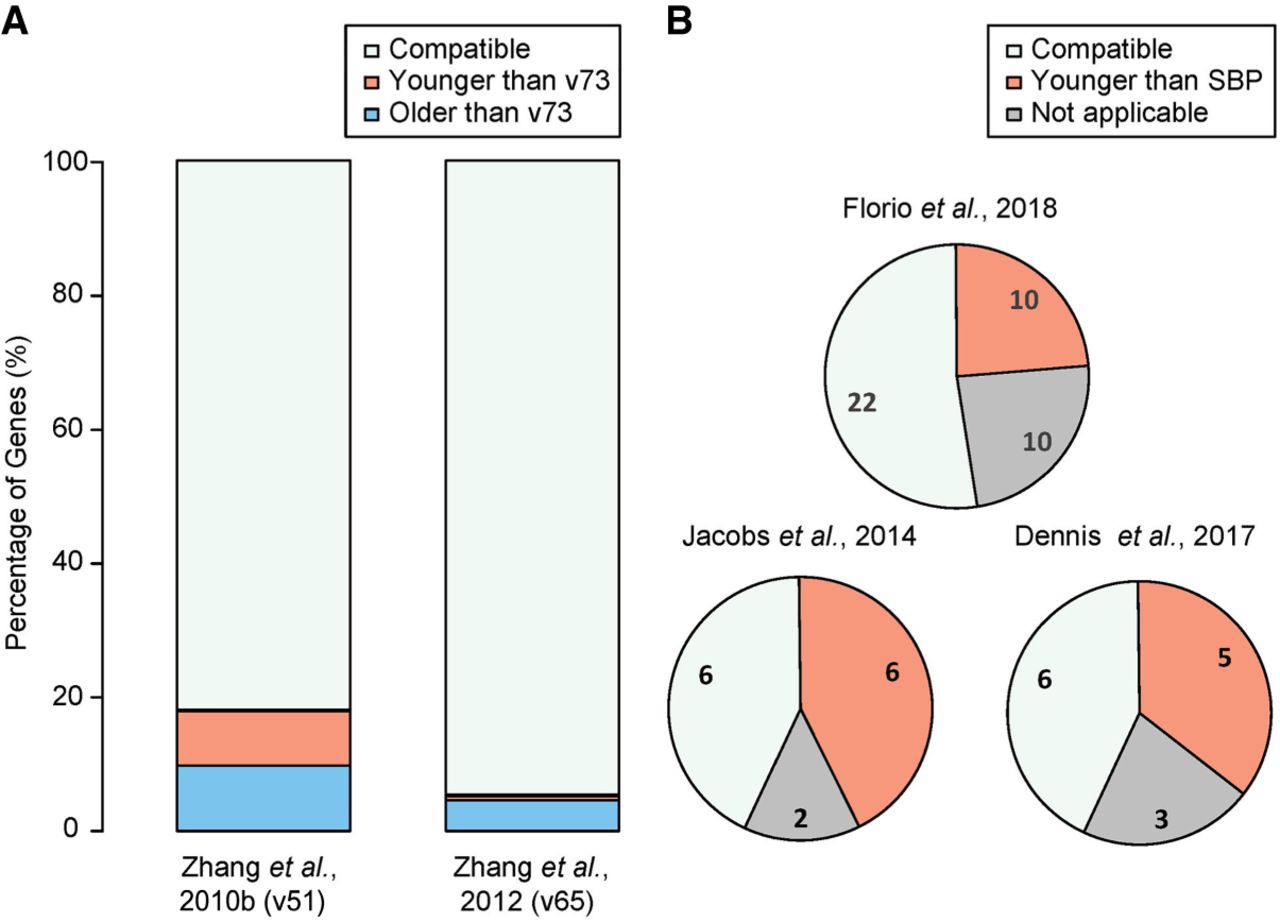
Next, we compared SBP-based estimates with three recently published lists of HSGs or PSGs, two of which are based on synteny (Dennis et al. 2017; Florio et al. 2018) and one based on phylogenetic tree reconstruction (Jacobs et al. 2014). We found that, on average, our results agree with the published lists in 50% of the cases (Fig. 5B; Supplemental Table S2). Among those that do not agree, 25% (e.g., the aforementioned CHRFAM7A) were attributable to genes being masked in our dating pipeline because of unreliable synteny.
For the remaining 25% of the cases, our estimates are older than the published estimates. The first reason for this is because we separately evaluated each exon in a gene, and when the results for all exons do not agree, we used the age of the oldest exon as the age estimate of the entire gene. Our rationale is that the oldest exon, being the most conserved, is likely also the most important for the gene's function. In cases in which exons have different age due to exon shuffling or partial duplication, the age of gene will be somewhat ambiguous (Capra et al. 2013). For example, the ankyrin repeat domain 20 family member A2 (ANKRD20A2) is classified as human-specific by Florio et al. (2018). However, the UCSC syntenic view showed that ANKRD20A2 is human-specific in its middle exons but orthologous with chimpanzee in terminal exons (Supplemental Fig. S9). This is why SBP dated this gene in the common ancestor of human and chimpanzee. A second reason could be intrinsic methodological difference. Specifically, Jacobs et al. (2014) focused on 14 primate-specific KZNFs identified based on reconstructed gene trees. SBP assigned an older age for six of the 14 cases. Because KZNFs are prone to gene conversion because of their tandem arrangement (Nowick et al. 2013), distortion of gene trees may occur. Therefore, SBP estimates could be more reliable for these cases.
In summary, we conclude that SBP is suitable for dating new genes, with its pros and cons listed below. On the up side, SBP as a computational pipeline is applicable to the genome-wide dating. It is robust to genome releases and is insensitive to the quality of annotation in the reference species. On the down side, SBP only looks for syntenic DNA fragments without assessing their transcription and translation potential, resulting in overestimates for de novo proteins. It also masks genes that have low-quality syntenic relationships with reference species, and this group is known to be enriched with young duplicates.
Given its strength and limitations, our final list of 805 PSGs consist of 777 entries dated by SBP plus 10 entries reported in the literatures but were excluded in our pipeline (e.g., CHRFAM7A, Supplemental Table S3) and 18 published primate-specific de novo genes (Chen et al. 2015; Ruiz-Orera et al. 2015; McLysaght and Hurst 2016). For the 18 de novo genes, eight are supported by phylostratigraphy and ProteinHistorian, whereas the remaining 10 are not included in their dating results, possibly due to differences in the Ensembl versions (Supplemental Table S3).
At least a portion of PSGs encode proteins, as supported by evolutionary constraint or peptide mapping
A second challenge in the study of PSGs is the instability of their annotation, as shown by changes from coding genes to pseudogenes between Ensembl releases (Zhang et al. 2012). We reasoned that PSGs with protein evidence are more likely to play an important role than those without. Therefore, we systematically evaluated the coding potential of PSGs by combining two approaches. The first took evolutionary information, that is, signatures of selective constraints for coding sequences. The second method searched peptides derived from the Human Proteome Map (HPM) covering 30 tissues or cell types (Kim et al. 2014).
Our evolutionary approach is based on the assumption that protein-coding genes generally show lower rates of nonsynonymous substitutions than synonymous ones (Ka/Ks < 1), with the exception of genes under positive selection. In total, we implemented four related tests. First, we used the conventional Ka/Ks test based on two orthologous sequences (Yang 2007). To have sufficient power (enough substitutions between the orthologs), this test requires the presence of a relatively distant ortholog. We thus applied this test to 94 PSGs predating the human–monkey split (Xu and Zhang 2016; Methods). Among these cases, we found 51 (54%) cases with a Ka/Ks value significantly smaller than one (q < 0.05, Table 1; Supplemental Table S4).
Statistics of evolutionary tests and proteogenomics mapping
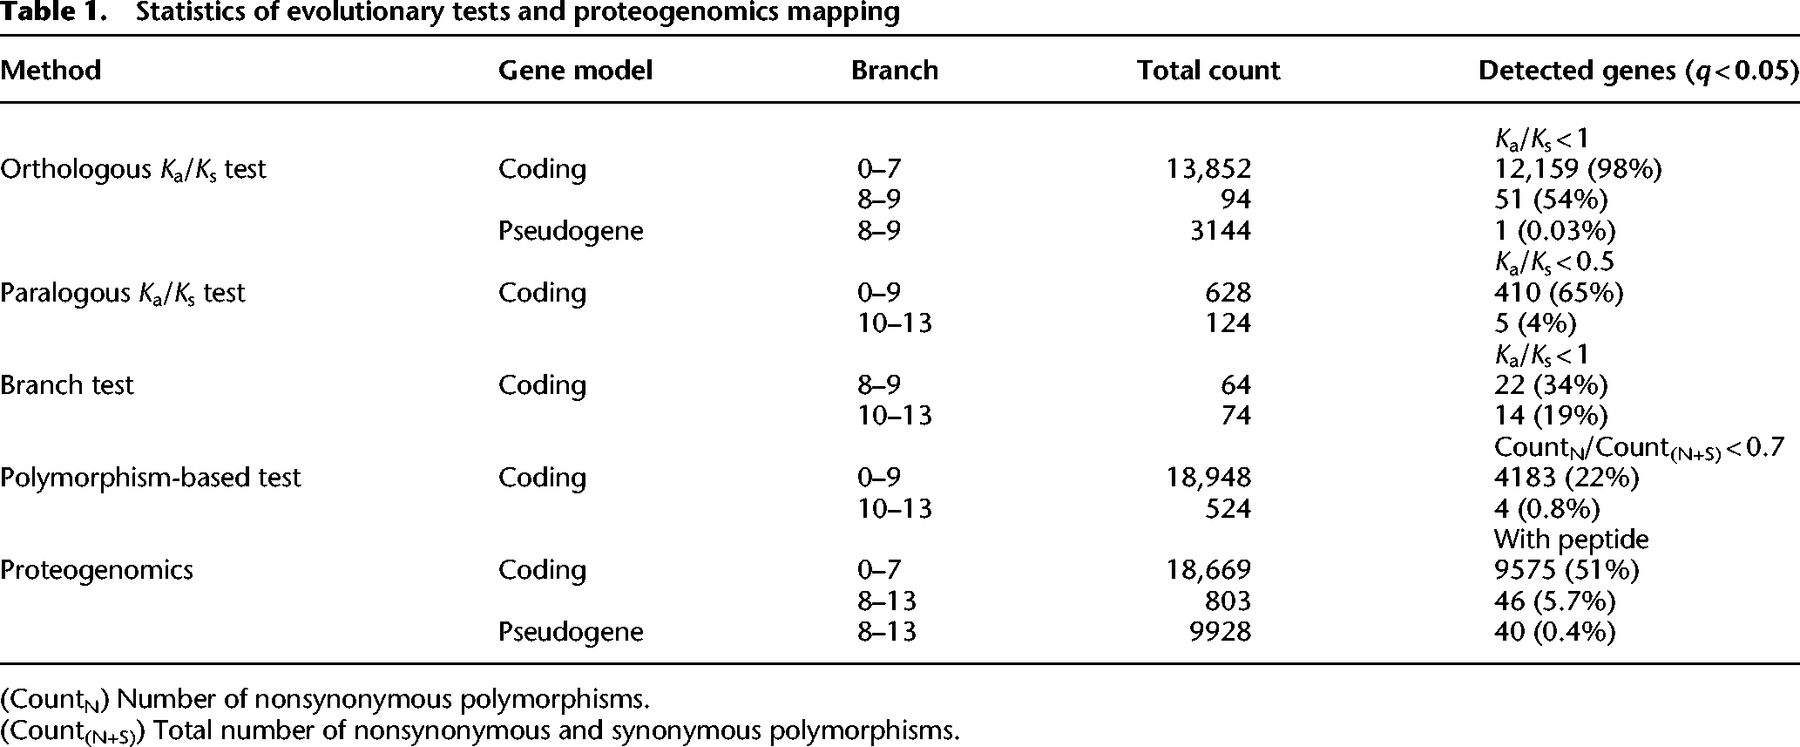
For duplicated PSGs that emerged after the human–rhesus split (branches 10–13 in Supplemental Fig. S1, e.g., GLUD2), we applied two modified versions of the Ka/Ks test. First, we compared the child copy with the parental copy instead of with the ortholog in a reference species. Under the null hypothesis in which the parental copy is under constraint (Ka/Ks < 1) and the child copy is nonfunctional (Ka/Ks = 1), we expect the Ka/Ks ratio between the child and parental copies to be less than one but not significantly lower than 0.5 (Betrán et al. 2002). A paralogous Ka/Ks ratio significantly lower than 0.5 is therefore taken as evidence for constraints on both copies. We applied this method to 124 pairs (Methods) and found five (4%) to be significant at this conservative threshold (Table 1; Supplemental Table S5). Second, we performed a branch-level test that included orthologous genes of parental genes in outgroup species (Methods). Because this test can examine the selection pressure specifically on the child gene branch, it is expected to have a higher power compared to the paralogous test. Consistently, out of 74 cases, 14 are significant (14/74 vs. 5/124, FET P = 0.001, Supplemental Table S6).
Finally, we applied the polymorphism-based test for PSGs postdating the human and rhesus macaque split. This method is conceptually similar to the orthologous Ka/Ks test but uses polymorphism instead of divergence (Moyers and Zhang 2016). For a coding region under neutrality, the ratio of nonsynonymous polymorphisms and all polymorphisms will be equal to that from the mutational input, which is approximately 0.7. A statistical paucity of nonsynonymous polymorphisms compared with that expected therefore indicates a protein-level constraint. We applied this test to 524 PSGs with at least one SNP available in the 1000 Genomes human variation data (The 1000 Genomes Project Consortium 2015) and found that only four of the 524 (0.8%) cases exhibited a significantly lower level of nonsynonymous polymorphisms (Table 1; Supplemental Table S7). This low fraction is unsurprising given that the polymorphism-based test is known to have low power to detect the signals of selection, because deleterious mutations can segregate at low frequencies before being removed by selection (Kryazhimskiy and Plotkin 2008).
In total, the four tests identified 93 (12%) PSGs under negative selection. In contrast, the tests applied to the old genes always yield much higher percentages (Table 1). This suggests that old genes in general experience stronger selective constraints because of their higher expression levels (Zhang et al. 2012; Zhang and Yang 2015).
Next, we searched the proteomic database for peptide evidence of the candidate PSGs. We processed the raw mass spectrometry data from all 30 HPM samples (Kim et al. 2014) by distinguishing child and parental copies (Methods). Among the PSGs, 46 (5.7%) had matching peptides. In contrast, 51% of the old genes (non-PSGs) had peptide evidence (Table 1; Supplemental Table S8). Among the expressed PSGs, ∼20% are predominantly expressed in the testis (Supplemental Fig. S10), which is consistent with the testis bias observed at the transcriptional level for new genes (Vinckenbosch et al. 2006; Kaessmann 2010).
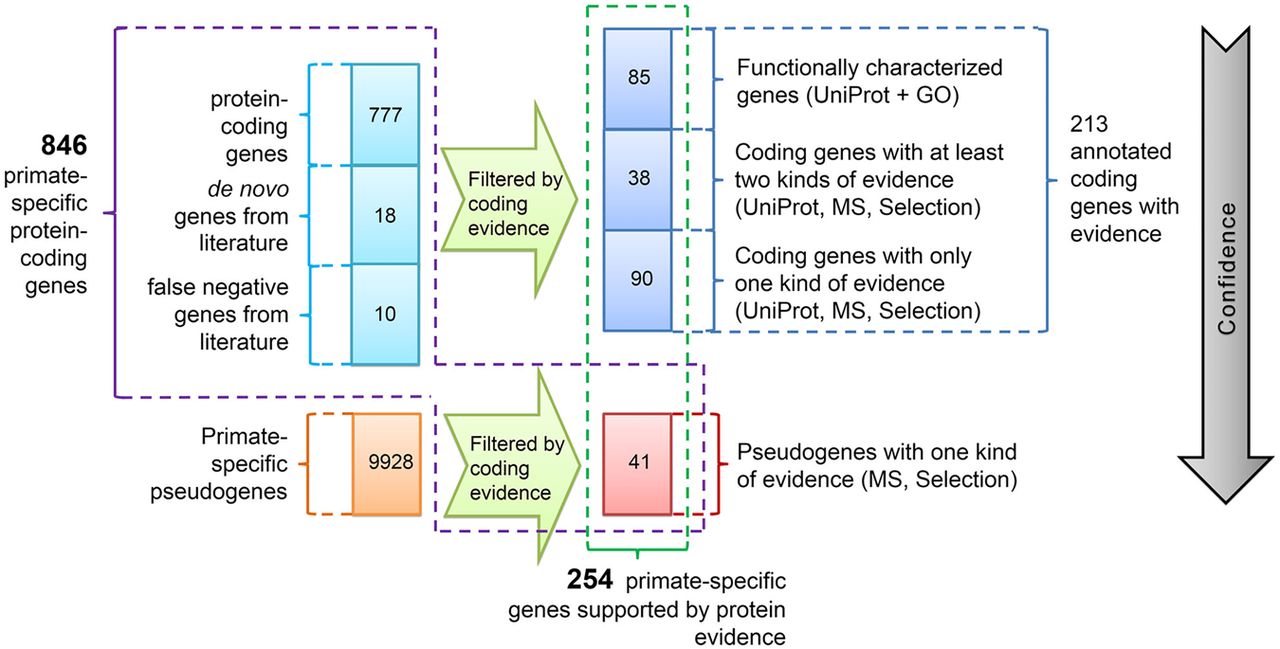
Combining the evolutionary tests and proteomic evidence, we identified a total of 123 of 805 (15%) coding PSGs that were supported by at least one method (Supplemental Table S9). Among 46 PSGs with peptide evidence, 16 (35%) were also supported by evolutionary analyses (Supplemental Fig. S11). Such moderate overlap could arise from method-specific false negatives or false positives. For example, the HPM proteomics data set recovered only half of the non-PSGs, likely due to the limited tissues that were sampled. A search of the 805 PSGs in the UniProt database (The UniProt Consortium 2015) revealed that 66 out of the 123 (54%) have been experimentally shown to encode proteins (Supplemental Fig. S11). In contrast, only 90 (13%) of the remaining 682 PSGs were experimentally supported based on UniProt. This suggests that the evolutionary and proteogenomic analyses we conducted are capable of identifying bona fide protein-coding genes.
After including the 90 PSGs with experimental support from UniProt, we obtained a nonredundant data set of 213 (28%, 123 + 90) PSGs that are protein coding. This represents the best annotation we can achieve at this time. In comparison, 16,252 of the 18,669 (87%) non-PSGs are supported by at least one type of evidence.
Forty-one primate-specific pseudogenes may encode proteins, and thus the human genome likely encodes 254 PSGs with coding evidence
Our initial list of 805 PSGs consists of Ensembl-annotated protein-coding genes and experimentally characterized PSGs reported in the literature (Supplemental Table S3). Given the difficulty of differentiating protein-coding genes from pseudogenes (Zhang et al. 2012; Mudge and Harrow 2016), we asked whether some primate-specific pseudogenes (PSPGs) may in fact encode proteins. To address this question, we performed computational analyses for 9928 SBP-dated PSPGs (Methods) as we did for PSGs.
Based on the open reading frames (ORFs) predicted according to the coding paralogs, we applied the orthologous Ka/Ks test to the 3144 PSPGs that predated human and rhesus monkey split, which shows relatively higher sensitivity (Table 1, Methods). However, consistent with PSPGs being annotated as pseudogenes in Ensembl, we identified only one entry under selective constraints (Table 1; Supplemental Table S10). Next, we queried the ORFs of the PSPGs against the HPM data and detected 40 translated entries (Table 1; Supplemental Table S11). For the nonredundant data set of 41 PSPGs, the protein-coding potential of 38 cases is further supported by ribosome-profiling data (Supplemental Table S12), which captures actively translated mRNAs collected by the GWIPS-viz database (Michel et al. 2015).
The criteria for annotating a pseudogene is the presence of premature termination codons (PTCs) or frame-disrupting indels relative to their coding homologs. The truncated transcript could be targeted by nonsense-mediated mRNA decay, and thus no protein is made (Yang et al. 2015). This, however, is not necessarily the case, and a short protein can be expressed and be functional (Xu and Zhang 2016). Indeed, for 37 of the 41 PSPGs identified above (Supplemental Table S12), proteogenomics or selective constraints suggest a short ORF (e.g., Supplemental Fig. S12), which is consistent with the presence of PTCs or indels. For the remaining four genes, we unexpectedly found that the proteomic evidence supports two tandemly linked short ORFs rather than a single truncated protein. In other words, these represent new gene structures that emerge from the fission of an ancestrally larger protein.
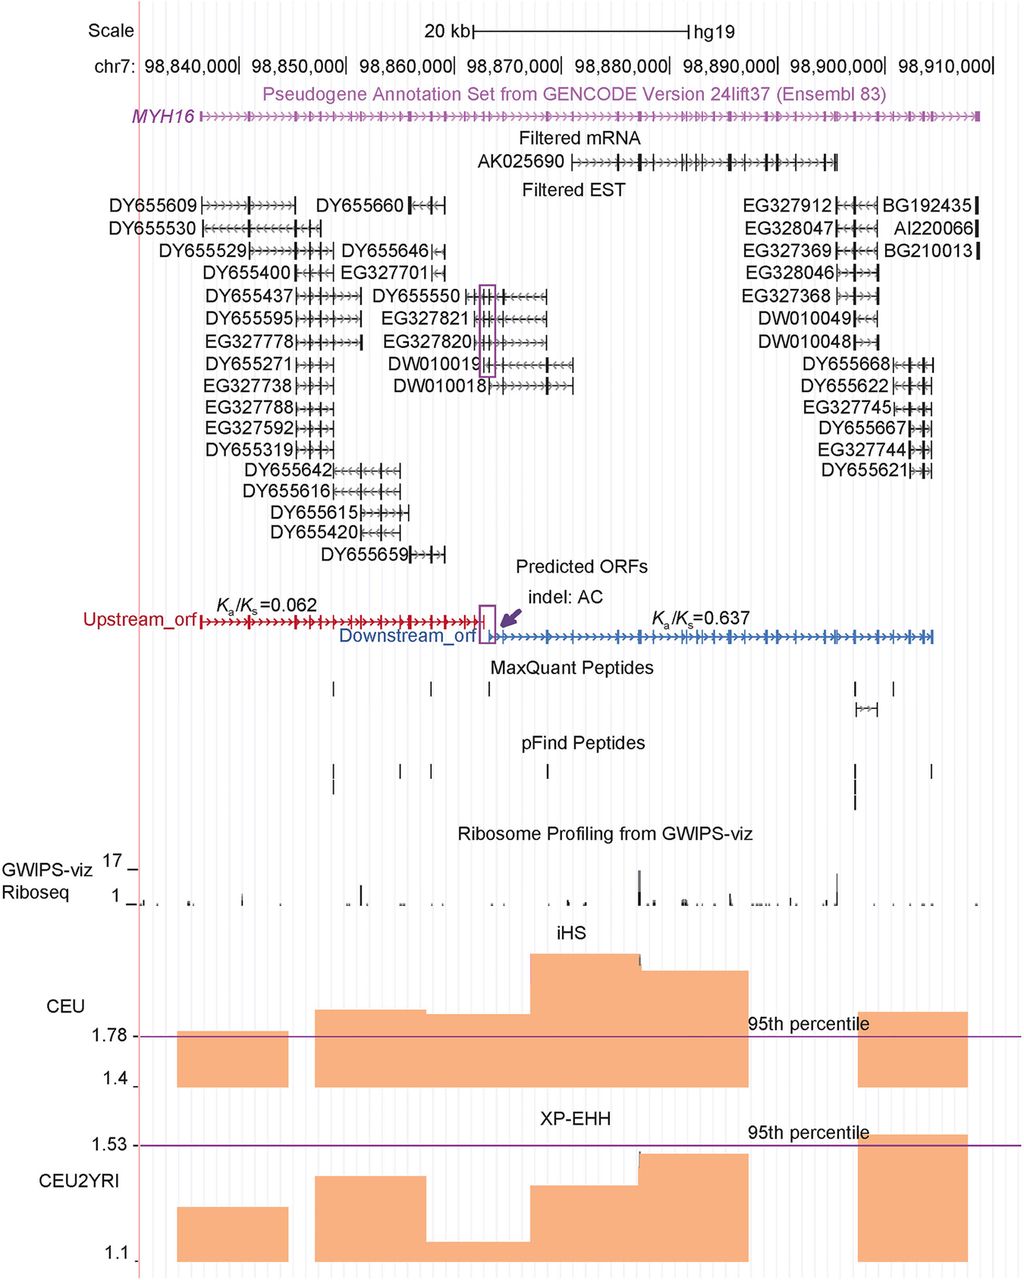
One of the four cases, MYH16, was believed to be a pseudogene due to a frame-disrupting indel, whose pseudogenization could cause jaw-dropping and brain expansion in human evolution (Stedman et al. 2004). Herein, we found that its fission status is well supported. Specifically, as shown in Figure 6, both mRNA and EST sequences strongly support a transcript with 41 introns flanked by the canonical splicing junction (GT-AG). This transcript could be translated as two ORFs based on the ancestral frame, which exactly flanks the indel. The HPM proteomics data showed that both the upstream and downstream ORFs are expressed with multiple matching peptides. Analogously, the ribosome-sequencing data support the existence of both ORFs (Fig. 6). These data are consistent with two previous reports: (1) The orthologous Ka/Ks values between human and chimp are less than one for both ORFs, although the difference is significant only for the upstream ORF (Perry et al. 2005); and (2) mass spectrometry data support the coding potential of the downstream ORF, which was further validated by synthetic peptides (Branca et al. 2014). Moreover, MYH16 is one of six PSGs that show signatures of recent positive selection based on the PopHuman database (Supplemental Table S13, Methods). In particular, this locus has a high integrated Haplotype Score (iHS) (Voight et al. 2006) and Cross Population Extended Haplotype Homozygosity (XP-EHH) (Sabeti et al. 2007) in the European population (Fig. 6).
Gene structure and expression of MYH16. The UCSC Genome Browser snapshot around the MYH16 locus is presented. The tracks including “Filtered mRNA” and “Filtered EST” show only the entries that are uniquely mapped to this locus. Because these mRNA and ESTs share a single compatible exon–intron structure, one transcript encoding 43 exons can be inferred, as shown by the GENCODE (Ensembl) pseudogene annotation track. MYH16 can therefore be translated as two ORFs separated by the indel (a deletion of “AC”), whose position is highlighted by the purple arrow. Two continuous exons supported by four ESTs (e.g., DY655550) are highlighted by a purple frame, indicating that these two ORFs are encoded by a single transcript. Uniquely mapping peptides detected by two algorithms (MaxQuant, pFind) and Ka/Ks values reported by Perry et al. (2005) are shown. The iHS and XP-EHH tracks from PopHuman were added, with the 95th percentile indicated by the purple line. CEU and YRI represent one European population and one African population, respectively.
In summary, we identified 41 annotated PSPGs that are likely to encode proteins. Together with the 213 PSGs identified in the previous section, a total of 254 candidate PSGs are supported by at least one type of protein-level evidence (Fig. 7). Among them, 85 are relatively well characterized, as supported by both protein-level expression in UniProt and GO terms (Supplemental Table S9). An additional 38 PSGs are supported by two types of protein evidence.
Two lists of primate-specific protein-coding genes. The entire list includes 846 (805 + 41) genes (framed with magenta outline). Among them, 254 entries (green outline) show varying levels of support for protein expression, of which 213 (blue outline) are annotated as coding genes and 41 (red outline) are pseudogenes that are likely misannotated. Herein, selection refers to all types of selective constraints mentioned above (Table 1; Supplemental Table S9). The gray arrow indicates the decreasing confidence in the coding status. One hundred ninety-two out of 846 PSGs are human-specific, whereas the number of that for 254 PSGs with protein evidence is 18.
Notably, although we did not specify a cutoff of ORF length for annotated protein-coding genes, the majority (85%, Supplemental Fig. S13) of PSGs are longer than the often-used cutoff of 100 amino acids (Hangauer et al. 2014). Under another cutoff designed for new genes, that is, 50 amino acids (Zhao et al. 2014), the proportion increases to 96%. For the small data set with coding evidence, the proportion will be 96% (>100) and 100% (>50), respectively.
PSGs are preferentially involved in spermatogenesis, mother–fetus interactions, defense responses, and brain development
To gain insight into the potential functions of the PSGs, we used the HPA transcriptome data integrated in GenTree and performed weighted gene coexpression network analysis (WGCNA) (Langfelder and Horvath 2008) for the 846 (801 + 45) candidate PSGs (Fig. 7; Methods). We identified 17 HPA-based modules (HMs), seven of which (HM1, -7, -9, -10, -14, -17, -21) were tissue biased (Supplemental Fig. S14; Supplemental Table S14). Among these seven modules, HM1 is associated with testis-dominant expression (Supplemental Fig. S14A,B), and GO term enrichment analysis suggested that HM1 genes are involved in spermatogenesis (Fig. 8, Methods).
In addition to the well-known testis bias of new gene expression (HM1) (Vinckenbosch et al. 2006; Tay et al. 2009; Kaessmann 2010; Xie et al. 2012), we found a similar extent of enrichment of PSGs in the placenta-biased module (HM21 in Fig. 8; Supplemental Fig. S14A,B). For example, one member gene, that is, primate-specific galectin 16 (LGALS16), has been shown to mediate maternal–fetal interaction by promoting immune cell death (Than et al. 2009). LGALS16 shows strong LD in African population as shown by an outlier iHS score (1.81, Supplemental Table S13), suggesting that this gene may be subject to local adaptation. In contrast, HM7, which contains adult brain-biased genes, shows a significant deficit of PSGs. This finding is consistent with the observation that the adult brain transcriptome is conserved between humans and mice (Strand et al. 2007). Similarly, the 10 modules containing broadly expressed genes tend to consist of fewer PSGs than the genome average, although this difference is significant for only five modules (HM4-5, HM8, HM11-12) (Fig. 8). This pattern is also consistent with the known tendency of new genes to be tissue-specific (Zhang et al. 2012).
Percentage of PSGs within each coexpression module generated based on HPA adult tissue transcriptome. The genome-wide percentage of PSGs (3%) is indicated with a horizontal pink line, whereas modules exhibiting a significant excess or paucity (Bonferroni-corrected P < 0.05) of PSGs are indicated in light red and light blue, respectively. Nonsignificant categories are shown in gray. The corresponding multitesting adjusted P-values are marked above the boxes. The seven tissue-biased modules are labeled with their corresponding tissue names. For testis-biased, bone marrow–biased, and placenta-biased modules, the top five significantly enriched GO terms are shown.
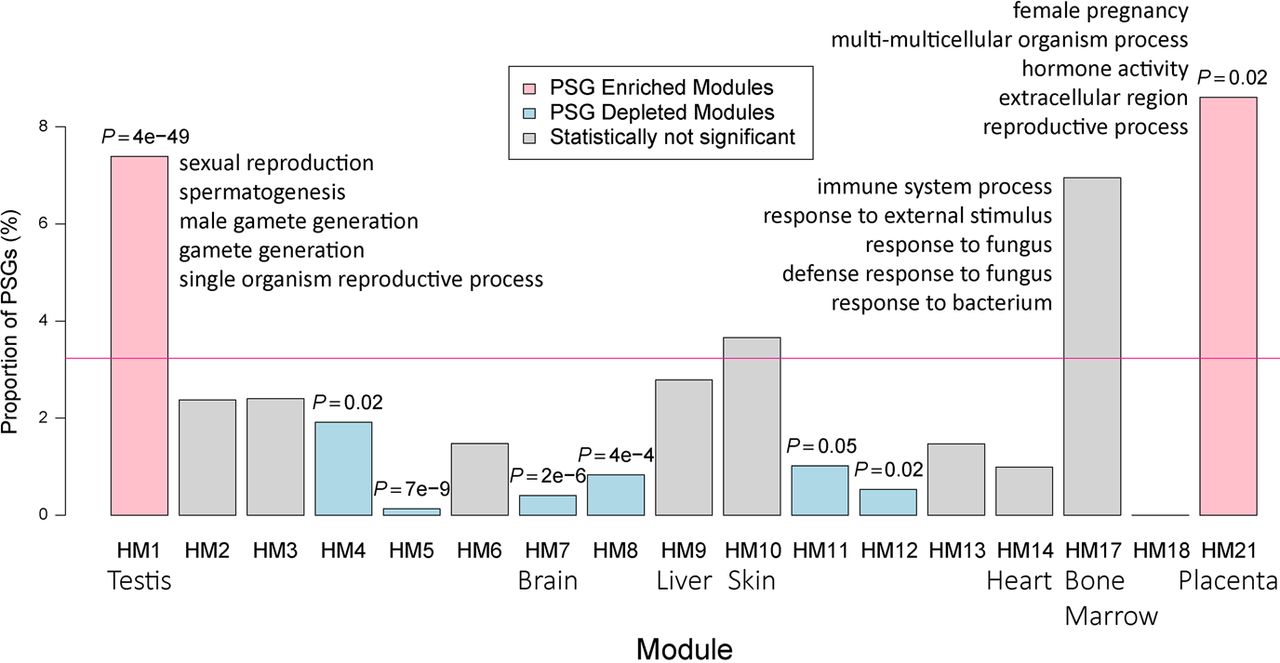
To increase our confidence in the above trends (Fig. 8), we repeated the enrichment analyses in the smaller data set of 254 PSGs with protein evidence. All patterns were reproducible (Supplemental Fig. S15), although the statistical significance was often lower because of the smaller sample size. One exception was HM17, for which the enrichment of PSGs was more significant in the smaller data set (P = 0.02) than in the full data set (P = 0.18). The genes in HM17 are mainly transcribed in bone marrow and have functions related to immune responses (enriched GO terms in Fig. 8; Supplemental Fig. S14A,B; Supplemental Table S14). Because immune processes are subject to frequent gene family expansion and contraction (Demuth and Hahn 2009) and HM17 consists of known PSGs (e.g., glycophorin B [GYPB]) (Tarazona-Santos et al. 2011), we reason that the overrepresentation of PSGs in this module is likely genuine.
We then replicated our HPA-based analyses with the GTEx data set (Supplemental Table S15). Results based on GTEx confirmed that PSGs are enriched in the testis-dominant module (GM1) and is depleted in the brain-dominant module (GM2) or broadly transcribed modules (Supplemental Fig. S16). Because GTEx does not have placenta or bone marrow samples, we could not make a direct comparison for these tissues.
Previously, we and others have shown that new genes are overrepresented among brain-biased genes (Tay et al. 2009; Zhang et al. 2011; Xie et al. 2012), which presents an apparent contradiction to the deficit of PSGs in HM7 and GM2 (Fig. 8; Supplemental Fig. S16). One possible explanation is that the current pattern is based on expression levels in adult brain alone, whereas previous results were based on a broad range of developmental stages (e.g., fetal brain). To test the hypothesis that PSGs are differentially recruited to different brain developmental stages, we investigated the expression pattern of PSGs in fetal and infant brains using the previously generated coexpression modules for those stages (Parikshak et al. 2013). Among the 12 brain-related modules (BMs) (Supplemental Table S16), PSGs are overrepresented only in BM2 (P = 1 × 10⁻⁵, Fig. 9A; and P = 1 × 10⁻⁵ for smaller data set, Supplemental Fig. S17). This module consists of genes up-regulated between 12 and 22 wk postconception, when progenitor proliferation and cell-fate specification in the brain occur (Parikshak et al. 2013). Notably, BM2 is also one out of five coexpression modules associated with autism disease risk (Parikshak et al. 2013).
Percentage and connectivity of PSGs within each coexpression module generated based on brain developmental transcriptome. (A) Bar plot of PSG enrichment in precomputed modules (Parikshak et al. 2013). Notably, only a proportion of the 846 PSGs were included in the analyses (Parikshak et al. 2013). Below each module, the developmental period in which the genes are up-regulated is shown. PCW and MAB refer to “post conception weeks” and “months after birth,” respectively. For example, BM13, -16, and -17 show peak expression in the late fetal to early postnatal stage, with moderate differences in their temporal profiles (Parikshak et al. 2013). Autism-associated modules are masked in blue. Only BM2 shows significant enrichment of PSGs (indicated in light red) relative to the genome-wide percentage (pink horizontal line). (B) The distribution of connection degree within coexpression modules was shown separately for PSGs and non-PSGs as violin plots, where the black bar in the center indicates the interquartile range, the violin curve indicates the probability density of the data, and the white dot indicates the median. Only the three modules with more than 10 PSGs are shown here.
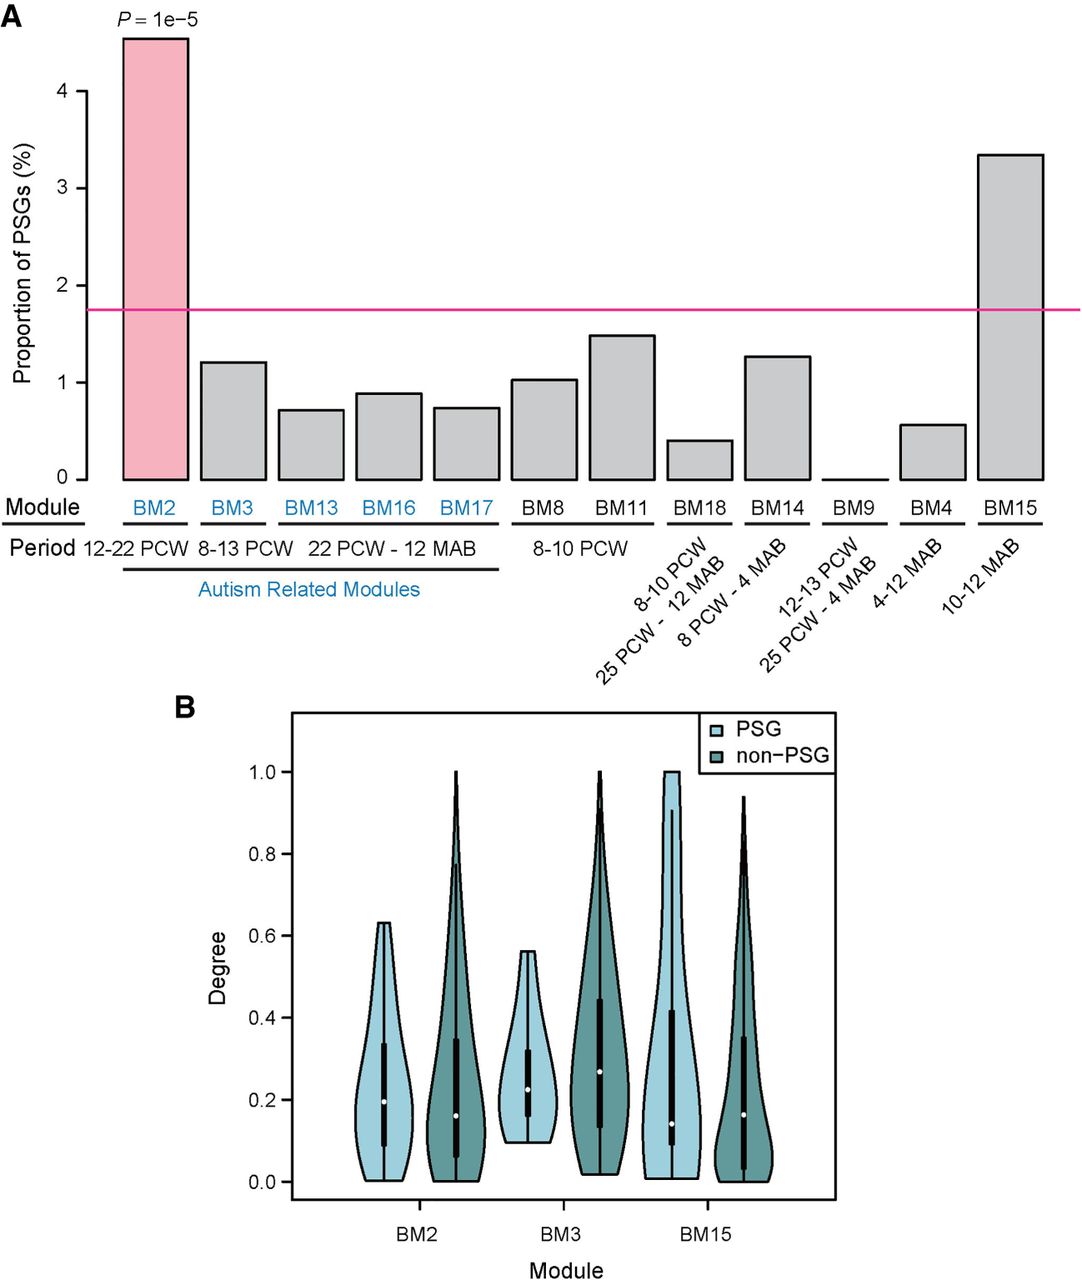
When we examined the centrality of genes in the coexpression network, we found that PSGs in BM2 show higher centrality than non-PSGs, although the difference is not statistically significant (Fig. 9B). In contrast, this pattern is reversed in other modules. It is known that transcription factors tend to be hubs of coexpression networks compared with other gene groups (Parikshak et al. 2013). Together with the fact that KZNF-type transcription factors are overrepresented in PSGs (Supplemental Fig. S3), we tested the hypothesis that KZNFs drive the higher centrality of PSGs in BM2. Indeed, we found that compared with other modules, BM2 consists of a much higher proportion of primate-specific KZNFs (18 vs. 0 – 8, FET P < 0.05) (Supplemental Table S16), which tend to have higher centrality compared with non-KZNFs (Supplemental Fig. S18A) and be up-regulated in the mid-fetal stage (Supplemental Fig. S18B). Actually, the 10 PSGs showing the highest centrality in BM2 (Fig. 9) include nine KZNF members and eukaryotic translation initiation factor 2 subunit gamma B (EIF2S3B). The top connected gene is ZNF430, which is among the six PSGs (similar to MYH16) with signatures of recent positive selection (Supplemental Table S13), showing high population differentiation between European and African populations and exhibiting a long haplotype in the European population. Moreover, an ancestral branch statistic-based test also detected signatures of selective sweep around ZNF430 in the European population (Cheng et al. 2017). Lastly, the association between ZNF430 and autism is reproduced recently in a transcriptome study based on iPSC neurons of autism patients (Adhya et al. 2018).
In summary, we conclude that PSGs such as KZNFs are specifically recruited into mid-fetal brain, which contribute to the aforementioned brain bias of new genes.
Discussion
We developed GenTree as an integrated resource to facilitate the functional studies of new protein-coding genes in the human genome. The rich data underlying this database not only enable the genome-wide evaluation of dating and annotation methods for the first time but also allow us to generate a list of PSGs and a global quantitative view of their functional bias. Because new genes share similar features (e.g., low expression) across different animal systems (Zhang et al. 2012; Schlötterer 2015), we expect that our approach and findings may have wider implications.
Inference of the protein-coding potential of new genes requires both evolutionary and proteomic approaches
Both selective constraints and proteogenomics (Branca et al. 2014; Kim et al. 2014; Wright et al. 2016) have been used to annotate proteins. Here we applied both methods toward new genes on a genome-wide scale. Our results suggest that the two methods should be used in combination to complement each other's strength and weakness.
The advantage of evolutionary inference is that it is directly related to fitness and, thus, the function of proteins. However, it also has two limitations. First, it only works for ORFs with a sufficient length (e.g., >600 bp) (Marques et al. 2005). For small ORF encoded polypeptides (SEPs; <300 bp) (Saghatelian and Couso 2015), the evolutionary tests may not work given the scarcity of substitutions. A second issue is that evolutionary tests, including the orthologous Ka/Ks test, paralogous Ka/Ks test, and branch test, only reflect the functionality of a protein in its evolutionary history rather than its status as of now (Mudge and Harrow 2016).
Compared to evolutionary tests, which are restricted to genes that satisfy certain criteria (e.g., the presence of homologous sequences), proteogenomics works for all genes in principle. Furthermore, evolutionary methods only suggest protein-coding potential, whereas proteomic evidence is more intuitive, and unambiguous protein-level evidence like mass spectra has been argued to be mandatory for a novel coding gene model (Bruford et al. 2015). In our work, a gene is expected to be expressed as a protein given presence of at least two mass spectra (Supplemental Methods). Consistently, 38 of 46 (83%) PSGs that were supported by peptides have been experimentally characterized as protein-coding genes in the UniProt database (Supplemental Fig. S11). In contrast, only 41 of 93 (43%) PSGs that were detected through evolutionary analyses have been identified as protein-coding genes (FET P = 2.2 × 10⁻⁵). Thus, our proteomic analyses are highly conservative and accurate. Nevertheless, the presence of peptides does not necessarily mean that the corresponding protein is functional (Xu and Zhang 2016). In fact, only 15% pseudogenes with peptide evidence show protein-level purifying selection (Xu and Zhang 2016). Thus, an ideal protein-coding gene model should be supported by both selection and the proteomic evidence. However, in this work we chose to include all PSGs supported by any one of the methods, given their individually low power (Table 1; Fig. 7).
PSGs contribute to phenotypic evolution
Through genome-wide dating and reannotation, we generated a high-quality data set of PSGs and inferred the functional bias of PSGs by classifying genes into coexpression modules. The results corroborated known patterns. Specifically, for the brain bias of new genes (Zhang et al. 2011), our analysis revealed a complex pattern, in which the previously observed enrichment for new genes is restricted to the mid-fetal stage, whereas there is in fact a paucity of PSGs among the adult brain-specific genes (Figs. 8, 9). For the overrepresentation of PSGs among placenta-biased genes (Knox and Baker 2008), our results strengthened previous observations, showing an even greater excess (50% to 170%). We also detected a novel pattern, that is, the enrichment of PSGs implicated in the defense response (Fig. 8; Supplemental Fig. S15), which is not surprising given the rapid gene family evolution in immune response (Demuth and Hahn 2009). Thus, new genes are either recruited to processes under tremendous selection pressure, such as male reproduction and defense, or to processes supporting an evolving novel organ, such as an expanded brain and placenta. Similar to the results for the fetal brain (Fig. 9B), the centrality of PSGs in testis, bone marrow, and placenta is also higher (Supplemental Fig. S19), suggesting the functional importance of PSGs in these organs. It is worth noting that our functional enrichment analyses were based on data that are still limited in tissue and developmental-stage coverage. Thus it is possible that PSGs are also recruited to other important processes not covered by these data sets (e.g., injury response) (Costantini et al. 2015; Baird et al. 2016).
Besides the global patterns, our meta-analyses also help prioritize candidates for follow-up functional studies, especially considering the majority of PSGs are uncharacterized (Fig. 7; Zhang et al. 2012). The aforementioned MYH16 and ZNF430 are most notable. Orthologs of MYH16 are known to be transcribed in masticatory muscles of primates (Stedman et al. 2004). In contrast, the two derived ORFs in human are transcribed in multiple tissues such as stomach and testis (Supplemental Fig. S20A,B). GWASdb2 further implicates this locus in Crohn's disease and osteoarthritis, lending support to its neofunctionalization in nonmuscle tissues (Supplemental Fig. S20C). From this aspect, four cases including MYH16 (Supplemental Table S12) represent a neofunctionalization model of gene fission in which LoF mutations led to the fission of the ancestral gene into two smaller ORFs and possible domain decoupling. This model is substantially different from the traditional subfunctionalization model of gene fission, which occurs by duplication followed by complementary degeneration in each copy (Wang et al. 2004; Zhou and Wang 2008).
ZNF430 represents another interesting case given its high centrality (BM2, Supplemental Fig. S18) and signal of positive selection (Supplemental Table S13). Notably, KZNFs overall are subject to frequent domain evolution (Nowick et al. 2010, 2011). We thus analyzed the domain evolution of PSGs and tested whether BM2 was enriched with PSGs with domain changes. Consistently, BM2 covers six out of 13 PSGs with domain changes (Supplemental Data Set 1), which is significant compared with the overall background (binomial test P = 0.001). The excess is mainly contributed by five KZNFs: (1) changes of zinc-finger copy numbers (ZNF320 and ZNF486) and (2) loss of KRAB (ZNF117, ZNF138, ZNF714). ZNF486 and ZNF117 are particularly notable. ZNF486 shows copy number difference of zinc fingers between rhesus monkey and human/gibbon lineage (Supplemental Data Set 1), which may cause the difference of binding (Nowick et al. 2010). Furthermore, ZNF486 is associated with copy number variant in children with motor coordination disorder, implicating its importance in brain development (Mosca 2013). ZNF117 is subject to two independent losses of KRAB in both the ancestor of human and chimpanzee, and the gibbon lineage, respectively (Supplemental Fig. S21). For an old KZNF shared by mammals, i.e., ZNF268, loss of KRAB is reported to resort proteins from nucleus to cytoplasm and thus cause radical functional changes (Wang et al. 2013). Whether ZNF117 situates in the same scenario and how its different location shapes brain developmental program across primate warrant future studies.
In summary, PSGs represent a group of genes potentially driving phenotypic evolution in primates.
GenTree will be more interactive and fine-tuned for functional studies of new genes
We plan to improve GenTree from the following three aspects. First, our analyses show how complex it is to date and annotate new genes (Figs. 5, 7). It seems that manual curation is still the best method for some cases (e.g., CHRFAM7A). Thus, similar to other popular databases (e.g., FlyBase) (Crosby et al. 2007), GenTree will be more community driven in future updates. For example, an interactive form can be designed to allow users to comment on age and coding status. Second, our coexpression analysis corroborated the narrow expression of new genes. Single-cell transcriptomes provide higher spatiotemporal resolution than bulk tissue data currently integrated in GenTree. Actually, for PSG-biased tissues such as fetal brain or testis, single-cell data are recently becoming available (Nowakowski et al. 2017; Wang et al. 2018). After controlling mapping ambiguity, such data will be more helpful in motivating function-related hypotheses than bulk data (e.g., HPA). Finally, isoforms likely have different evolutionary ages (e.g., Supplemental Fig. S22). Although users can view ages of different isoforms in the current release, the other functionality on web pages (e.g., transcriptional quantification) is only available for the representative isoform, which can be optimized in future.
Methods
For an extended version, please see Supplemental Methods.
General gene data set and computational tools
We used Ensembl v73 (October, 2013) (Flicek et al. 2012) as our core gene set. The longest principle transcript (Rodriguez et al. 2015) was used to represent each gene unless otherwise noted. We used MySQL v5.1.61 for storing and querying the data, BioPerl and BioEnsembl to assemble the pipeline, and R v3.2.3 (R Core Team 2007) to perform statistical analyses.
Synteny-based pipeline
We dated 20,300 Ensembl (Flicek et al. 2012) annotated coding genes located on the major chromosomes, based on our previously described SBP (Fig. 1; Supplemental Table S3; Zhang et al. 2010a,b). Briefly, for each gene, we inferred the phylogenetic distribution of its orthologs based on the whole-genome alignment generated by the UCSC Genome Browser (Kent et al. 2003; Rhead et al. 2010) and assigned evolutionary age according to the most ancient exon (Supplemental Fig. S1). We excluded 838 (4%) genes from dating because of their unreliable synteny: (1) genes with >70% exonic regions overlapping with RepeatMasker (Smit et al. 2017) tracks of UCSC or genes situated on Chromosome Y; (2) genes with a patchy phylogenetic distribution of orthologs, which tended to be covered by known synteny breaks (Kemkemer et al. 2009). As an improvement compared to our previous studies (Zhang et al. 2010a,b), we excluded the UCSC alignment blocks labeled as two-way nonsyntenic (“nonsyn”).
Analogously, we also dated 14,134 pseudogenes and identified 9927 primate-specific entries. For MYH16, although the coding region was inferred as emerging on branch 2 (Supplemental Fig. S1), the indel in MYH16 was known to postdate the human–chimpanzee split (Stedman et al. 2004). Given the extensive study of this locus in the fields of evolutionary genetics (Stedman et al. 2004) and proteogenomics (Branca et al. 2014), we manually merged it into the data set of primate-specific pseudogenes (9928 PSPGs).
Comparison across age data sets
To evaluate the quality of SBP, we integrated two genome-wide age data sets including phylostratigraphy (Domazet-Lošo and Tautz 2010) and ProteinHistorian (Capra et al. 2012) and three recently published HSG or PSG lists (Jacobs et al. 2014; Dennis et al. 2017; Florio et al. 2018). We examined how SBP agreed with these data sets.
Robustness of PSG list between GRCh37 and GRCh38 assembly releases
By lifting PSGs from GRCh37 (Ensembl v73) to GRCh38, we found that only 5% (45/846) of the genes could not be lifted with 100% coverage, and these gene models got expired in the new release. By comparing PSG or HSG lists based on GRCh38 (Dennis et al. 2017; Florio et al. 2018) with our GRCh37-based lists, we found that only eight (12%) gene models are unique to GRCh38. This degree of alternation (5% or 12%) is not expected to change our functional enrichment analysis (e.g., Fig. 8).
Inference of origination mechanisms
We inferred gene origination mechanisms as DNA-mediated duplicates, retrogenes or de novo genes as previously described (Zhang et al. 2010a,b). We further curated a list of de novo genes from recent literature (Chen et al. 2015; Ruiz-Orera et al. 2015; McLysaght and Hurst 2016). To be conservative, only 18 entries that are annotated as coding genes in Ensembl v73 were retained.
RNA-seq data processing
We first downloaded the HPA RNA-seq data set of 27 tissues (Uhlen et al. 2010). We took the splice-aware mapper STAR (v2.4.0k) (Dobin et al. 2013) to align the reads to the human genome guided by the Ensembl annotation. The output of “quantMode” was served as the input of the quantification software, RSEM (v1.2.19) (Li and Dewey 2011). As a complementary data source, we also integrated the GTEx data set covering 32 tissues (The GTEx Consortium 2015). Specifically, to control the heterogeneity, we picked 1936 samples from individuals who are of European descent with an age between 20 and 50 yr. We excluded those low-quality samples with an RNA integrity (RIN) value less than seven. We performed quantification via kallisto because of its high speed (Bray et al. 2016). We finally integrated the BrainSpan transcriptome because of the expression bias of new genes in brain (Tay et al. 2009; Zhang et al. 2011; Xie et al. 2012). Because BrainSpan does not provide raw sequencing data, we incorporated its precomputed FPKM values directly into GenTree.
Analyses of selection force
We performed four types of tests for coding genes, all of which are followed by multiple test corrections via the qvalue package (http://github.com/jdstorey/qvalue).
First, for the orthologous Ka/Ks test, we extracted the orthologs from the rhesus macaque based on the Ensembl Compara database (Vilella et al. 2009) and the UCSC synteny data. We aligned the protein sequence and translated this alignment to a codon-level alignment. We then ran the PAML 4.8 package (Yang 2007) to perform the likelihood ratio test (LRT) with the expectation of Ka/Ks as one after excluding less reliable alignments. Second, for the paralogous Ka/Ks test, we constructed the protein sequence alignment using BLAST (bl2seq 2.2.26) based on the parent–child gene relationship. We performed LRT with the expectation of 0.5 (Betrán et al. 2002). Third, for the branch test, we focused on PSGs with a parental copy that predates primate and rodent split or emerges even earlier. We then tested whether the derived copy branch shows a Ka/Ks significantly smaller than one. For the PSGs with a Ka/Ks smaller than one, we excluded potentially pseudogenic entries identified by the olfactory receptor database (https://senselab.med.yale.edu/ordb/). Finally, for the polymorphism-based test, we downloaded the latest phase3 data of the 1000 Genomes Project (1000GP) (The 1000 Genomes Project Consortium 2015) and tested whether nonsynonymous SNPs are <70% relative to the sum of synonymous and nonsynonymous SNPs (Moyers and Zhang 2016).
For 3538 PSPGs predating the human and rhesus monkey split, we only implemented the orthologous alignment-based Ka/Ks test after predicting ORFs based on the parental proteins.
GenTree also integrates the PopHuman database (Casillas et al. 2017), which provides FST, XP-EHH, and iHS tracks related to positive selection.
Domain evolution
For each PSG and its orthologs, we performed a domain search for the longest protein via the “search_pfam.pl” script based on the Pfam v31 database (Finn et al. 2015). By following the Dollo parsimony, we identified candidate domain gain or loss events. We identified 85 events, 72 of which were caused by confounding factors (Supplemental Table S17).
Mass spectrometry data analyses
We modified the published pipeline (Kim et al. 2014) as follows: (1) We implemented free software pFind v2.8 (Li et al. 2005; Wang et al. 2007) and MaxQuant v1.5.3.30 (Cox and Mann 2008); (2) we discarded peptides with more than four electric charges; (3) the more rigorous group level false discovery rate was estimated for peptides from PSGs when pFind was used (Fu and Qian 2014; Zhang et al. 2015); (4) we excluded peptides mapping to multiple genes or different genomic locations; and (5) we discarded peptides in which the only mismatches between top two hits are isoleucine versus leucine, which are not distinguishable for proteomics (Zhang et al. 2013).
For candidate misannotated pseudogenes, we further required (1) the minimal predicted ORF is more than 50 amino acids; and (2) the differentiating amino acids should not be a polymorphic nonsynonymous site in the paralogous protein, based on the 1000GP data.
We then performed manual curation and took the intersection of pFind and MaxQuant as the final output.
Coexpression network analysis
We constructed coexpression modules based on the HPA transcriptome data using WGCNA software (v1.51) (Langfelder and Horvath 2008). We required genes to be present in at least one tissue, with a mean FPKM across replicates higher than 0.5, which represented robust transcription (Hart et al. 2013). We ran WGCNA according to the method of Parikshak et al. (2013), with the following modifications: (1) We specified the soft threshold as 12 rather than 26 because the former fits the data well (Supplemental Fig. S23A); and (2) to identify more modules while ensuring a decent module size, we set the deep split parameter and minimum module size in the cutreeHybrid function to four and 150, respectively. For modules with an excess of PSGs, we performed GO term enrichment analysis with the KOBAS server (Xie et al. 2011). WGCNA for GTEx data was performed in a similar way, except that the power was chosen as 20 (Supplemental Fig. S23B).
Within each module, we measured centrality of one gene by summing its correlation coefficients to other genes, which is further normalized by dividing the raw value by the maximum degree of this module (Chou et al. 2014).
Data access
The web-accessible database together with the batch download is available at GenTree (http://gentree.ioz.ac.cn/).
Acknowledgments
We thank Sunjin Moon, Joshua Akey, Lisa Stubbs, Yang Shen, and Zhang laboratory members for helpful discussions. We appreciate the insightful comments of three anonymous reviewers. This research was supported by grants from the Strategic Priority Research Program of the Chinese Academy of Sciences (XDB13000000), the National Key Basic Research Program of China (2015CB943001, 2013CB531202), the National Natural Science Foundation of China (91731302, 31771410, 31200941, 31500668), and the Fundamental Research Funds for the Central Universities (106112016CDJXY290002). Computing was jointly supported by the HPC Platform of BIG, the HPC Platform of the Scientific Information Centre of IOZ, and the NCMIS CAS.
Author contributions: Y.E.Z. conceived and designed the study. Y.S. and C.C. performed the computational analyses except domain-related analyses performed by D.Y. S.J. and G.G. contributed to GTEx data analyses. Z.G., X.C., and Y.F. contributed to the proteomic analyses. S.Z. and H.C. contributed to population genomic analyses. Y.S., H.S., and Z.Z. developed the website. Y.S., C.C., Y.E.Z., and B.Z.H. analyzed the data. Y.E.Z., B.Z.H, Y.S., C.C., and M.L. wrote the paper.
Notes
[1] Supplementary material [Supplemental material is available for this article.]
[2] Article published online before print. Article, supplemental material, and publication date are at http://www.genome.org/cgi/doi/10.1101/gr.238733.118.
[3] Freely available online through the Genome Research Open Access option.
References
- ↵The 1000 Genomes Project Consortium. 2015. A global reference for human genetic variation. Nature 526: 68. 10.1038/nature15393
- ↵Abrusán G, Giordano J, Warburton PE. 2008. Analysis of transposon interruptions suggests selection for L1 elements on the X chromosome. PLoS Genet 4: e1000172. 10.1371/journal.pgen.1000172
- ↵Adhya D, Swarup V, Nowosaid P, Shum C, Jozwik K, McAlonan G, Mendez MA, Horder J, Murphy D, Geschwind DH, 2018. Shared gene co-expression networks in autism from induced pluripotent stem cell (iPSC) neurons. bioRxiv 10.1101/349415
- ↵Albà MM, Castresana J. 2007. On homology searches by protein Blast and the characterization of the age of genes. BMC Evol Biol 7: 53. 10.1186/1471-2148-7-53
- ↵Ashburner M, Ball CA, Blake JA, Botstein D, Butler H, Cherry JM, Davis AP, Dolinski K, Dwight SS, Eppig JT, 2000. Gene Ontology: tool for the unification of biology. The Gene Ontology Consortium. Nat Genet 25: 25–29. 10.1038/75556
- ↵Bailey JA, Eichler EE. 2006. Primate segmental duplications: crucibles of evolution, diversity and disease. Nat Rev Genet 7: 552–564. 10.1038/nrg1895
- ↵Baird A, Costantini T, Coimbra R, Eliceiri BP. 2016. Injury, inflammation and the emergence of human-specific genes. Wound Repair Regen 24: 602–606. 10.1111/wrr.12422
- ↵Barbazuk WB, Korf I, Kadavi C, Heyen J, Tate S, Wun E, Bedell JA, McPherson JD, Johnson SL. 2000. The syntenic relationship of the zebrafish and human genomes. Genome Res 10: 1351–1358. 10.1101/gr.144700
- ↵Betrán E. 2015. The “life histories” of genes. J Mol Evol 80: 186–188. 10.1007/s00239-015-9668-x
- ↵Betrán E, Thornton K, Long M. 2002. Retroposed new genes out of the X in Drosophila. Genome Res 12: 1854–1859. 10.1101/gr.6049
- ↵Branca RM, Orre LM, Johansson HJ, Granholm V, Huss M, Pérez-Bercoff Å, Forshed J, Käll L, Lehtiö J. 2014. HiRIEF LC-MS enables deep proteome coverage and unbiased proteogenomics. Nat Methods 11: 59–62. 10.1038/nmeth.2732
- ↵Bray NL, Pimentel H, Melsted P, Pachter L. 2016. Near-optimal probabilistic RNA-seq quantification. Nat Biotechnol 34: 525. 10.1038/nbt.3519
- ↵Bruford EA, Lane L, Harrow J. 2015. Devising a consensus framework for validation of novel human coding loci. J Proteome Res 14: 4945–4948. 10.1021/acs.jproteome.5b00688
- ↵Burki F, Kaessmann H. 2004. Birth and adaptive evolution of a hominoid gene that supports high neurotransmitter flux. Nat Genet 36: 1061–1063. 10.1038/ng1431
- ↵Capra JA, Williams AG, Pollard KS. 2012. ProteinHistorian: tools for the comparative analysis of eukaryote protein origin. PLoS Comput Biol 8: e1002567. 10.1371/journal.pcbi.1002567
- ↵Capra JA, Stolzer M, Durand D, Pollard KS. 2013. How old is my gene? Trends Genet 29: 659–668. 10.1016/j.tig.2013.07.001
- ↵Casillas S, Mulet R, Villegas-Mirón P, Hervas S, Sanz E, Velasco D, Bertranpetit J, Laayouni H, Barbadilla A. 2017. PopHuman: the human population genomics browser. Nucleic Acids Res 46: D1003–D1010. 10.1093/nar/gkx943
- ↵Chen JY, Shen QS, Zhou WZ, Peng J, He BZ, Li Y, Liu CJ, Luan X, Ding W, Li S, 2015. Emergence, retention and selection: a trilogy of origination for functional de novo proteins from ancestral lncRNAs in primates. PLoS Genet 11: e1005391. 10.1371/journal.pgen.1005391
- ↵Cheng X, Xu C, DeGiorgio M. 2017. Fast and robust detection of ancestral selective sweeps. Mol Ecol 26: 6871–6891. 10.1111/mec.14416
- ↵Chou WC, Cheng AL, Brotto M, Chuang CY. 2014. Visual gene-network analysis reveals the cancer gene co-expression in human endometrial cancer. BMC Genomics 15: 300. 10.1186/1471-2164-15-300
- ↵Costantini TW, Dang X, Coimbra R, Eliceiri BP, Baird A. 2015. CHRFAM7A, a human-specific and partially duplicated α7-nicotinic acetylcholine receptor gene with the potential to specify a human-specific inflammatory response to injury. J Leukoc Biol 97: 247–257. 10.1189/jlb.4RU0814-381R
- ↵Cox J, Mann M. 2008. MaxQuant enables high peptide identification rates, individualized p.p.b.-range mass accuracies and proteome-wide protein quantification. Nat Biotechnol 26: 1367–1372. 10.1038/nbt.1511
- ↵Crosby MA, Goodman JL, Strelets VB, Zhang P, Gelbart WM. 2007. FlyBase: genomes by the dozen. Nucleic Acids Res 35: D486–D491. 10.1093/nar/gkl827
- ↵Demuth JP, Hahn MW. 2009. The life and death of gene families. Bioessays 31: 29–39. 10.1002/bies.080085
- ↵Demuth JP, De Bie T, Stajich JE, Cristianini N, Hahn MW. 2006. The evolution of mammalian gene families. PLoS One 1: e85. 10.1371/journal.pone.0000085
- ↵Dennis MY, Harshman L, Nelson BJ, Penn O, Cantsilieris S, Huddleston J, Antonacci F, Penewit K, Denman L, Raja A, 2017. The evolution and population diversity of human-specific segmental duplications. Nat Ecol Evol 1: 0069. 10.1038/s41559-016-0069
- ↵Dobin A, Davis CA, Schlesinger F, Drenkow J, Zaleski C, Jha S, Batut P, Chaisson M, Gingeras TR. 2013. STAR: ultrafast universal RNA-seq aligner. Bioinformatics 29: 15–21. 10.1093/bioinformatics/bts635
- ↵Domazet-Lošo T, Tautz D. 2010. Phylostratigraphic tracking of cancer genes suggests a link to the emergence of multicellularity in metazoa. BMC Biol 8: 66. 10.1186/1741-7007-8-66
- ↵Domazet-Lošo T, Brajković J, Tautz D. 2007. A phylostratigraphy approach to uncover the genomic history of major adaptations in metazoan lineages. Trends Genet 23: 533–539. 10.1016/j.tig.2007.08.014
- ↵Ezkurdia I, Juan D, Rodriguez JM, Frankish A, Diekhans M, Harrow J, Vazquez J, Valencia A, Tress ML. 2014. Multiple evidence strands suggest that there may be as few as 19,000 human protein-coding genes. Hum Mol Genet 23: 5866–5878. 10.1093/hmg/ddu309
- ↵Finn RD, Coggill P, Eberhardt RY, Eddy SR, Mistry J, Mitchell AL, Potter SC, Punta M, Qureshi M, Sangrador-Vegas A, 2015. The Pfam protein families database: towards a more sustainable future. Nucleic Acids Res 44: D279–D285. 10.1093/nar/gkv1344
- ↵Flicek P, Ahmed I, Amode MR, Barrell D, Beal K, Brent S, Carvalho-Silva D, Clapham P, Coates G, Fairley S, 2012. Ensembl 2013. Nucleic Acids Res 41: D48–D55. 10.1093/nar/gks1236
- ↵Florio M, Heide M, Pinson A, Brandl H, Albert M, Winkler S, Wimberger P, Huttner WB, Hiller M. 2018. Evolution and cell-type specificity of human-specific genes preferentially expressed in progenitors of fetal neocortex. eLife 7: e32332. 10.7554/eLife.32332
- ↵Fu Y, Qian X. 2014. Transferred subgroup false discovery rate for rare post-translational modifications detected by mass spectrometry. Mol Cell Proteomics 13: 1359–1368. 10.1074/mcp.O113.030189
- ↵Giandomenico SL, Lancaster MA. 2017. Probing human brain evolution and development in organoids. Curr Opin Cell Biol 44: 36–43. 10.1016/j.ceb.2017.01.001
- ↵The GTEx Consortium. 2015. The Genotype-Tissue Expression (GTEx) pilot analysis: multitissue gene regulation in humans. Science 348: 648–660. 10.1126/science.1262110
- ↵Hangauer MJ, Carpenter S, McManus MT. 2014. Discovering the complexity of the metazoan transcriptome. Genome Biol 15: 112. 10.1186/gb4172
- ↵Hart T, Komori HK, LaMere S, Podshivalova K, Salomon DR. 2013. Finding the active genes in deep RNA-seq gene expression studies. BMC Genomics 14: 778. 10.1186/1471-2164-14-778
- ↵Hsu PD, Lander ES, Zhang F. 2014. Development and applications of CRISPR-Cas9 for genome engineering. Cell 157: 1262–1278. 10.1016/j.cell.2014.05.010
- ↵Hubbard TJP, Aken BL, Beal K, Ballester B, Caccamo M, Chen Y, Clarke L, Coates G, Cunningham F, Cutts T, 2007. Ensembl 2007. Nucleic Acids Res 35: D610–D617. 10.1093/nar/gkl996
- ↵Hunter S, Apweiler R, Attwood TK, Bairoch A, Bateman A, Binns D, Bork P, Das U, Daugherty L, Duquenne L, 2009. InterPro: the integrative protein signature database. Nucleic Acids Res 37: D211–D215. 10.1093/nar/gkn785
- ↵Jacobs FMJ, Greenberg D, Nguyen N, Haeussler M, Ewing AD, Katzman S, Paten B, Salama SR, Haussler D. 2014. An evolutionary arms race between KRAB zinc-finger genes ZNF91/93 and SVA/L1 retrotransposons. Nature 516: 242–245. 10.1038/nature13760
- ↵Kaessmann H. 2010. Origins, evolution, and phenotypic impact of new genes. Genome Res 20: 1313–1326. 10.1101/gr.101386.109
- ↵Kemkemer C, Kohn M, Cooper DN, Froenicke L, Högel J, Hameister H, Kehrer-Sawatzki H. 2009. Gene synteny comparisons between different vertebrates provide new insights into breakage and fusion events during mammalian karyotype evolution. BMC Evol Biol 9: 84. 10.1186/1471-2148-9-84
- ↵Kent WJ, Baertsch R, Hinrichs A, Miller W, Haussler D. 2003. Evolution's cauldron: duplication, deletion, and rearrangement in the mouse and human genomes. Proc Natl Acad Sci 100: 11484–11489. 10.1073/pnas.1932072100
- ↵Kim M-S, Pinto SM, Getnet D, Nirujogi RS, Manda SS, Chaerkady R, Madugundu AK, Kelkar DS, Isserlin R, Jain S, 2014. A draft map of the human proteome. Nature 509: 575–581. 10.1038/nature13302
- ↵Knowles DG, McLysaght A. 2009. Recent de novo origin of human protein-coding genes. Genome Res 19: 1752–1759. 10.1101/gr.095026.109
- ↵Knox K, Baker JC. 2008. Genomic evolution of the placenta using co-option and duplication and divergence. Genome Res 18: 695–705. 10.1101/gr.071407.107
- ↵Kryazhimskiy S, Plotkin JB. 2008. The population genetics of dN/dS. PLoS Genet 4: e1000304. 10.1371/journal.pgen.1000304
- ↵Langfelder P, Horvath S. 2008. WGCNA: an R package for weighted correlation network analysis. BMC Bioinformatics 9: 559. 10.1186/1471-2105-9-559
- ↵Li B, Dewey CN. 2011. RSEM: accurate transcript quantification from RNA-seq data with or without a reference genome. BMC Bioinformatics 12: 323. 10.1186/1471-2105-12-323
- ↵Li D, Fu Y, Sun R, Ling CX, Wei Y, Zhou H, Zeng R, Yang Q, He S, Gao W. 2005. pFind: a novel database-searching software system for automated peptide and protein identification via tandem mass spectrometry. Bioinformatics 21: 3049–3050. 10.1093/bioinformatics/bti439
- ↵Long M, Betrán E, Thornton K, Wang W. 2003. The origin of new genes: glimpses from the young and old. Nat Rev Genet 4: 865–875. 10.1038/nrg1204
- ↵Marques AC, Dupanloup I, Vinckenbosch N, Reymond A, Kaessmann H. 2005. Emergence of young human genes after a burst of retroposition in primates. PLoS Biol 3: e357. 10.1371/journal.pbio.0030357
- ↵McLysaght A, Hurst LD. 2016. Open questions in the study of de novo genes: what, how and why. Nat Rev Genet 17: 567–578. 10.1038/nrg.2016.78
- ↵Michel AM, Ahern AM, Donohue CA, Baranov PV. 2015. GWIPS-viz as a tool for exploring ribosome profiling evidence supporting the synthesis of alternative proteoforms. Proteomics 15: 2410–2416. 10.1002/pmic.201400603
- ↵Mosca S. 2013. “Discovery and characterization of rare genomic copy number variants in children with developmental coordination disorder.” Master's thesis, University of Calgary, Alberta, Canada.
- ↵Moyers BA, Zhang J. 2016. Evaluating phylostratigraphic evidence for widespread de novo gene birth in genome evolution. Mol Biol Evol 33: 1245–1256. 10.1093/molbev/msw008
- ↵Mudge JM, Harrow J. 2016. The state of play in higher eukaryote gene annotation. Nat Rev Genet 17: 758–772. 10.1038/nrg.2016.119
- ↵Nowakowski TJ, Bhaduri A, Pollen AA, Alvarado B, Mostajo-Radji MA, Di Lullo E, Haeussler M, Sandoval-Espinosa C, Liu SJ, Velmeshev D, et al. 2017. Spatiotemporal gene expression trajectories reveal developmental hierarchies of the human cortex. Science 358: 1318–1323. 10.1126/science.aap8809
- ↵Nowick K, Hamilton AT, Zhang H, Stubbs L. 2010. Rapid sequence and expression divergence suggest selection for novel function in primate-specific KRAB-ZNF genes. Mol Biol Evol 27: 2606–2617. 10.1093/molbev/msq157
- ↵Nowick K, Fields C, Gernat T, Caetano-Anolles D, Kholina N, Stubbs L. 2011. Gain, loss and divergence in primate zinc-finger genes: a rich resource for evolution of gene regulatory differences between species. PLoS One 6: e21553. 10.1371/journal.pone.0021553
- ↵Nowick K, Carneiro M, Faria R. 2013. A prominent role of KRAB-ZNF transcription factors in mammalian speciation? Trends Genet 29: 130–139. 10.1016/j.tig.2012.11.007
- ↵Pääbo S. 2014. The human condition: a molecular approach. Cell 157: 216–226. 10.1016/j.cell.2013.12.036
- ↵Parikshak NN, Luo R, Zhang A, Won H, Lowe JK, Chandran V, Horvath S, Geschwind DH. 2013. Integrative functional genomic analyses implicate specific molecular pathways and circuits in autism. Cell 155: 1008–1021. 10.1016/j.cell.2013.10.031
- ↵Perry GH, Verrelli BC, Stone AC. 2005. Comparative analyses reveal a complex history of molecular evolution for human MYH16. Mol Biol Evol 22: 379–382. 10.1093/molbev/msi004
- ↵R Core Team. 2007. R: a language and environment for statistical computing. R Foundation for Statistical Computing, Vienna. http://www.R-project.org/.
- ↵Rhead B, Karolchik D, Kuhn RM, Hinrichs AS, Zweig AS, Fujita PA, Diekhans M, Smith KE, Rosenbloom KR, Raney BJ, 2010. The UCSC Genome Browser database: update 2010. Nucleic Acids Res 38: D613–D619. 10.1093/nar/gkp939
- ↵Rodriguez JM, Carro A, Valencia A, Tress ML. 2015. APPRIS WebServer and WebServices. Nucleic Acids Res 43: W455–W459. 10.1093/nar/gkv512
- ↵Ruiz-Orera J, Hernandez-Rodriguez J, Chiva C, Sabidó E, Kondova I, Bontrop R, Marqués-Bonet T, Albà MM. 2015. Origins of de novo genes in human and chimpanzee. PLoS Genet 11: e1005721. 10.1371/journal.pgen.1005721
- ↵Sabeti PC, Varilly P, Fry B, Lohmueller J, Hostetter E, Cotsapas C, Xie X, Byrne EH, McCarroll SA, Gaudet R, 2007. Genome-wide detection and characterization of positive selection in human populations. Nature 449: 913–918. 10.1038/nature06250
- ↵Saghatelian A, Couso JP. 2015. Discovery and characterization of smORF-encoded bioactive polypeptides. Nat Chem Biol 11: 909–916. 10.1038/nchembio.1964
- ↵Sakai H, Mizuno H, Kawahara Y, Wakimoto H, Ikawa H, Kawahigashi H, Kanamori H, Matsumoto T, Itoh T, Gaut BS. 2011. Retrogenes in rice (Oryza sativa L. ssp. japonica) exhibit correlated expression with their source genes. Genome Biol Evol 3: 1357–1368. 10.1093/gbe/evr111
- ↵Schlötterer C. 2015. Genes from scratch—the evolutionary fate of de novo genes. Trends Genet 31: 215–219. 10.1016/j.tig.2015.02.007
- ↵Smit AFA, Hubley R, Green P. 2017. RepeatMasker Open-3.0 (1996–2010). http://www.repeatmasker.org.
- ↵Spanaki C, Zaganas I, Kleopa KA, Plaitakis A. 2010. Human GLUD2 glutamate dehydrogenase is expressed in neural and testicular supporting cells. J Biol Chem 285: 16748–16756. 10.1074/jbc.M109.092999
- ↵Stedman HH, Kozyak BW, Nelson A, Thesier DM, Su LT, Low DW, Bridges CR, Shrager JB, Minugh-Purvis N, Mitchell MA. 2004. Myosin gene mutation correlates with anatomical changes in the human lineage. Nature 428: 415–418. 10.1038/nature02358
- ↵Strand AD, Aragaki AK, Baquet ZC, Hodges A, Cunningham P, Holmans P, Jones KR, Jones L, Kooperberg C, Olson JM. 2007. Conservation of regional gene expression in mouse and human brain. PLoS Genet 3: e59. 10.1371/journal.pgen.0030059
- ↵Tarazona-Santos E, Castilho L, Amaral DR, Costa DC, Furlani NG, Zuccherato LW, Machado M, Reid ME, Zalis MG, Rossit AR, 2011. Population genetics of GYPB and association study between GYPB*S/s polymorphism and susceptibility to P. falciparum infection in the Brazilian Amazon. PLoS One 6: e16123. 10.1371/journal.pone.0016123
- ↵Tay SK, Blythe J, Lipovich L. 2009. Global discovery of primate-specific genes in the human genome. Proc Natl Acad Sci 106: 12019–12024. 10.1073/pnas.0904569106
- ↵Than NG, Romero R, Goodman M, Weckle A, Xing J, Dong Z, Xu Y, Tarquini F, Szilagyi A, Gal P, 2009. A primate subfamily of galectins expressed at the maternal–fetal interface that promote immune cell death. Proc Natl Acad Sci 106: 9731–9736. 10.1073/pnas.0903568106
- ↵Toll-Riera M, Bosch N, Bellora N, Castelo R, Armengol L, Estivill X, Albà MM. 2009. Origin of primate orphan genes: a comparative genomics approach. Mol Biol Evol 26: 603–612. 10.1093/molbev/msn281
- ↵Uhlen M, Oksvold P, Fagerberg L, Lundberg E, Jonasson K, Forsberg M, Zwahlen M, Kampf C, Wester K, Hober S, 2010. Towards a knowledge-based human protein atlas. Nat Biotechnol 28: 1248–1250. 10.1038/nbt1210-1248
- ↵The UniProt Consortium. 2015. UniProt: a hub for protein information. Nucleic Acids Res 43: D204–D212. 10.1093/nar/gku989
- ↵Vilella AJ, Severin J, Ureta-Vidal A, Heng L, Durbin R, Birney E. 2009. EnsemblCompara GeneTrees: complete, duplication-aware phylogenetic trees in vertebrates. Genome Res 19: 327–335. 10.1101/gr.073585.107
- ↵Vinckenbosch N, Dupanloup I, Kaessmann H. 2006. Evolutionary fate of retroposed gene copies in the human genome. Proc Natl Acad Sci 103: 3220–3225. 10.1073/pnas.0511307103
- ↵Voight BF, Kudaravalli S, Wen XQ, Pritchard JK. 2006. A map of recent positive selection in the human genome. PLoS Biol 4: 446–458. 10.1371/journal.pbio.0040446
- ↵Wang W, Yu H, Long M. 2004. Duplication-degeneration as a mechanism of gene fission and the origin of new genes in Drosophila species. Nat Genet 36: 523–527. 10.1038/ng1338
- ↵Wang LH, Li DQ, Fu Y, Wang HP, Zhang JF, Yuan ZF, Sun RX, Zeng R, He SM, Gao W. 2007. pFind 2.0: a software package for peptide and protein identification via tandem mass spectrometry. Rapid Commun Mass Spectrom 21: 2985–2991. 10.1002/rcm.3173
- ↵Wang W, Cai J, Wu Y, Hu L, Chen Z, Hu J, Chen Z, Li W, Guo M, Huang Z. 2013. Novel activity of KRAB domain that functions to reinforce nuclear localization of KRAB-containing zinc finger proteins by interacting with KAP1. Cell Mol Life Sci 70: 3947–3958. 10.1007/s00018-013-1359-4
- ↵Wang M, Liu X, Chang G, Chen Y, An G, Yan L, Gao S, Xu Y, Cui Y, Dong J, 2018. Single-cell RNA sequencing analysis reveals sequential cell fate transition during human spermatogenesis. Cell Stem Cell 23: 599–614.e4. 10.1016/j.stem.2018.08.007
- ↵Wright JC, Mudge J, Weisser H, Barzine MP, Gonzalez JM, Brazma A, Choudhary JS, Harrow J. 2016. Improving GENCODE reference gene annotation using a high-stringency proteogenomics workflow. Nat Commun 7: 11778. 10.1038/ncomms11778
- ↵Xie C, Mao X, Huang J, Ding Y, Wu J, Dong S, Kong L, Gao G, Li CY, Wei L. 2011. KOBAS 2.0: a web server for annotation and identification of enriched pathways and diseases. Nucleic Acids Res 39: W316–W322. 10.1093/nar/gkr483
- ↵Xie C, Zhang YE, Chen JY, Liu CJ, Zhou WZ, Li Y, Zhang M, Zhang R, Wei L, Li CY. 2012. Hominoid-specific de novo protein-coding genes originating from long non-coding RNAs. PLoS Genet 8: e1002942. 10.1371/journal.pgen.1002942
- ↵Xu J, Zhang J. 2016. Are human translated pseudogenes functional? Mol Biol Evol 33: 755–760. 10.1093/molbev/msv268
- ↵Yang Z. 2007. PAML 4: phylogenetic analysis by maximum likelihood. Mol Biol Evol 24: 1586–1591. 10.1093/molbev/msm088
- ↵Yang H, He BZ, Ma H, Tsaur SC, Ma C, Wu Y, Ting CT, Zhang YE. 2015. Expression profile and gene age jointly shaped the genome-wide distribution of premature termination codons in a Drosophila melanogaster population. Mol Biol Evol 32: 216–228. 10.1093/molbev/msu299
- ↵Zhang YE, Long M. 2014. New genes contribute to genetic and phenotypic novelties in human evolution. Curr Opin Genet Dev 29C: 90–96. 10.1016/j.gde.2014.08.013
- ↵Zhang J, Yang JR. 2015. Determinants of the rate of protein sequence evolution. Nat Rev Genet 16: 409–420. 10.1038/nrg3950
- ↵Zhang YE, Vibranovski MD, Krinsky BH, Long M. 2010a. Age-dependent chromosomal distribution of male-biased genes in Drosophila. Genome Res 20: 1526–1533. 10.1101/gr.107334.110
- ↵Zhang YE, Vibranovski MD, Landback P, Marais GAB, Long M. 2010b. Chromosomal redistribution of male-biased genes in mammalian evolution with two bursts of gene gain on the X chromosome. PLoS Biol 8: e1000494. 10.1371/journal.pbio.1000494
- ↵Zhang YE, Landback P, Vibranovski MD, Long M. 2011. Accelerated recruitment of new brain development genes into the human genome. PLoS Biol 9: e1001179. 10.1371/journal.pbio.1001179
- ↵Zhang YE, Landback P, Vibranovski M, Long M. 2012. New genes expressed in human brains: implications for annotating evolving genomes. Bioessays 34: 982–991. 10.1002/bies.201200008
- ↵Zhang Y, Fonslow BR, Shan B, Baek MC, Yates JRIII. 2013. Protein analysis by shotgun/bottom-up proteomics. Chem Rev 113: 2343–2394. 10.1021/cr3003533
- ↵Zhang K, Fu Y, Zeng WF, He K, Chi H, Liu C, Li YC, Gao Y, Xu P, He SM. 2015. A note on the false discovery rate of novel peptides in proteogenomics. Bioinformatics 31: 3249–3253. 10.1093/bioinformatics/btv340
- ↵Zhao L, Saelao P, Jones CD, Begun DJ. 2014. Origin and spread of de novo genes in Drosophila melanogaster populations. Science 343: 769–772. 10.1126/science.1248286
- ↵Zhong Z, Yang L, Zhang YE, Xue Y, He S. 2015. Correlated expression of retrocopies and parental genes in zebrafish. Mol Genet Genomics 291: 723–737. 10.1007/s00438-015-1140-5.
- ↵Zhou Q, Wang W. 2008. On the origin and evolution of new genes—a genomic and experimental perspective. J Genet Genomics 35: 639–648. 10.1016/S1673-8527(08)60085-5