
Abstract
Organogenesis involves dynamic regulation of gene transcription and complex multipathway interactions. Despite our knowledge of key factors regulating various steps of heart morphogenesis, considerable challenges in understanding its mechanism still exist because little is known about their downstream targets and interactive regulatory network. To better understand transcriptional regulatory mechanism driving heart development and the consequences of its disruption in vivo, we performed time-series analyses of the transcriptome and genome-wide chromatin accessibility in isolated cardiomyocytes (CMs) from wild-type zebrafish embryos at developmental stages corresponding to heart tube morphogenesis, looping, and maturation. We identified genetic regulatory modules driving crucial events of heart development that contained key cardiac TFs and are associated with open chromatin regions enriched for DNA sequence motifs belonging to the family of the corresponding TFs. Loss of function of cardiac TFs Gata5, Tbx5a, and Hand2 affected the cardiac regulatory networks and caused global changes in chromatin accessibility profile, indicating their role in heart development. Among regions with differential chromatin accessibility in mutants were highly conserved noncoding elements that represent putative enhancers driving heart development. The most prominent gene expression changes, which correlated with chromatin accessibility modifications within their proximal promoter regions, occurred between heart tube morphogenesis and looping, and were associated with metabolic shift and hematopoietic/cardiac fate switch during CM maturation. Our results revealed the dynamic regulatory landscape throughout heart development and identified interactive molecular networks driving key events of heart morphogenesis.
The myocardium makes up most of the heart tissues and is mainly responsible for its function. Upon completion of gastrulation, heart muscle cells or cardiomyocytes (CMs) are specified from a pool of mesodermal progenitors at the anterior portion of the embryonic lateral plate mesoderm (Stainier et al. 1993; Stainier and Fishman 1994; Kelly et al. 2014). These progenitors migrate to the midline and form the primitive heart tube (Stainier et al. 1993), which subsequently expands through cell division and addition of more cells from the progenitor pool (Knight and Yelon 2016). Looping of the heart tube gives rise to the atria and ventricles. Although the vertebrate heart can have between two and four chambers, the stepwise morphogenesis of progenitors specification, migration, tube formation, and looping, are highly conserved between species (Jensen et al. 2013).
CMs are specified early during embryogenesis and undergo proliferation, migration, and differentiation, which collectively give rise to a fully formed and functioning heart. Crucial to regulating each step of heart morphogenesis are cardiac transcription factors (TFs) NKX2-5, GATA5, TBX5, and HAND2 (Nemer 2008). These TFs are known to play a role in establishing CM identity, regulating the formation and looping of the heart tube and specification of atrial and ventricular CMs. Members of the GATA family of TFs (GATA4/5/6) are responsible for the earliest step of cardiac progenitor specification (Reiter et al. 1999; Singh et al. 2010; Lou et al. 2011; Turbendian et al. 2013). They activate the expression of Nkx2-5 (Lien et al. 1999), which is responsible for initiating the expression of many cardiac genes (Targoff et al. 2008). Hand2, another TF expressed in CM progenitors, is responsible for proliferation of ventricular progenitors (Yelon et al. 2000) and regulating the expression of Tbx5, which is necessary for atrial specification (Liberatore et al. 2000; Bruneau et al. 2001).
Despite established knowledge, little is known about the molecular mechanism and downstream targets of cardiac TFs. Transcription is modulated by cis-regulatory elements in noncoding regions of the genome, which serve as binding sites for TFs (Shlyueva et al. 2014). Although these regulatory elements equally contribute to the molecular mechanism controlling development, there is still a lack of systematic resources and understanding of their roles in heart development. Moreover, cardiac TFs have been shown to interact with chromatin-modifying factors, and the loss of function of several histone-modifying enzymes has been found to affect various aspects of cardiac development (Miller et al. 2008; Nimura et al. 2009; Takeuchi et al. 2011). Therefore, the chromatin landscape is another factor that needs to be considered when studying heart development.
The zebrafish is an ideal model organism to study heart development because it allows for accessing developing embryos immediately after fertilization, and it can survive without a functioning heart up to late developmental stages (Stainier 2001). To elucidate the dynamics of the transcriptional regulatory landscape during heart development, we isolated CMs directly from the developing wild-type zebrafish heart at three key stages of morphogenesis: linear heart tube formation (24 h post-fertilization [hpf]), chamber formation and differentiation (48 hpf), and heart maturation (72 hpf). Similarly, we isolated CMs from cardiac TF mutants of gata5, tbx5a, and hand2 at 72 hpf. We combined transcriptome profiling (RNA-seq) with an assay for chromatin accessibility (ATAC-seq) (Buenrostro et al. 2013) to capture the dynamics of regulatory landscape throughout the progression of heart morphogenesis in vivo therefore unravelling the gene regulatory network driving key processes of heart development.
Results
CM transcriptome reveals strong dynamics at early stages of heart morphogenesis
Two of the earliest markers of cardiac lineage are nkx2.5 and myosin light chain 7 (myl7), which are expressed in cardiac precursor cells in the anterior lateral plate mesoderm (George et al. 2015) and in differentiated myocardial cells (Chen et al. 2008), respectively. To study gene regulatory networks underlying zebrafish heart development, we isolated CMs from zebrafish transgenic lines Tg(nxk2.5:GFP) (Witzel et al. 2012) and Tg(myl7:EGFP) (D'Amico et al. 2007) using fluorescence-activated cell sorting (FACS) (Fig. 1A). Cells were collected at 24, 48, and 72 hpf (Fig. 1B). Because of its earlier onset of CM-specific GFP expression, Tg(nxk2.5:GFP) was used to sort CM at 24 hpf, whereas Tg(myl7:EGFP) was used for subsequent stages (48 hpf and 72 hpf) (Houk and Yelon 2016). The average fraction of FACS-yielded GFP+ events obtained were between 1.37% and 2.56% of total singlet events (Supplemental Fig. 1A). To monitor the purity of FACS and establish the identity of the isolated cells, we measured mRNA levels of nkx2.5, myl7, and GFP in both GFP+ and GFP− cells. The expression of the CM markers and GFP were significantly enriched (P-value ≤ 0.05) in GFP+ as compared to GFP− fraction (Supplemental Fig. 1B). In contrast, mRNA levels of neurogenin1 (ngn1), a neuronal-specific gene, were higher in GFP− cells. In line with that, RNA-seq expression of nkx2.5, myl7, and myh6 was significantly enriched (adjusted P-value ≤ 0.05) in GFP+ as compared to GFP− cells, whereas expression of non-CM markers such as skeletal muscle (myog), pancreas (ins), pharyngeal arch (frem2a), retina (arr3b, otx5), skin (tp63, col16a1), neural system (neurog1, zic3, otx1), and eye (pou4f2) were higher in GFP− (Supplemental Fig. 2). Gene Ontology (GO) enrichment analysis of differentially expressed genes between GFP+ and GFP− across all three stages of heart development revealed the overrepresentation of CM-specific biological processes such as cell migration, cardiac development, and heart function (Fig. 1C; Supplemental Table 1). Among 50 genes with the highest average expression across all developmental stages, 35 have specific functions in CM according to the ZFIN database (https://zfin.org) and eight are associated with human cardiac diseases including cardiomyopathy (ttn.1, mybpc3, ttn.2, acta1b, actn2b), atrial septal defects (actc1a, myh6), and Laing distal myopathy (vmhc) (Fig. 1D) according to the Online Mendelian Inheritance in Man database (https://www.omim.org/).
CM transcriptome landscape during heart development. (A) Schematics of experimental design. (B) Light sheet fluorescence microscope (LSFM) images of GFP-labeled CMs of developing zebrafish heart: (p) posterior; (an) anterior; (v) ventral; (d) dorsal. The dotted line indicates exact area of the LSFM image. (C) Network of 20 top-score GO clusters enriched in genes commonly up-regulated in GFP+ across heart development. Size nodes refer to the number of genes contributing to the same GO and nodes that share the same cluster ID are close to each other, adjusted P-value ≤ 0.05. (D) Heatmap of top 50 highly expressed genes between 24 and 72 hpf based on normalized expression value (regularized log [rld]). (E) Graphical representation of PCA of CM RNA-seq data. (F) Heatmap and clustering of RNA-seq sample-to-sample Euclidean distances.
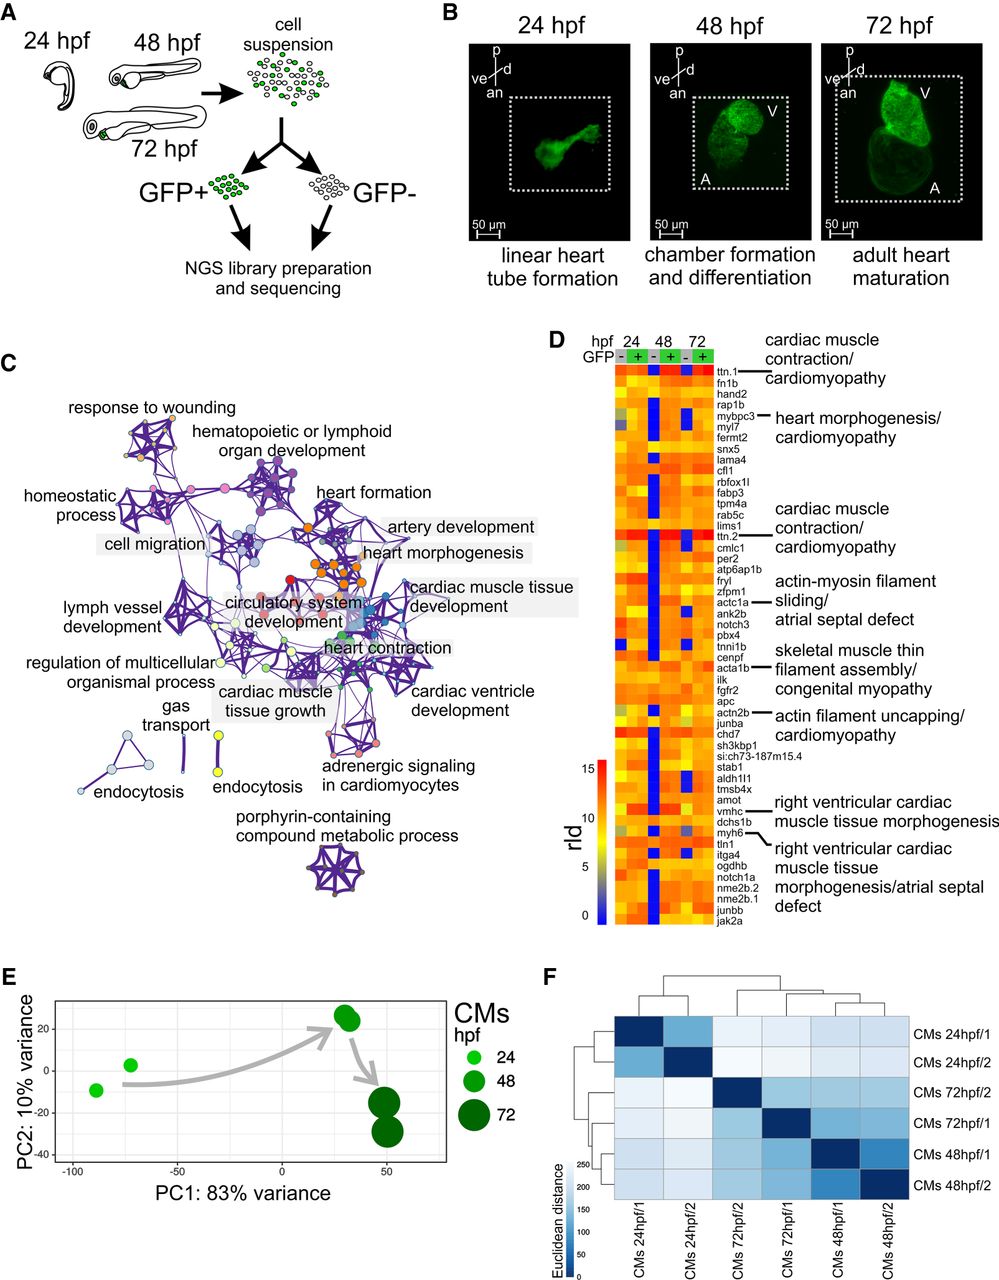
To determine the dynamics of CM transcriptome throughout development, we applied principal component analysis (PCA) and clustering based on Euclidean distance. Both analyses revealed strong dissimilarity in transcriptome profiles between CM at 24 hpf and later stages of heart development as compared to those between 48 and 72 hpf (Fig. 1E,F). This suggests that major gene expression profile changes of developing CMs occur between 24 and 48 hpf and correspond to heart tube formation and looping.
Taken together, transcriptome analyses identified CM-specific gene expression signatures among highly abundant transcripts and revealed the dynamic nature of gene expression profiles during heart morphogenesis.
Chromatin accessibility is correlated with CM gene expression levels during heart development
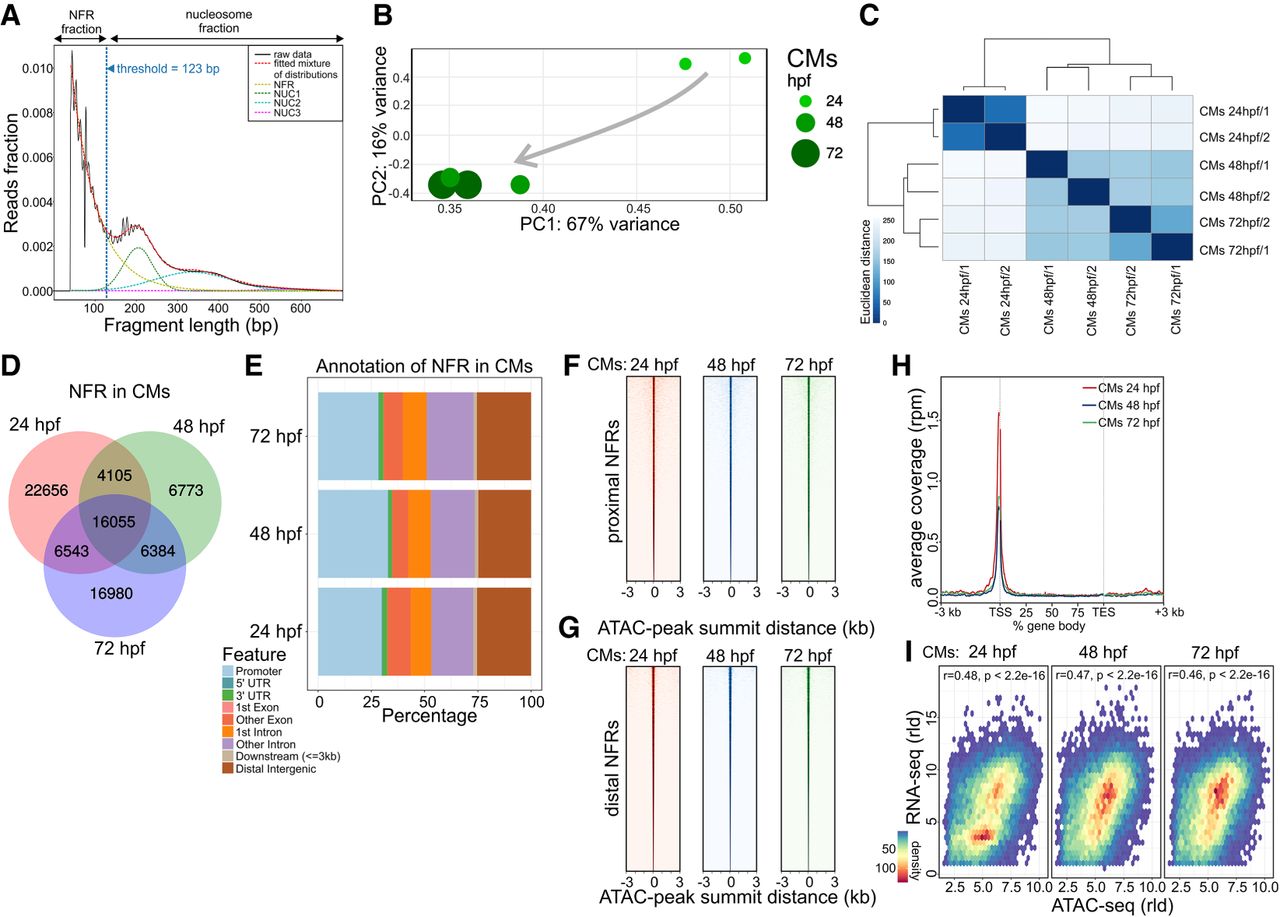
To characterize chromatin dynamics throughout heart development, we used an assay for transposase-accessible chromatin with high-throughput sequencing (ATAC-seq) and profiled chromatin accessibility at three developmental stages matching our transcriptome analyses (Buenrostro et al. 2013). To identify genome-wide nucleosome free regions (NFR), ATAC-seq read fragments were partitioned into four populations (Fig. 2A) based on exponential function for fragment distribution pattern at insert sizes below one nucleosome (123 bp) and Gaussian distributions for 1, 2, and 3 nucleosomes as previously described (Buenrostro et al. 2013). PCA analysis (Fig. 2B) and clustering based on Euclidian distances between ATAC-seq samples based on their NFR profiles (Fig. 2C) revealed that biological replicas clustered together, whereas the largest changes in chromatin accessibility were observed between 24 and 48 hpf stages, in agreement with observed transcriptome changes of CMs during heart development. We observed a large number of NFRs common to all stages (16,055), as well as those specific to a single developmental stage. The most stage-specific NFRs were found at 24 hpf (22,656) (Fig. 2D). The highest fraction of NFRs was localized within promoter (within ±3 kb of transcription start site, TSS; ∼30% of total NFRs), followed by intergenic (∼25%) and intronic (20%) regions (Fig. 2E; Supplemental Table 2). These ratios remained comparable across all three developmental stages. NFR consensus heatmaps within transcription start site (TSS) proximal promoter regions (±3 kb) (Fig. 2F) compared to distal promoter regions (more than ±3 kb of TSS) (Fig. 2G), as well as ATAC-seq read density over the gene bodies of 1000 genes most highly expressed in CMs at all three stages of heart development (Fig. 2H), revealed the enrichment of NFRs around TSS regions. We further observed chromatin accessibility reflected by the presence of NFR in gene promoter regions was significantly correlated with the expression levels of the corresponding genes to which the promoter belonged to (Spearman's rho 0.46–0.48) at each stage of heart development (Fig. 2I). Our observations revealed a strong link between chromatin accessibility of promoter regions and gene expression levels.
Cross-talk between transcriptome and chromatin accessibility profile across stages of cardiac development. (A) ATAC-seq read distribution and characterization of NFR fractions. (B) PCA of NFR chromatin accessibility during heart development. (C) Euclidian distances between chromatin accessibility within NFR. (D) Comparison of NFR presence and overlap across stages of heart development. (E) Genomic annotation of CM NFR consensus at different stages of heart development. (F) CM NFR consensus coverage heatmap of TSS proximal (±3 kb of TSS) regions centered on ATAC-seq peak summits. (G) CM NFR consensus coverage heatmap of TSS distal (more than ±3 kb of TSS) regions centered on ATAC-seq peak summits. (H) Metaplot of ATAC-seq read density over the gene bodies of the 1000 genes most highly expressed in CMs at each developmental stage. (TES) transcription end site. (I) Spearman's correlation of normalized log (rld) RNA-seq gene expression and ATAC-seq chromatin accessibility in corresponding NFR regions (±3 kb of TSS).
Coexpression network analysis identifies CM regulatory modules
To better understand the relationship and functionality of cardiac genes involved in heart morphogenesis, we identified gene regulatory networks in an unsupervised and unbiased manner using the weighted gene correlation network analysis (WGCNA) based on RNA-seq expression profiles (Langfelder and Horvath 2008). Hierarchical clustering of the similarity/dissimilarity matrix across the entire set of transcriptome samples distinguished 37 gene modules (Fig. 3A; Supplemental Table 3), five of which were enriched in functional terms related to cardiovascular system development and function (Fig. 3B; Supplemental Table 4): turquoise (4085 genes), brown (2156 genes), green (1166 genes), salmon (756 genes), and sienna3 (75 genes). We refer to these modules as “cardiac modules.” Functional terms enriched in these cardiac modules included “embryonic heart tube development” (brown, green, and sienna3), “cardioblast differentiation” (green), “heart valve development” (salmon), “heart process” and “heart formation” (turquoise). The relatively small sienna3 module was enriched in GO terms associated with multiple cardiac developmental processes including “heart tube development,” “cardioblast migration,” and “heart rudiment development.”
Cardiac coexpression regulatory networks. (A) Hierarchical clustering of gene expression similarity/dissimilarity matrix. (B) Cardiovascular-related GO enrichment in five cardiac modules. (C) Module gene connectivity plot of selected TFs. Twenty TFs with the highest normalized kDiff are shown. (D) Cardiac module eigengene expression during heart development.
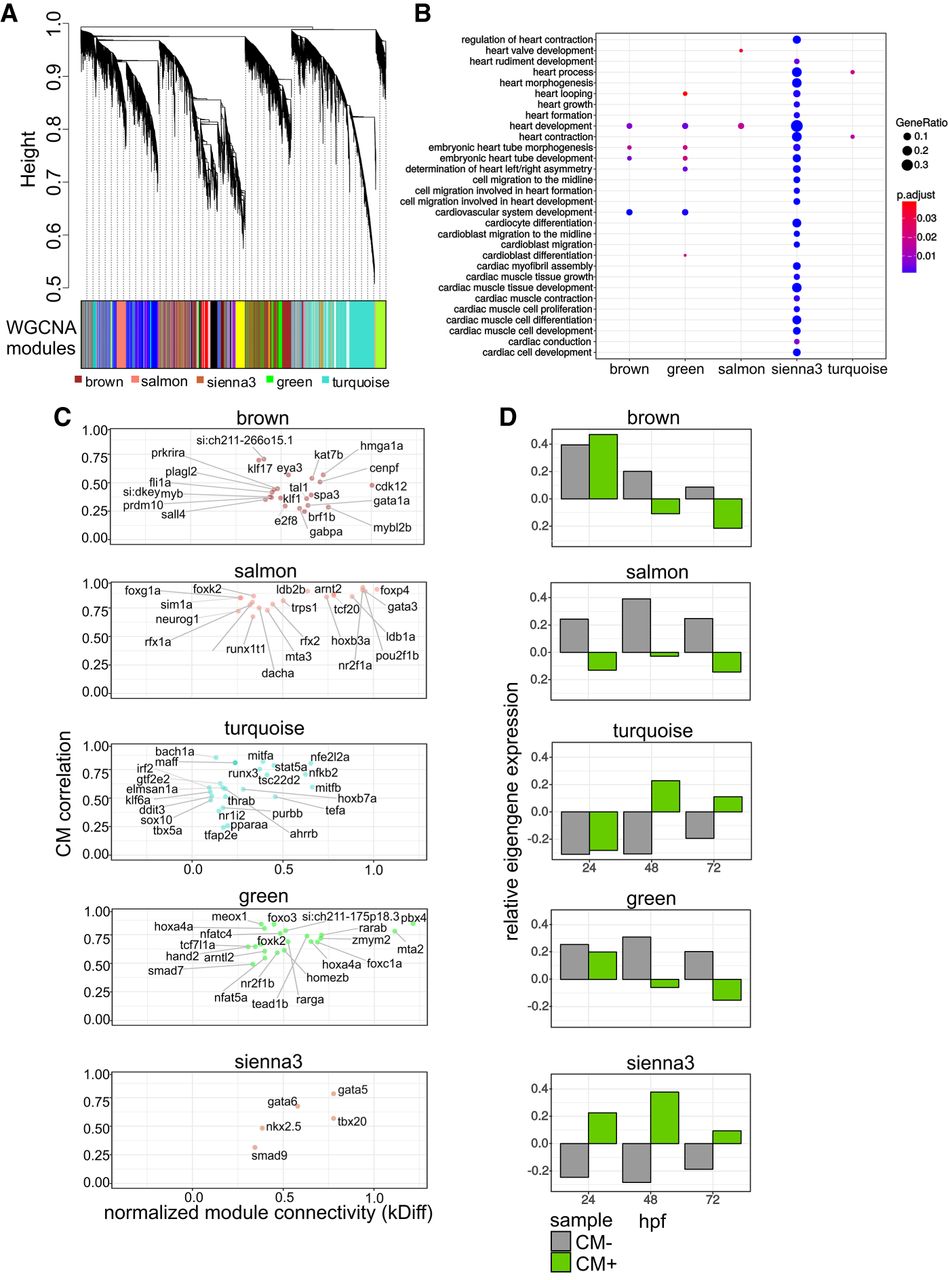
To reveal potential driver genes with regulatory roles in each cardiac module, we searched for TFs and calculated their connectivity to other genes within a given module (normalized kDiff), as well as how their expression is affected by CM phenotypic traits (CM correlation) (Fig. 3C). Most of the cardiac modules contained TFs previously implicated in heart development, such as gata1 (brown), tbx5a, sox10 (turquoise), hand2, smad7 (green), as well as gata5, nkx2.5, and tbx20 (sienna3) (Ahn et al. 2000; Montero et al. 2002; Holtzinger and Evans 2007; Targoff et al. 2008; Moskowitz et al. 2011). Each of the modules exhibited different expression profile dynamics (eigengene expression) across three developmental stages, in GFP+ and GFP− fractions, further called CM+ and CM−, respectively (Fig 3D). Two broad patterns of eigengene expression could be observed: modules with decreasing cardiac gene expression during heart development (brown and green) and modules in which expression increases between 24 and 48 hpf and then decreases between 48 and 72 hpf (salmon, sienna3, and turquoise). In addition, CM+ eigengene expression in the sienna3 module was consistently higher than in CM− samples at all stages of development, further suggesting the specificity of this module to CM.
The presence of key cardiac TFs in each module prompted us to identify specific functional patterns related to cardiovascular development. The sienna3 module, which contained cardiac TFs nkx2.5, gata5, gata6, and tbx20, also contained many other genes implicated in various aspects of heart morphogenesis, including CM migration and differentiation, and heart looping including popdc2, apobec2a, and tdgf1 (Xu et al. 1999; Etard et al. 2010; Wang et al. 2011; Kirchmaier et al. 2012; Sakabe et al. 2012). Additionally, the module also contained many genes involved in cell adhesion and structural constituents of the heart muscle, which were previously implicated in cardiomyopathy. These included actc1a, myl7, myh7ba, myh7bb, vmhc, and ttn.2 (Olson et al. 1998; Xu et al. 2002; Shih et al. 2015). In support of this network, Popdc2 and Gata6 were previously shown to be a direct transcriptional target of NKX2-5 in mouse embryonic heart (Molkentin et al. 2000; Dupays et al. 2015). Additional evidence supports the cardiac-specific transcriptional activation of nkx2.5 by Gata TFs (Lien et al. 1999).
Genes of the Wnt, Notch, TGFB, and FGF pathways were highly represented in all modules except sienna3, which consisted of mostly specialized CM genes. In particular, genes of both canonical and noncanonical Wnt signaling pathways involved in cardiogenesis (Ueno et al. 2007; Piven and Winata 2017) were almost exclusively distributed between the green and salmon modules. Finally, another cardiac TF, Hand2, was present in the green module, suggesting that it might control these pathways. Altogether, we identified gene modules exhibiting unique expression patterns throughout heart development, representing potential regulatory networks underlying various processes of heart development.
Integrative analysis of RNA-seq and ATAC-seq identifies regulatory networks of CM maturation
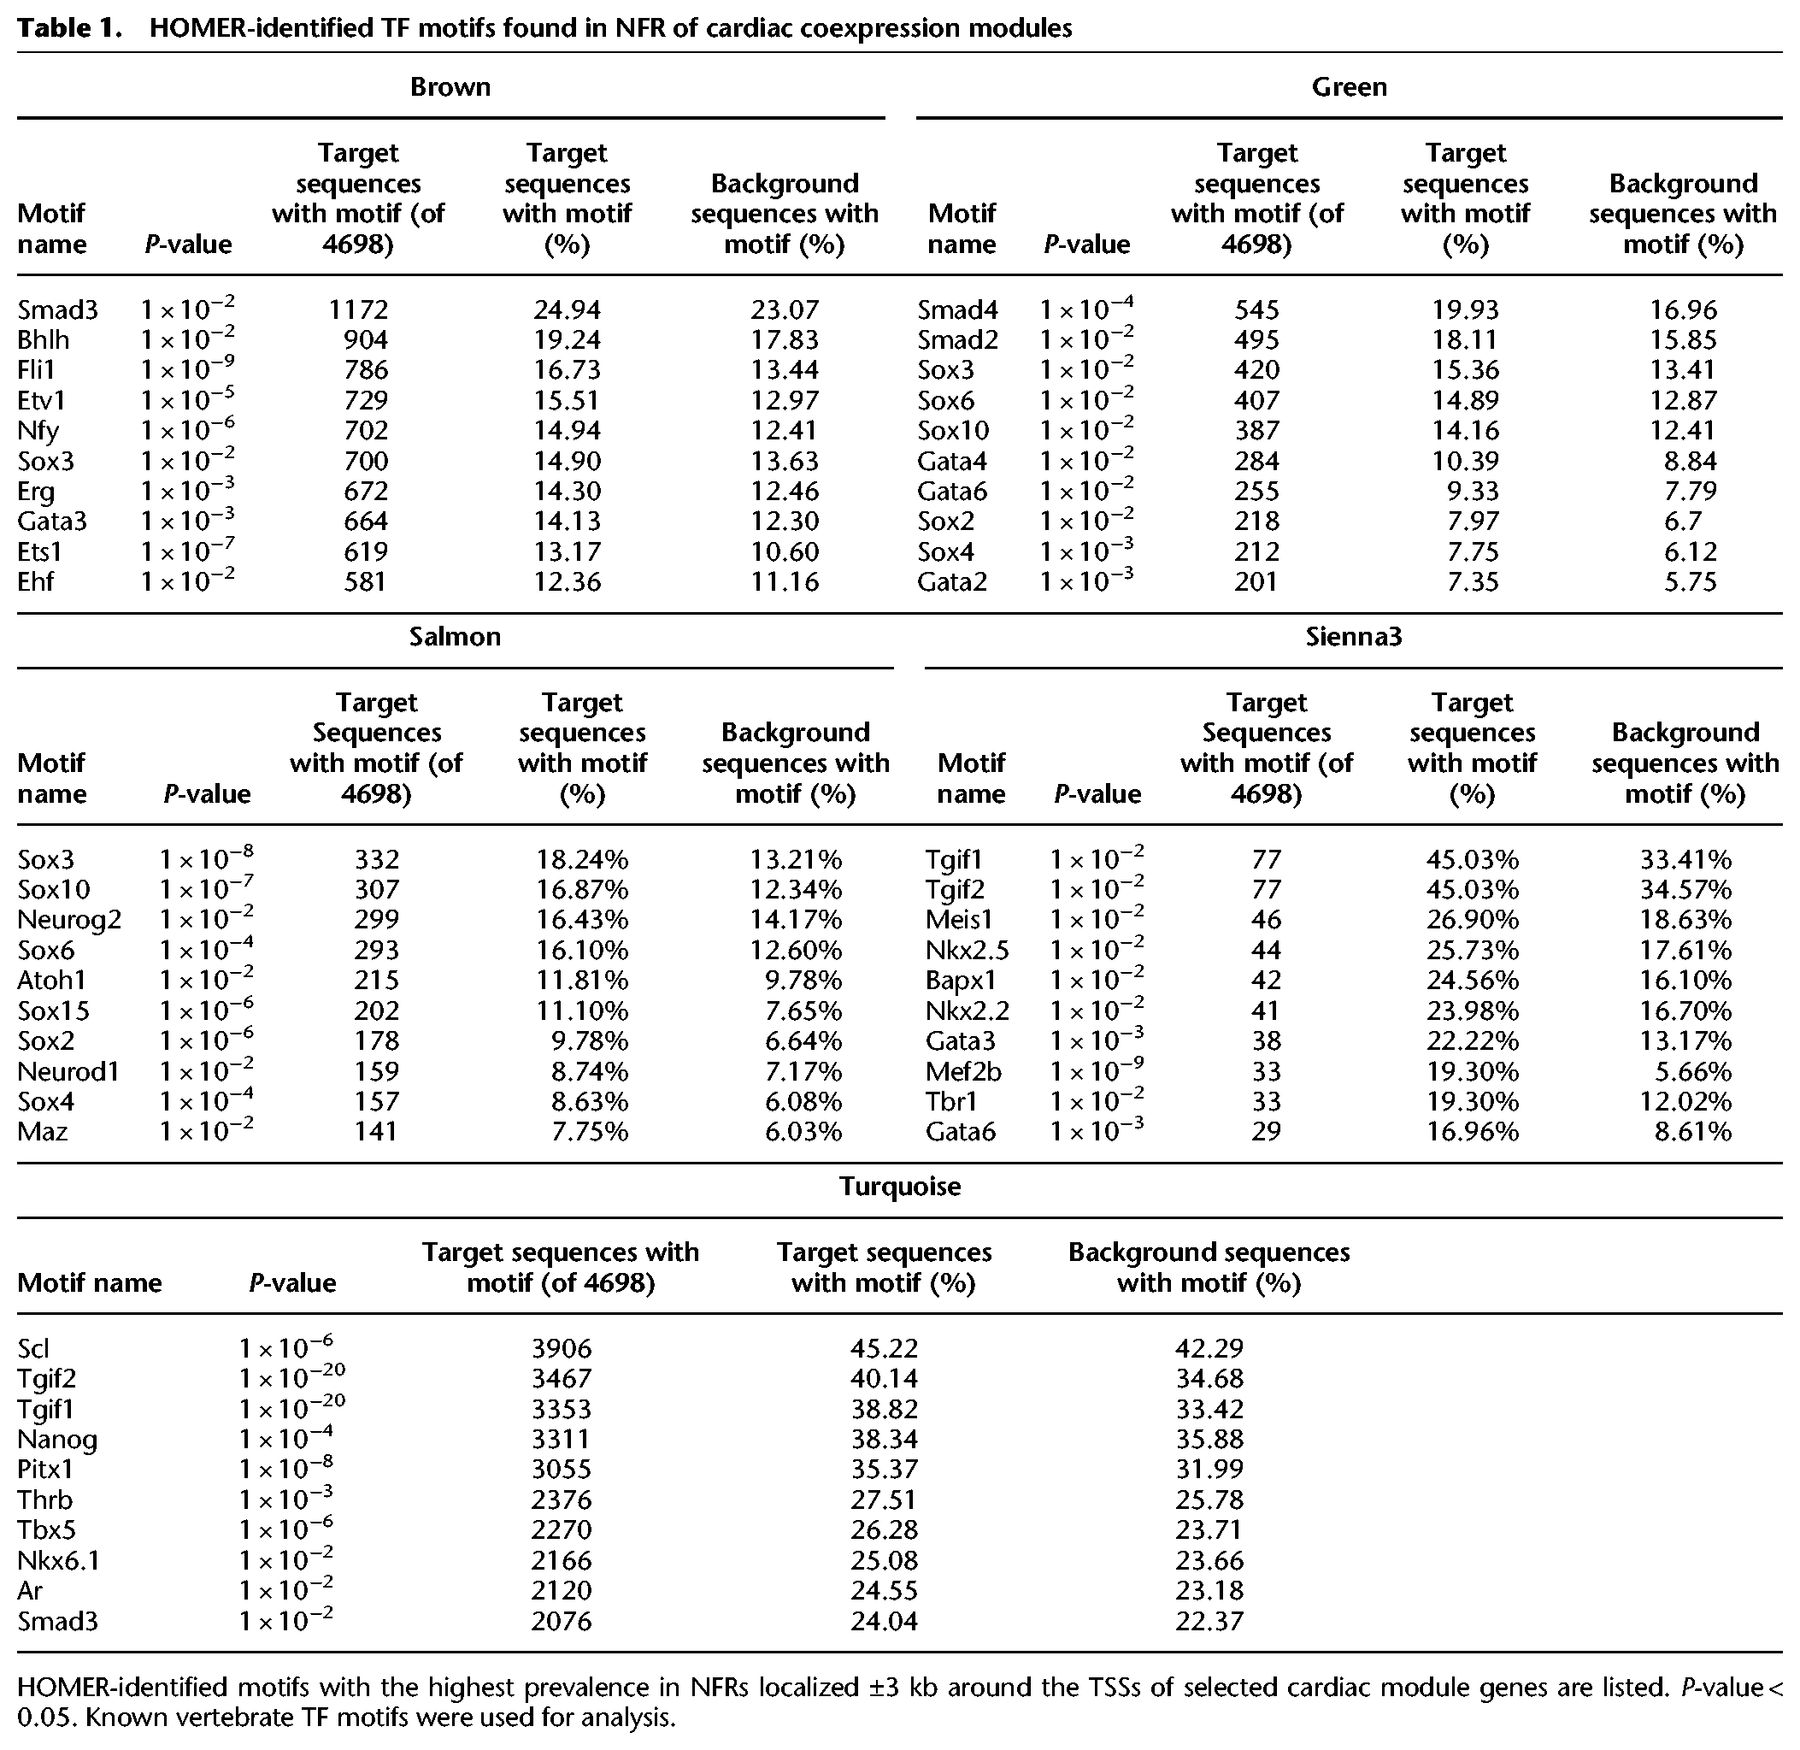
To further explore the relationship between chromatin state and transcriptional regulation of heart development, we integrated coexpression networks generated from RNA-seq with accessible chromatin regions identified by ATAC-seq. We examined NFRs localized within ±3 kb of the TSS of genes assigned to the same module for the presence of TF binding motifs (Table 1; Supplemental Fig. 3). NFRs associated with genes within the module sienna3 (which contained gata5/6, nkx2.5, and tbx20) were also enriched in motifs belonging to these families of TFs (Gata family [Gata1/2/3/4/6], Nkx family [Nkx2.2, Nkx2.5], Smad3 and T-box family [Tbr1]), whereas the salmon module containing the sox3 gene showed overrepresentation of Sox3 motif. Similarly, in the turquoise and green modules (containing tbx5, hand2, and smad7), we found a wide range of significantly enriched (P-value ≤ 0.05) TF motifs including Tbx5 and Smad2/4, respectively. The presence of the TFs together with the enrichment of their respective recognition motifs suggests their regulatory role within each module. Moreover, we observed an overrepresentation of motifs for TFs with profound roles in heart development, such as Sox10 in the salmon module and Tgif1/2 in both the sienna3 and turquoise modules (Montero et al. 2002; Powers et al. 2010), although their corresponding TFs were not present in the matching modules.
HOMER-identified TF motifs found in NFR of cardiac coexpression modules
To understand the relationship between chromatin accessibility and gene expression and to link TFs to their effector genes, we identified genes that were dynamically regulated and associated with regions of differential chromatin accessibility (within ±3 kb of TSS) throughout heart development (Fig. 4A). We compared normalized changes of gene expression to those of the corresponding NFRs between 24 and 48 hpf as well as between 48 and 72 hpf (Fig. 4B; Supplemental Tables 1, 5). We observed strong up-regulation of a large number of genes within the turquoise and salmon modules and down-regulation of genes in the brown module and for most genes belonging to the green module. This was generally consistent with the direction of changes in chromatin accessibility, for example, gpd2, sox10 in the turquoise module, commd5 in the salmon, tbx16l, pappa2 in the brown, and tfr1a, aff2 in the green; yet we also observed genes with the opposite behavior, including klf6a, irf2bp2a in the turquoise module, sema4ab in the brown, and serinc2 in the green. No significant changes in gene expression and NFR were observed between 48 and 72 hpf (Supplemental Tables 1, 5), suggesting that both gene expression and chromatin accessibility were more stable by heart chamber formation.
Dynamic regulatory networks of differentiating CMs. (A) Strategy used to establish gene-chromatin regulatory network. (B) Changes (log2FC) of gene expression compared to those in chromatin accessibility of cardiac module genes during heart development. Only significant (FDR < 0.05) genes are shown. (C) Regulatory networks of heart development. Arrows indicate the direction of interaction. Colors and the intensity of the circle edges indicate changes of chromatin accessibility, whereas those inside the circle show expression changes. Only significant (adjusted P-value ≤ 0.05) genes are shown. Hub TFs are indicated in red font. (D) Visualization of ATAC-seq and RNA-seq read coverage of selected genomic regions related to the turquoise module. (E) Visualization of ATAC-seq and RNA-seq read coverage of selected genomic regions related to the brown module. Time points, NFRs, and TF binding motifs within NFRs are indicated.
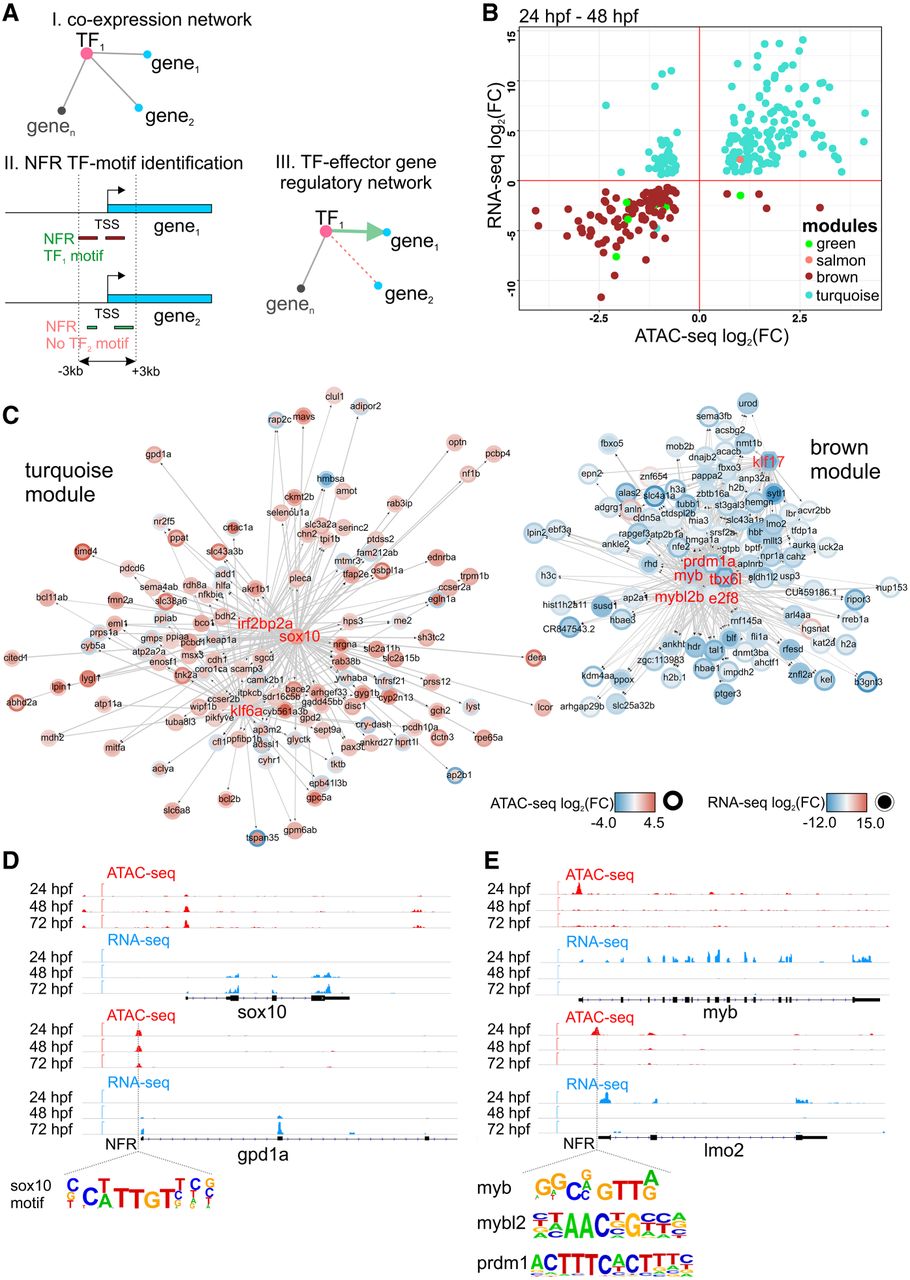
GO and pathway analysis of the turquoise module revealed genes involved in mitochondrial oxidation (mdh2, gpd2), carbohydrate metabolism (rdh8a), and ketone body metabolism (bdh2) (Fig. 4C,D; Supplemental Table 6). We identified sox10, klf6a, and irf2bp2a, which were previously linked to zebrafish heart morphogenesis (Hill et al. 2017), as hub genes linked to their effector genes containing corresponding binding motifs in NFRs within their proximal promoter regions. Because the vast majority of genes within the turquoise module exhibited significant increase in expression and chromatin accessibility within associated NFRs between 24 and 48 hpf, it suggests the presence of a metabolic switch that takes place in CM between those developmental stages. This agrees with previous reports showing that mitochondrial oxidative capacity and fatty acid oxidation potential increase along with CM maturation (Lopaschuk and Jaswal 2010).
Conversely, most of the genes assigned to the brown module were down-regulated from 48 hpf onward along with the associated NFR chromatin accessibility (Fig. 4C). Pathway and GO analysis of the brown module (Supplemental Table 7) revealed the presence of genes implicated in embryonic hematopoiesis. Notably, we have identified a number of hub TFs including myb (v-myb) and prdm1a, mybl2, tbx16l, e2f8, klf17 as well as their effector genes, such as lmo2, tal1, alas2, slc4a1a with profound roles in hematopoiesis (Fig. 4E; Gering et al. 2003; Paw et al. 2003; Chan et al. 2009; Soza-Ried et al. 2010; Kotkamp et al. 2014). Moreover, ATAC-seq analyses revealed the enrichment of Gata, Fli1, Ets, Erg, and Etv motifs (Table 1), which belong to the regulatory network underlying hematopoietic/vascular lineage specification (Gottgens et al. 2002; Pimanda et al. 2007; Loughran et al. 2008; Kaneko et al. 2010). The brown module possibly represents the regulatory network leading to hematopoietic fate, whose suppression promotes the development of CM identity. Altogether, we identified regulatory networks leading to metabolic and cardiac/hematopoietic changes occurring in CMs during early heart morphogenesis (Supplemental Table 8), which are regulated at both gene expression and chromatin levels.
Disruption of cardiac TFs affects regulatory networks driving CM maturation
To further explore cardiac regulatory modules and validate their importance in normal heart development, we used zebrafish mutants deficient in cardiac-related TFs (Gata5, Hand2, and Tbx5a), the disruption of which was linked to impaired migration of the cardiac primordia to the embryonic midline, reduced number of myocardial precursors, and failure of heart looping, respectively (Reiter et al. 1999; Yelon et al. 2000; Garrity et al. 2002). RNA-seq and ATAC-seq were performed on CMs isolated from homozygous gata5tm236a/tm236a, tbx5am21/ m21, hand2s6/s6 mutant 72 hpf embryos in Tg(myl7:EGFP) genetic background. Homozygous mutant embryos were selected based on their phenotypes of cardia bifida (gata5tm236a/tm236a, hand2s6/s6) or heart-string (tbx5am21/ m21) (Fig. 5A).
Loss-of-function mutations of cardiac TFs alters regulatory networks involved in heart development. (A) LSFM images of GFP-labeled CMs of wild-type and TF mutant zebrafish hearts at 72 hpf. The dotted line indicates exact area of the LSFM image. (B) Venn diagrams and GO enrichment analysis of TF mutant down-regulated (blue) and up-regulated (red) genes and chromatin accessibility of proximal promoter NFRs (±3 kb of TSS), adjusted P-value ≤ 0.05. (C) Percent distribution of cardiac module down-regulated genes/proximal NFR chromatin accessibility as compared to total number of TF mutants down-regulated genes/proximal NFR chromatin accessibility. (D) Percent distribution of cardiac module up-regulated genes/proximal NFR chromatin accessibility as compared to total number of TF mutants up-regulated genes/proximal NFR chromatin accessibility. (E) Cardiac module genes with differentially regulated expression and chromatin accessibility of proximal promoter NFRs (±3 kb of TSS) in gata5, hand2, and tbx5a mutants.
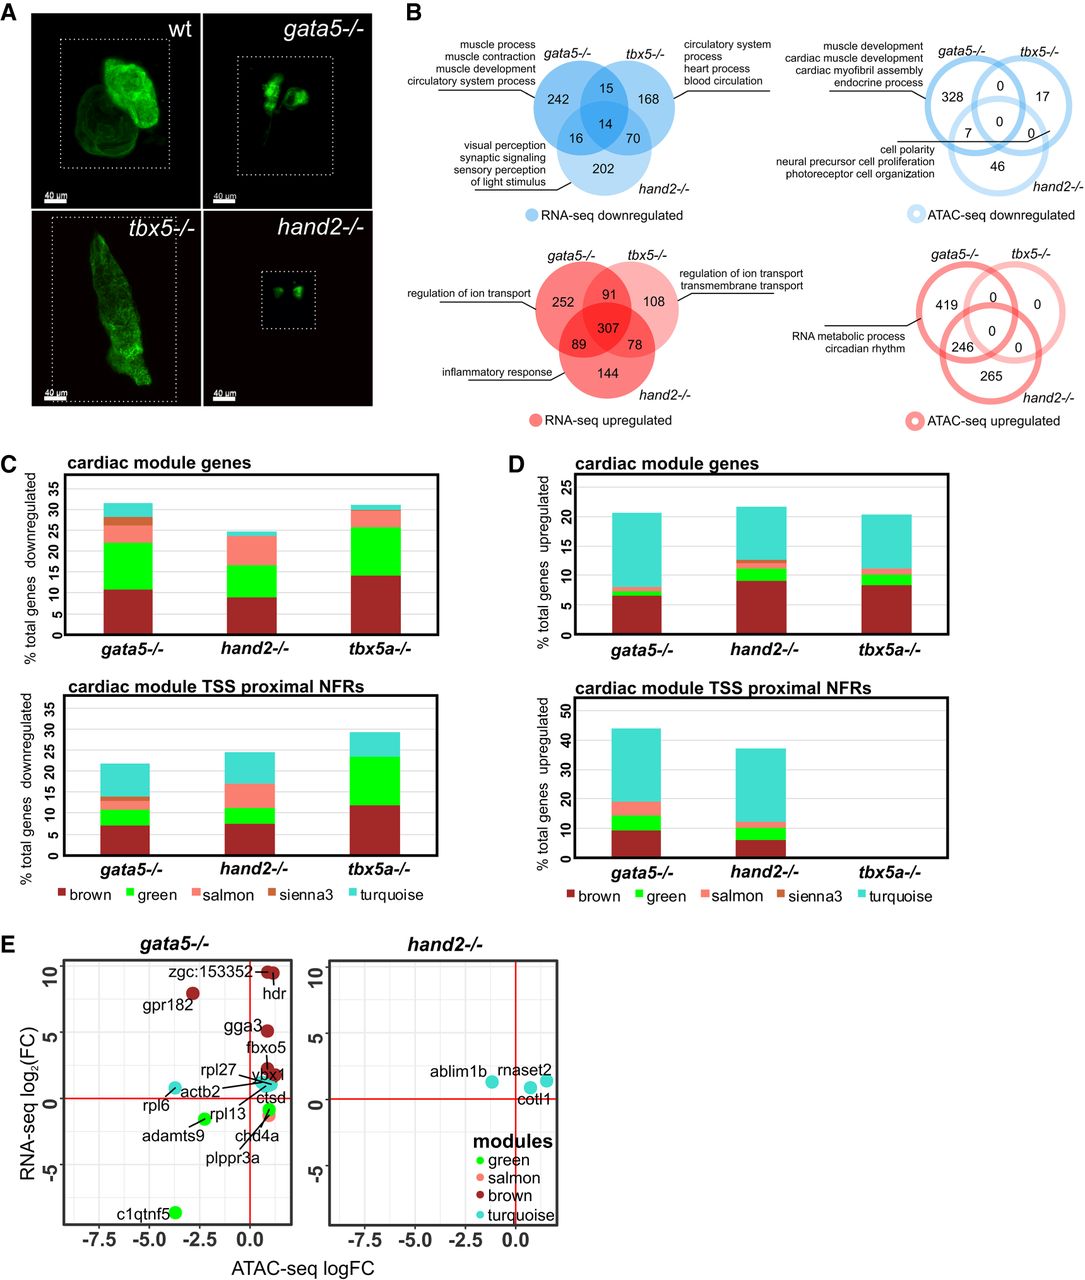
A number of genes were dysregulated (absolute[log2FC] > 0, adjusted P-value ≤ 0.05) in response to disruption of gata5 (287 down-regulated, 739 up-regulated), hand2 (288 down-regulated, 618 up-regulated), and tbx5a (255 down-regulated, 584 up-regulated) (Fig. 5B; Supplemental Table 9). Only a small overlap was observed between genes down-regulated in the three mutants (14 genes including vcanb, bmp3, and col18a1b), whereas up-regulated genes showed larger overlap (307 genes, e.g., trim46, map4k6, mtf1) between all three mutants. GO enrichment analysis of all down-regulated genes revealed the presence of biological processes related to muscle development, muscle function, heart process, and sensory perception signaling; up-regulated genes were enriched in biological processes related to ion transport and inflammatory response (Supplemental Table 10).
Changes in chromatin accessibility of NFRs localized in proximal promoter regions (±3 kb of TSS) of mutants and wild-type embryos were generally less pronounced than changes in gene expression (Fig. 5B; Supplemental Table 9). Moreover, loss of different TFs affected the chromatin to a variable extent, the largest of which occurred in gata5tm236a/tm236a mutants (335 differentially accessible NFRs associated with genes enriched in cardiac muscle development processes) (Fig. 5B; Supplemental Table 10). In hand2s6/s6 mutants, 53 NFRs were down-regulated. Lesser pronounced chromatin changes were identified in tbx5am21/ m21 mutant (17 NFRs). Seven down-regulated NFRs associated with nkx1.21a, dmd, frzb, gpr4, and vap were common between gata5tm236a/tm236a and hand2s6/s6 mutants, whereas 246 up-regulated ones were localized in the proximity of nr4a1, mycbp2, irf2bp2a, rpl3. No differentially regulated proximal NFRs were shared between all three mutants.
We further explored which fraction of mutant down-regulated genes contributed to the cardiac regulatory modules identified in wild-type analyses. We found that 31% (91 genes), 24% (71 genes), and 31% (79 genes) of total down-regulated genes in gata5tm236a/tm236a, hand2s6/s6, and tbx5am21/m21 mutants were present in cardiac modules, mainly in the brown and green modules (Fig. 5C). Among the 14 genes that were commonly down-regulated in all three mutants, four belonged to green (nid1b, papss2b, vcanb, bmp3) and two to salmon (plppr3a, spon1b) modules. Genes including vcan, plppr3a, and Bmp family were previously found to play a crucial role in heart morphogenesis and function (Marques and Yelon 2009; Kern et al. 2010; Chandra et al. 2018). Similarly, comparing chromatin accessibility data revealed that 21% (73 regions), 24% (13 regions), and 29% (five regions) of proximal NFRs that showed decreased accessibility in gata5tm236a/tm236a, hand2s6/s6, and tbx5am21/ m21 mutants were located within the proximal promoters of genes belonging to cardiac modules (Fig. 5C). We also explored mutant up-regulated genes and proximal NFRs associated with cardiac modules (Fig. 5D). It showed that 20% (153 genes), 21% (134 genes), and 20% (119 genes) of total up-regulated genes in gata5tm236a/tm236a, hand2s6/s6, and tbx5am21/m21 mutants were present in cardiac modules, predominantly in the brown and turquoise modules. Consequently, the most prominent changes were observed for proximal NFRs in the brown and turquoise modules, and 43% (292 regions) and 37% (229 regions) of total up-regulated NFRs contributed to cardiac modules in gata5tm236a/tm236a and hand2s6/s6. No changes were observed in tbx5am21/ m21 mutants. The vast majority of either down-regulated or up-regulated cardiac module genes did not exhibit a similar regulation of NFR chromatin accessibility within their promoter regulatory regions (Supplemental Fig. 4). We observed that the decrease in proximal promoter NFRs was not correlated with the gene expression down-regulation, except for c1qtnf5 and adamts9, the latter being a vcan-degrading protease required for normal heart development and cardiac allostasis (Supplemental Fig. 5A,B; Kern et al. 2010). Similarly, only 10 genes including hdr, gga3, fbxo5, rpl27, ybx1, actb2, cotl1, rnaset2 showed an increase in both gene expression and NFR chromatin accessibility (Fig. 5E). Only 15 genes showed changes both in expression level and chromatin accessibility (either increasing or decreasing) in gata5 mutant and three genes in hand2 mutant, whereas no such genes were found in tbx5a mutant.
Taken together, we identified genes that were responsive to loss of Gata5, Hand2, and Tbx5a functions, including those belonging to cardiac modules, therefore providing a strong validation of the cardiac regulatory networks controlling specific processes of heart development.
Evolutionarily conserved enhancers ensure proper heart development
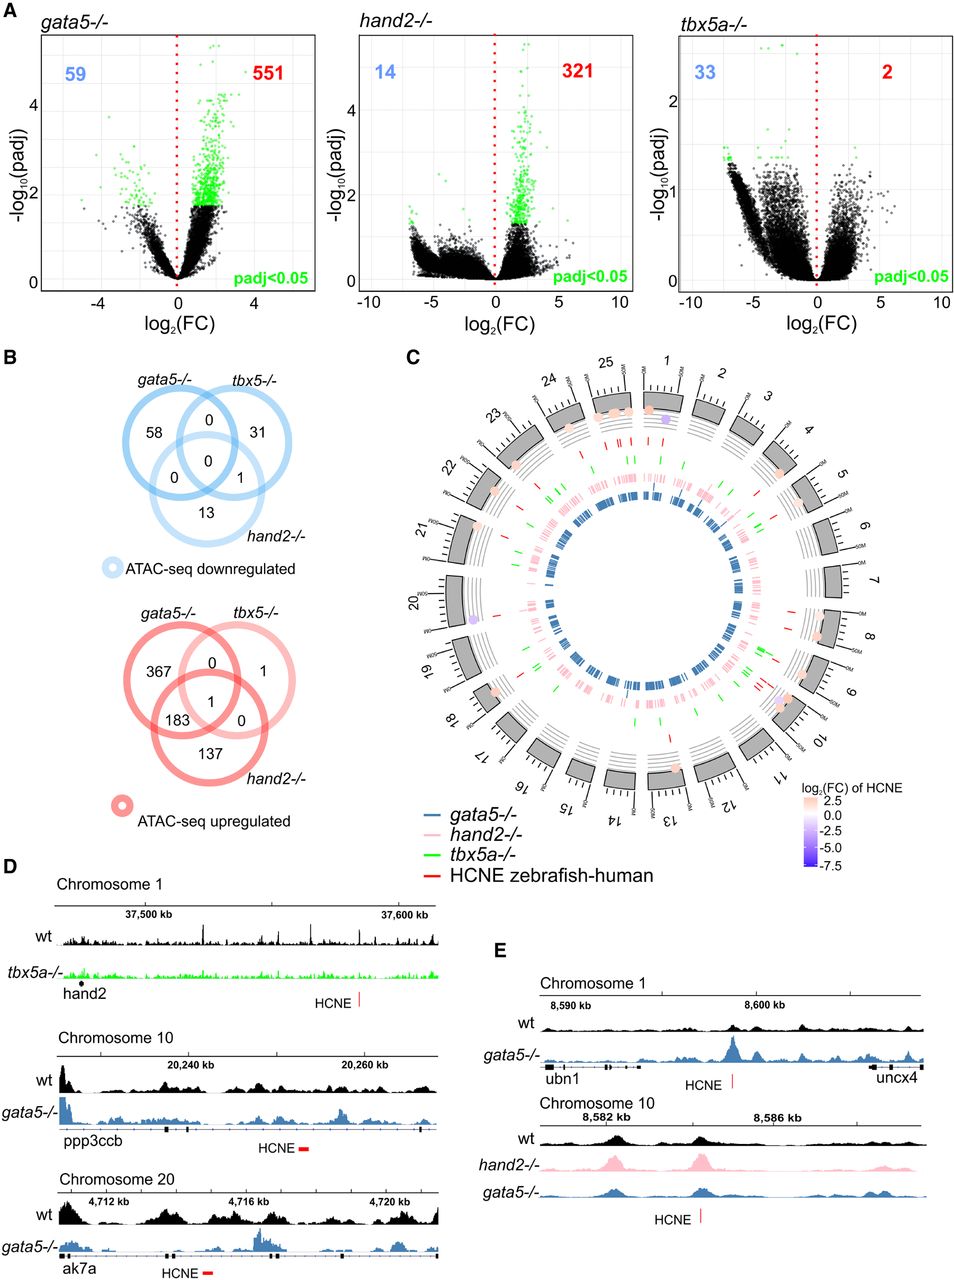
Gene expression changes in all three mutants were, to a large extent, uncorrelated with changes in chromatin accessibility, at least in proximal promoter regulatory regions. This led us to question whether loss of Gata5, Hand2, and/or Tbx5a cardiac TFs may cause global chromatin changes at genomic sites other than proximal gene promoters, and whether the observed changes in gene expression could be attributed to distal regulatory elements. To this end, we have identified distal NFRs (more than ±3 kb of TSS) and their differential accessibility between wild type at 72 hpf and the mutants. We identified 59, 14, and 33 down-regulated and 551, 321, and 2 regions up-regulated (adjusted P-value ≤ 0.05) in gata5tm236a/tm236a, hand2s6/s6, and tbx5am21/ m21 mutants, respectively (Fig. 6A). Among down-regulated regions, one was in common between gata5tm236a/tm236a and tbx5m21/ m21 mutants (Fig. 6B). On the other hand, much stronger overlap was observed between gata5tm236a/tm236a and hand2s6/s6 mutants for up-regulated regions (183 regions), whereas no overlap was found between gata5tm236a/tm236a and tbx5m21/ m21. One region at Chr 21: 15,013,048–15,013,154 was commonly up-regulated in all three mutants. To further explore genomic locations of differentially regulated distal NFRs and identify evolutionary conserved putative enhancers, we compared them with the database of highly conserved noncoding elements (HCNEs) between zebrafish and human (Fig. 6C; Supplemental Table 11; Engström et al. 2008). We found a total of 22 regions to be conserved between zebrafish and human genomic sequences among which three were down-regulated in tbx5a and hand2 mutants, whereas 19 of them showed significantly increased accessibility in hand2 and gata5 mutants. The three most down-regulated HCNEs were localized on Chromosome 1, between hand2 and fbxo8 loci (Chr 1: 37,584,384–37,584,724) as well as those localized in the introns of ppp3ccb (Chr 10: 20,246,264–20,246,845) and akt7a (Chr 20: 4,714,760–4,715,050) genes (Fig. 6D). We also identified HCNE-NFRs with increased chromatin accessibility in gata5 mutant (Chr 1: 8,598,642–8,598,893) and in the genomic region at Chr 10: 8,580,509–8,581,153, which was commonly up-regulated in hand2 and gata5 mutants (Fig. 6E). Therefore, we have determined a number of distal NFRs whose accessibility is affected by mutations of cardiac TFs, among which we identified highly conserved NFRs serving as potential enhancers that may play key roles in heart development.
Identification of putative cardiac enhancers. (A) A volcano plot of differentially accessible distal NFRs between wild-type and TF mutants at 72 hpf. Adjusted P-value ≤ 0.05 are indicated in green, the number of down-regulated NFRs is indicated in blue, and up-regulated NFRs in red. (B) Venn diagram of mutant down- and up-regulated distal NFRs (more than ±3 kb of TSS); adjusted P-value ≤ 0.05. (C) Graphical representation of differentially accessible distal NFRs genomic localization onto zebrafish chromosomes. NFRs overlapping with HCNE (±500 bp) and their accessibility log2FC in comparison to wild type is indicated; adjusted P-value < 0.05. (D) Genome track of ATAC-seq peaks for wild type (black), tbx5a−/− (green), and gata5−/− (blue) for the three most down-regulated NFRs overlapping with HCNE (±500 bp). (E) Genome track of ATAC-seq peaks for wild type (black), hand2−/− (pink), and gata5−/− (blue) of the three most up-regulated NFRs overlapping with HCNE (±500 bp).
Discussion
Heart development involves multiple layers of interactions at molecular, cellular, and tissue levels. These processes are regulated by various TFs, signaling proteins, as well as epigenetic factors such as histone and DNA modifications, chromatin remodeling, and transcriptional enhancers. We obtained CM-enriched cell fractions from developing heart during crucial events of heart morphogenesis. GFP-positive cells were sorted from transgenic Tg(nxk2.5:EGFP), Tg(myl7:EGFP) zebrafish embryos. In zebrafish, at 6-9 somite stage (∼12–14 hpf), nkx2.5 expression only partially overlaps the anterior lateral plate mesoderm (ALPM) in its medial part (Schoenebeck et al. 2007), whereas at 17 somite stage (∼17–18 hpf), the most posterior nkx2.5+ cells of the bilateral cardiac primordia do not express myl7, a marker of terminal myocardial differentiation, suggesting the presence of nkx2.5+ cells that do not contribute to the myocardium (Yelon et al. 1999). This agrees with other studies in zebrafish, suggesting the presence of specific nkx2.5+ second heart field (SHF) progenitors that give rise to the fraction of ventricular myocardium and outflow tract (OFT) (Guner-Ataman et al. 2013). Nevertheless, it has been shown that at prim-5 stage (24–30 hpf), nkx2.5 is expressed both in ventricular and atrial myocardium exactly overlapping the expression of myl7 (Yelon et al. 1999). The most prominent changes in gene expression and chromatin accessibility occurred between linear heart tube formation (24 hpf) and looping (48 hpf). This major shift in molecular profile likely reflects the continuous process of CM differentiation throughout which progenitors migrate and differentiate into CMs once they are incorporated into the growing heart tube (Kelly et al. 2014). Importantly, genes in the sienna3 and turquoise modules showed significant increase in expression between the two developmental stages. In particular, sienna3 genes were enriched in the largest number of GO terms related to cardiac function and contained at least three TFs known for their crucial roles in specification of CMs and their function in heart contraction (Singh et al. 2005, 2010), which suggests the prominent role of this network in CM differentiation and heart tube formation during this developmental period. Concordantly, we observed that chromatin landscape changed most significantly between 24 and 48 hpf, suggesting that the changes in gene expression profiles during this stage were likely regulated at the chromatin level. Besides validating the biological relevance of our ATAC-seq data set, this observation suggests that active chromatin remodeling occurs throughout development, and the regions with differential accessibility represent cis-regulatory hubs driving the biological processes associated with differentiating CMs.
Modules of coregulated genes represent subnetworks underlying specific biological processes associated with heart development. Further integration of these networks with ATAC-seq data allowed us to link TFs to their putative target genes, which was supported by the enrichment of DNA binding motif for specific TFs within NFRs in proximal promoters of the genes within each particular module. Collectively, our analyses of the regulatory networks and their representative expression patterns revealed increased expression of genes defining CM structure and function, whereas the expression and proximal promoter chromatin accessibility of hematopoietic genes were suppressed during CM differentiation. Sorted GFP-positive cells also expressed hematopoietic determinants at the earliest stage observed (24 hpf). These were grouped into a single expression module (brown) and correlated between gene expression dynamics and chromatin accessibility in proximal promoters that decreased between 24 and 48 hpf. One explanation is that the expression of hemato-vascular genes was contributed by cells giving rise to the pharyngeal arch mesoderm which also express nkx2.5 used as our selection marker. Another equally plausible hypothesis is that a group of cells that possess alternative potential to become the blood or vascular lineage exist within the pool of CM progenitors. Numerous evidences from mouse studies suggested the presence of bipotential cardiac progenitor populations which coexpressed cardiac and hematopoietic markers in the developing heart tube (Caprioli et al. 2011; Nakano et al. 2013; Zamir et al. 2017). To distinguish between these possibilities, it would be necessary to obtain molecular profiles of individual cells to determine whether hemato-vascular progenitors exist as a separate population expressing specific markers or rather, as a common progenitor population expressing both CM and hemato-vascular markers. This also highlights the limitations of currently available marker genes and calls for higher resolution analyses of gene expression in specific cell types, which is possible with the single cell sequencing technology.
Finally, comparing wild-type CMs to that of Gata5, Hand2, and Tbx5 mutants, we observed only a minor correlation between changes in gene expression and chromatin accessibility within proximal promoter NFRs, suggesting that transcriptional regulation of genes involved in heart development might be affected by distal regulatory elements. Alternatively, changes in gene expression between wild-type and TF mutants could be related to impaired TF binding to constitutively accessible proximal NFRs. Because we could only perform mutant analyses at 72 hpf , we could not rule out the possibility of observing secondary effects arising from changes in earlier developmental stages. Moreover, the lack of chromatin interaction data prevents the inference of definitive associations between distal regulatory elements and their target genes. Regardless, we identified a substantial number of gene-distal-located NFRs that were altered in accessibility in mutants that may serve as potential distal transcriptional regulatory elements, some of which were highly conserved between zebrafish and human, suggesting that they might be critical developmental enhancers (Polychronopoulos et al. 2017).
Altogether, we characterized the dynamics of gene expression and chromatin landscape during heart development and identified genetic regulatory hubs driving biological processes in CMs at different stages of heart morphogenesis. We elucidated the alterations in global transcriptional regulatory landscape resulting from disruptions to the developmental program caused by the loss of cardiac TFs. Collectively, our study identified potential target genes and regulatory elements implicated in heart development and disease.
Methods
CM collection by fluorescence-activated cell sorting (FACS)
Zebrafish transgenic lines Tg(nxk2.5:EGFP), Tg(myl7:EGFP) in AB wild type and gata5tm236a/+ (Reiter et al. 1999), tbx5am21/+ (Garrity et al. 2002), hand2s6/+ (Yelon et al. 2000) mutant background were maintained in the International Institute of Molecular and Cell Biology (IIMCB) zebrafish facility (License no. PL14656251) according to standard procedures. Cell suspension was prepared from 500 embryos and larvae as previously described (Winata et al. 2013), omitting the fixation step and directly resuspending cells in FACSmax Cell Dissociation Solution (AMS Biotechnology) for cell sorting. Fluorescent (GFP+) and nonfluorescent cells (GFP−) were sorted by using FACSAria II cytometer (BD Biosciences).
qPCR
Total RNA was extracted from 100,000 GFP+ and GFP− cells using TRIzol LS (Thermo Fisher Scientific) according to the manufacturer's protocol and followed by DNase I (Life Technologies) treatment. Transcriptor first strand cDNA synthesis kit (Roche Life Science) was used to obtain cDNA. Relative mRNA expression was quantified by using FastStart SYBR Green master mix on the Light Cycler 96 instrument (Roche Life Science) with specific primer sets (Supplemental Table 12).
RNA-seq
For RNA-seq, 100,000 GFP+ and GFP− cells were sorted directly to TRIzol LS (Thermo Fisher Scientific). cDNA synthesis for next-generation sequencing (NGS) was performed by SMARTer Universal Low Input RNA Kit (Clontech Laboratories) as recommended by the manufacturer. Paired-end sequencing (2 × 75 bp reads) was performed with NextSeq 500 (Illumina). Pearson correlation of biological replicates and read distribution over zebrafish genome features were performed (Supplemental Fig. 6A,B).
Assay for transposase-accessible chromatin with high-throughput sequencing (ATAC-seq)
For ATAC-seq, 60,000 GFP+ cells from zebrafish embryos were sorted to Hank's solution (1× HBSS, 2 mg/mL BSA, 10 mM HEPES at pH 8.0), centrifuged for 5 min at 500g, and prepared for chromatin tagmentation as previously described (Buenrostro et al. 2015). Paired-end sequencing (2 × 75 bp reads) was performed with NextSeq 500 (Illumina).
Light sheet fluorescence microscopy (LSFM)
Embryos were maintained in medium containing 0.003% 1-phenyl-2-thiourea. For LFSM (Zeiss), embryos were collected and mounted in 1% low-melting agarose (Sigma-Aldrich). Images were analyzed with Imaris 8 software (Bitplane).
Bioinformatics analysis
Raw RNA-seq and ATAC-seq reads were quality checked using FastQC (0.11.5) (http://www.bioinformatics.babraham.ac.uk/projects/fastqc/). Adapters were removed using Trimmomatic (0.36) (Bolger et al. 2014). Reads matching ribosomal RNA were removed using rRNAdust (Hasegawa et al. 2014). Reads quality filtering was performed using SAMtools (1.4) (Li et al. 2009). RNA-seq reads were aligned to the zebrafish reference genome (GRCz10) using STAR (2.5) (Supplemental Fig. 7; Dobin et al. 2013). Bowtie 2 (2.2.9) (Langmead and Salzberg 2012) was used to map ATAC-seq reads to the GRCz10 genome (Supplemental Fig. 8). Read distribution was assessed with Picard (2.10.3). NFR regions were identified as previously described (Buenrostro et al. 2013). Peaks of open chromatin regions were called using MACS2 (2.1.0) (Zhang et al. 2008). Enriched motifs in NFRs were identified using HOMER (Heinz et al. 2010). Downstream bioinformatics analysis were performed in R 3.4 using following Bioconductor and CRAN (Huber et al. 2015) packages as indicated in Supplemental Data. RNA-seq gene counts and ATAC-seq NFR read counts for all samples were transformed to regularized log (rld) (Supplemental Tables 13, 14). Differentially accessible ATAC-seq peaks were quantified by DESeq2 (Supplemental Table 15). Gene network visualization and statistical analysis of gene networks was performed using Cytoscape (Cline et al. 2007). Metascape was used to visualize the output of GO enrichment analysis (Tripathi et al. 2015).
Data access
RNA-seq and ATAC-seq data from this study have been submitted to the NCBI Gene Expression Omnibus (GEO; https://www.ncbi.nlm.nih.gov/geo/) under accession number GSE120238.
Acknowledgments
We thank D. Garrity for sharing tbx5am21/+ and D. Yelon for hand2s6/+ zebrafish mutant lines and D. Stainier for sharing Tg(nxk2.5:GFP) and Tg(myl7:GFP). We thank V. Korzh and members of the Winata laboratory for fruitful discussions. This work was supported by EU/FP7: Research Potential FISHMED, grant number 316125, National Science Centre, Poland, OPUS grant number 2014/13/B/NZ2/03863. M.P. is supported by Foundation for Polish Science and Ministry of Science and Higher Education, Poland and National Science Centre, Poland, SONATA grant number 2014/15/D/NZ5/03421. M.M. is a recipient of the Postgraduate School of Molecular Medicine doctoral fellowship for the program “Next generation sequencing technologies in biomedicine and personalized medicine.” This work was also supported by Research Grants from MEXT Japan to the RIKEN Center for Life Science Technologies (RIKEN CLST) and to the RIKEN Center for Integrative Medical Sciences (RIKEN IMS).
Author contributions: M.P., K.Z.K., M.M., and J.A.R. performed bioinformatics and statistical analysis. M.P., K.Z.K., and A.M. collected embryos, performed in vivo experiments, and collected biological material. M.P. and K.A.N. prepared NGS libraries and performed RNA-seq and ATAC-seq. M.P. performed LSFM. L.B. and K.P. performed FACS. M.P., C.L.W., J.A.R., and K.H. contributed to genomic data analysis. M.P., K.Z.K., M.M., J.A.R., P.C., and C.L.W. contributed to the design of the study and interpreted data. M.P. prepared the figures. M.P. and C.L.W. conceived the study and wrote the manuscript. C.L.W. is the corresponding senior author.
Notes
[1] Supplementary material [Supplemental material is available for this article.]
[2] Article published online before print. Article, supplemental material, and publication date are at http://www.genome.org/cgi/doi/10.1101/gr.244491.118.
[3] Freely available online through the Genome Research Open Access option.
References
- ↵Ahn DG, Ruvinsky I, Oates AC, Silver LM, Ho RK. 2000. tbx20, a new vertebrate T-box gene expressed in the cranial motor neurons and developing cardiovascular structures in zebrafish. Mech Dev 95: 253–258. 10.1016/S0925-4773(00)00346-4
- ↵Bolger AM, Lohse M, Usadel B. 2014. Trimmomatic: a flexible trimmer for Illumina sequence data. Bioinformatics 30: 2114–2120. 10.1093/bioinformatics/btu170
- ↵Bruneau BG, Nemer G, Schmitt JP, Charron F, Robitaille L, Caron S, Conner DA, Gessler M, Nemer M, Seidman CE, 2001. A murine model of Holt-Oram syndrome defines roles of the T-box transcription factor Tbx5 in cardiogenesis and disease. Cell 106: 709–721. 10.1016/S0092-8674(01)00493-7
- ↵Buenrostro JD, Giresi PG, Zaba LC, Chang HY, Greenleaf WJ. 2013. Transposition of native chromatin for fast and sensitive epigenomic profiling of open chromatin, DNA-binding proteins and nucleosome position. Nat Methods 10: 1213–1218. 10.1038/nmeth.2688
- ↵Buenrostro JD, Wu B, Chang HY, Greenleaf WJ. 2015. ATAC-seq: a method for assaying chromatin accessibility genome-wide. Curr Protoc Mol Biol 109: 21.29.1–29.29.9. 10.1002/0471142727.mb2129s109
- ↵Caprioli A, Koyano-Nakagawa N, Iacovino M, Shi X, Ferdous A, Harvey RP, Olson EN, Kyba M, Garry DJ. 2011. Nkx2-5 represses Gata1 gene expression and modulates the cellular fate of cardiac progenitors during embryogenesis. Circulation 123: 1633–1641. 10.1161/CIRCULATIONAHA.110.008185
- ↵Chan YH, Chiang MF, Tsai YC, Su ST, Chen MH, Hou MS, Lin KI. 2009. Absence of the transcriptional repressor Blimp-1 in hematopoietic lineages reveals its role in dendritic cell homeostatic development and function. J Immunol 183: 7039–7046. 10.4049/jimmunol.0901543
- ↵Chandra M, Escalante-Alcalde D, Bhuiyan MS, Orr AW, Kevil C, Morris AJ, Nam H, Dominic P, McCarthy KJ, Miriyala S, 2018. Cardiac-specific inactivation of LPP3 in mice leads to myocardial dysfunction and heart failure. Redox Biol 14: 261–271. 10.1016/j.redox.2017.09.015
- ↵Chen Z, Huang W, Dahme T, Rottbauer W, Ackerman MJ, Xu X. 2008. Depletion of zebrafish essential and regulatory myosin light chains reduces cardiac function through distinct mechanisms. Cardiovasc Res 79: 97–108. 10.1093/cvr/cvn073
- ↵Cline MS, Smoot M, Cerami E, Kuchinsky A, Landys N, Workman C, Christmas R, Avila-Campilo I, Creech M, Gross B, 2007. Integration of biological networks and gene expression data using Cytoscape. Nat Protoc 2: 2366–2382. 10.1038/nprot.2007.324
- ↵D'Amico L, Scott IC, Jungblut B, Stainier DY. 2007. A mutation in zebrafish hmgcr1b reveals a role for isoprenoids in vertebrate heart-tube formation. Curr Biol 17: 252–259. 10.1016/j.cub.2006.12.023
- ↵Dobin A, Davis CA, Schlesinger F, Drenkow J, Zaleski C, Jha S, Batut P, Chaisson M, Gingeras TR. 2013. STAR: ultrafast universal RNA-seq aligner. Bioinformatics 29: 15–21. 10.1093/bioinformatics/bts635
- ↵Dupays L, Shang C, Wilson R, Kotecha S, Wood S, Towers N, Mohun T. 2015. Sequential binding of MEIS1 and NKX2-5 on the Popdc2 gene: a mechanism for spatiotemporal regulation of enhancers during cardiogenesis. Cell Rep 13: 183–195. 10.1016/j.celrep.2015.08.065
- ↵Engström PG, Fredman D, Lenhard B. 2008. Ancora: a web resource for exploring highly conserved noncoding elements and their association with developmental regulatory genes. Genome Biol 9: R34. 10.1186/gb-2008-9-2-r34
- ↵Etard C, Roostalu U, Strähle U. 2010. Lack of Apobec2-related proteins causes a dystrophic muscle phenotype in zebrafish embryos. J Cell Biol 189: 527–539. 10.1083/jcb.200912125
- ↵Garrity DM, Childs S, Fishman MC. 2002. The heartstrings mutation in zebrafish causes heart/fin Tbx5 deficiency syndrome. Development 129: 4635–4645.
- ↵George V, Colombo S, Targoff KL. 2015. An early requirement for nkx2.5 ensures the first and second heart field ventricular identity and cardiac function into adulthood. Dev Biol 400: 10–22. 10.1016/j.ydbio.2014.12.019
- ↵Gering M, Yamada Y, Rabbitts TH, Patient RK. 2003. Lmo2 and Scl/Tal1 convert non-axial mesoderm into haemangioblasts which differentiate into endothelial cells in the absence of Gata1. Development 130: 6187–6199. 10.1242/dev.00875
- ↵Gottgens B, Nastos A, Kinston S, Piltz S, Delabesse EC, Stanley M, Sanchez MJ, Ciau-Uitz A, Patient R, Green AR. 2002. Establishing the transcriptional programme for blood: the SCL stem cell enhancer is regulated by a multiprotein complex containing Ets and GATA factors. EMBO J 21: 3039–3050. 10.1093/emboj/cdf286
- ↵Guner-Ataman B, Paffett-Lugassy N, Adams MS, Nevis KR, Jahangiri L, Obregon P, Kikuchi K, Poss KD, Burns CE, Burns CG. 2013. Zebrafish second heart field development relies on progenitor specification in anterior lateral plate mesoderm and nkx2.5 function. Development 140: 1353–1363. 10.1242/dev.088351
- ↵Hasegawa A, Daub C, Carninci P, Hayashizaki Y, Lassmann T. 2014. MOIRAI: a compact workflow system for CAGE analysis. BMC Bioinformatics 15: 144. 10.1186/1471-2105-15-144
- ↵Heinz S, Benner C, Spann N, Bertolino E, Lin YC, Laslo P, Cheng JX, Murre C, Singh H, Glass CK. 2010. Simple combinations of lineage-determining transcription factors prime cis-regulatory elements required for macrophage and B cell identities. Mol Cell 38: 576–589. 10.1016/j.molcel.2010.05.004
- ↵Hill JT, Demarest B, Gorsi B, Smith M, Yost HJ. 2017. Heart morphogenesis gene regulatory networks revealed by temporal expression analysis. Development 144: 3487–3498. 10.1242/dev.154146
- ↵Holtzinger A, Evans T. 2007. Gata5 and Gata6 are functionally redundant in zebrafish for specification of cardiomyocytes. Dev Biol 312: 613–622. 10.1016/j.ydbio.2007.09.018
- ↵Houk AR, Yelon D. 2016. Strategies for analyzing cardiac phenotypes in the zebrafish embryo. Methods Cell Biol 134: 335–368. 10.1016/bs.mcb.2016.03.002
- ↵Huber W, Carey VJ, Gentleman R, Anders S, Carlson M, Carvalho BS, Bravo HC, Davis S, Gatto L, Girke T, 2015. Orchestrating high-throughput genomic analysis with Bioconductor. Nat Methods 12: 115–121. 10.1038/nmeth.3252
- ↵Jensen B, Wang T, Christoffels VM, Moorman AF. 2013. Evolution and development of the building plan of the vertebrate heart. Biochim Biophys Acta, Mol. Cell 1833: 783–794. 10.1016/j.bbamcr.2012.10.004
- ↵Kaneko H, Shimizu R, Yamamoto M. 2010. GATA factor switching during erythroid differentiation. Curr Opin Hematol 17: 163–168. 10.1097/MOH.0b013e32833800b8
- ↵Kelly RG, Buckingham ME, Moorman AF. 2014. Heart fields and cardiac morphogenesis. Cold Spring Harb Perspect Med 4: a015750. 10.1101/cshperspect.a015750
- ↵Kern CB, Wessels A, McGarity J, Dixon LJ, Alston E, Argraves WS, Geeting D, Nelson CM, Menick DR, Apte SS. 2010. Reduced versican cleavage due to Adamts9 haploinsufficiency is associated with cardiac and aortic anomalies. Matrix Biol 29: 304–316. 10.1016/j.matbio.2010.01.005
- ↵Kirchmaier BC, Poon KL, Schwerte T, Huisken J, Winkler C, Jungblut B, Stainier DY, Brand T. 2012. The Popeye domain containing 2 (popdc2) gene in zebrafish is required for heart and skeletal muscle development. Dev Biol 363: 438–450. 10.1016/j.ydbio.2012.01.015
- ↵Knight HG, Yelon D. 2016. Utilizing zebrafish to understand second heart field development. In Etiology and morphogenesis of congenital heart disease: from gene function and cellular interaction to morphology (ed. Nakanishi T, ), pp. 193–199. Springer, Tokyo. 10.1007/978-4-431-54628-3_25
- ↵Kotkamp K, Mössner R, Allen A, Onichtchouk D, Driever W. 2014. A Pou5f1/Oct4 dependent Klf2a, Klf2b, and Klf17 regulatory sub-network contributes to EVL and ectoderm development during zebrafish embryogenesis. Dev Biol 385: 433–447. 10.1016/j.ydbio.2013.10.025
- ↵Langfelder P, Horvath S. 2008. WGCNA: an R package for weighted correlation network analysis. BMC Bioinformatics 9: 559. 10.1186/1471-2105-9-559
- ↵Langmead B, Salzberg SL. 2012. Fast gapped-read alignment with Bowtie 2. Nat Methods 9: 357–359. 10.1038/nmeth.1923
- ↵Li H, Handsaker B, Wysoker A, Fennell T, Ruan J, Homer N, Marth G, Abecasis G, Durbin R; Genome Project Data Processing Subgroup. 2009. The Sequence Alignment/Map format and SAMtools. Bioinformatics 25: 2078–2079. 10.1093/bioinformatics/btp352
- ↵Liberatore CM, Searcy-Schrick RD, Yutzey KE. 2000. Ventricular expression of tbx5 inhibits normal heart chamber development. Dev Biol 223: 169–180. 10.1006/dbio.2000.9748
- ↵Lien CL, Wu C, Mercer B, Webb R, Richardson JA, Olson EN. 1999. Control of early cardiac-specific transcription of Nkx2-5 by a GATA-dependent enhancer. Development 126: 75–84.
- ↵Lopaschuk GD, Jaswal JS. 2010. Energy metabolic phenotype of the cardiomyocyte during development, differentiation, and postnatal maturation. J Cardiovasc Pharmacol 56: 130–140. 10.1097/FJC.0b013e3181e74a14
- ↵Lou X, Deshwar AR, Crump JG, Scott IC. 2011. Smarcd3b and Gata5 promote a cardiac progenitor fate in the zebrafish embryo. Development 138: 3113–3123. 10.1242/dev.064279
- ↵Loughran SJ, Kruse EA, Hacking DF, de Graaf CA, Hyland CD, Willson TA, Henley KJ, Ellis S, Voss AK, Metcalf D, 2008. The transcription factor Erg is essential for definitive hematopoiesis and the function of adult hematopoietic stem cells. Nat Immunol 9: 810–819. 10.1038/ni.1617
- ↵Marques SR, Yelon D. 2009. Differential requirement for BMP signaling in atrial and ventricular lineages establishes cardiac chamber proportionality. Dev Biol 328: 472–482. 10.1016/j.ydbio.2009.02.010
- ↵Miller SA, Huang AC, Miazgowicz MM, Brassil MM, Weinmann AS. 2008. Coordinated but physically separable interaction with H3K27-demethylase and H3K4-methyltransferase activities are required for T-box protein-mediated activation of developmental gene expression. Genes Dev 22: 2980–2993. 10.1101/gad.1689708
- ↵Molkentin JD, Antos C, Mercer B, Taigen T, Miano JM, Olson EN. 2000. Direct activation of a GATA6 cardiac enhancer by Nkx2.5: evidence for a reinforcing regulatory network of Nkx2.5 and GATA transcription factors in the developing heart. Dev Biol 217: 301–309. 10.1006/dbio.1999.9544
- ↵Montero JA, Giron B, Arrechedera H, Cheng YC, Scotting P, Chimal-Monroy J, Garcia-Porrero JA, Hurle JM. 2002. Expression of Sox8, Sox9 and Sox10 in the developing valves and autonomic nerves of the embryonic heart. Mech Dev 118: 199–202. 10.1016/S0925-4773(02)00249-6
- ↵Moskowitz IP, Wang J, Peterson MA, Pu WT, Mackinnon AC, Oxburgh L, Chu GC, Sarkar M, Berul C, Smoot L, 2011. Transcription factor genes Smad4 and Gata4 cooperatively regulate cardiac valve development. [Corrected]. Proc Natl Acad Sci 108: 4006–4011. 10.1073/pnas.1019025108
- ↵Nakano H, Liu X, Arshi A, Nakashima Y, van Handel B, Sasidharan R, Harmon AW, Shin JH, Schwartz RJ, Conway SJ, 2013. Haemogenic endocardium contributes to transient definitive haematopoiesis. Nat Commun 4: 1564. 10.1038/ncomms2569
- ↵Nemer M. 2008. Genetic insights into normal and abnormal heart development. Cardiovasc Pathol 17: 48–54. 10.1016/j.carpath.2007.06.005
- ↵Nimura K, Ura K, Shiratori H, Ikawa M, Okabe M, Schwartz RJ, Kaneda Y. 2009. A histone H3 lysine 36 trimethyltransferase links Nkx2-5 to Wolf–Hirschhorn syndrome. Nature 460: 287–291. 10.1038/nature08086
- ↵Olson TM, Michels VV, Thibodeau SN, Tai YS, Keating MT. 1998. Actin mutations in dilated cardiomyopathy, a heritable form of heart failure. Science 280: 750–752. 10.1126/science.280.5364.750
- ↵Paw BH, Davidson AJ, Zhou Y, Li R, Pratt SJ, Lee C, Trede NS, Brownlie A, Donovan A, Liao EC, 2003. Cell-specific mitotic defect and dyserythropoiesis associated with erythroid band 3 deficiency. Nat Genet 34: 59–64. 10.1038/ng1137
- ↵Pimanda JE, Ottersbach K, Knezevic K, Kinston S, Chan WY, Wilson NK, Landry JR, Wood AD, Kolb-Kokocinski A, Green AR, 2007. Gata2, Fli1, and Scl form a recursively wired gene-regulatory circuit during early hematopoietic development. Proc Natl Acad Sci 104: 17692–17697. 10.1073/pnas.0707045104
- ↵Piven OO, Winata CL. 2017. The canonical way to make a heart: β-catenin and plakoglobin in heart development and remodeling. Exp Biol Med 242: 1735–1745. 10.1177/1535370217732737
- ↵Polychronopoulos D, King JWD, Nash AJ, Tan G, Lenhard B. 2017. Conserved non-coding elements: developmental gene regulation meets genome organization. Nucleic Acids Res 45: 12611–12624. 10.1093/nar/gkx1074
- ↵Powers SE, Taniguchi K, Yen W, Melhuish TA, Shen J, Walsh CA, Sutherland AE, Wotton D. 2010. Tgif1 and Tgif2 regulate Nodal signaling and are required for gastrulation. Development 137: 249–259. 10.1242/dev.040782
- ↵Reiter JF, Alexander J, Rodaway A, Yelon D, Patient R, Holder N, Stainier DY. 1999. Gata5 is required for the development of the heart and endoderm in zebrafish. Genes Dev 13: 2983–2995. 10.1101/gad.13.22.2983
- ↵Sakabe NJ, Aneas I, Shen T, Shokri L, Park SY, Bulyk ML, Evans SM, Nobrega MA. 2012. Dual transcriptional activator and repressor roles of TBX20 regulate adult cardiac structure and function. Hum Mol Genet 21: 2194–2204. 10.1093/hmg/dds034
- ↵Schoenebeck JJ, Keegan BR, Yelon D. 2007. Vessel and blood specification override cardiac potential in anterior mesoderm. Dev Cell 13: 254–267. 10.1016/j.devcel.2007.05.012
- ↵Shih YH, Zhang Y, Ding Y, Ross CA, Li H, Olson TM, Xu X. 2015. Cardiac transcriptome and dilated cardiomyopathy genes in zebrafish. Circ Cardiovasc Genet 8: 261–269. 10.1161/CIRCGENETICS.114.000702
- ↵Shlyueva D, Stampfel G, Stark A. 2014. Transcriptional enhancers: from properties to genome-wide predictions. Nat Rev Genet 15: 272–286. 10.1038/nrg3682
- ↵Singh MK, Christoffels VM, Dias JM, Trowe MO, Petry M, Schuster-Gossler K, Burger A, Ericson J, Kispert A. 2005. Tbx20 is essential for cardiac chamber differentiation and repression of Tbx2. Development 132: 2697–2707. 10.1242/dev.01854
- ↵Singh MK, Li Y, Li S, Cobb RM, Zhou D, Lu MM, Epstein JA, Morrisey EE, Gruber PJ. 2010. Gata4 and Gata5 cooperatively regulate cardiac myocyte proliferation in mice. J Biol Chem 285: 1765–1772. 10.1074/jbc.M109.038539
- ↵Soza-Ried C, Hess I, Netuschil N, Schorpp M, Boehm T. 2010. Essential role of c-myb in definitive hematopoiesis is evolutionarily conserved. Proc Natl Acad Sci 107: 17304–17308. 10.1073/pnas.1004640107
- ↵Stainier DY. 2001. Zebrafish genetics and vertebrate heart formation. Nat Rev Genet 2: 39–48. 10.1038/35047564
- ↵Stainier DY, Fishman MC. 1994. The zebrafish as a model system to study cardiovascular development. Trends Cardiovasc Med 4: 207–212. 10.1016/1050-1738(94)90036-1
- ↵Stainier DY, Lee RK, Fishman MC. 1993. Cardiovascular development in the zebrafish. I. Myocardial fate map and heart tube formation. Development 119: 31–40.
- ↵Takeuchi JK, Lou X, Alexander JM, Sugizaki H, Delgado-Olguín P, Holloway AK, Mori AD, Wylie JN, Munson C, Zhu Y, 2011. Chromatin remodelling complex dosage modulates transcription factor function in heart development. Nat Commun 2: 187. 10.1038/ncomms1187
- ↵Targoff KL, Schell T, Yelon D. 2008. Nkx genes regulate heart tube extension and exert differential effects on ventricular and atrial cell number. Dev Biol 322: 314–321. 10.1016/j.ydbio.2008.07.037
- ↵Tripathi S, Pohl MO, Zhou Y, Rodriguez-Frandsen A, Wang G, Stein DA, Moulton HM, DeJesus P, Che J, Mulder LC, 2015. Meta- and orthogonal integration of influenza “OMICs” data defines a role for UBR4 in virus budding. Cell Host Microbe 18: 723–735. 10.1016/j.chom.2015.11.002
- ↵Turbendian HK, Gordillo M, Tsai SY, Lu J, Kang G, Liu TC, Tang A, Liu S, Fishman GI, Evans T. 2013. GATA factors efficiently direct cardiac fate from embryonic stem cells. Development 140: 1639–1644. 10.1242/dev.093260
- ↵Ueno S, Weidinger G, Osugi T, Kohn AD, Golob JL, Pabon L, Reinecke H, Moon RT, Murry CE. 2007. Biphasic role for Wnt/β-catenin signaling in cardiac specification in zebrafish and embryonic stem cells. Proc Natl Acad Sci 104: 9685–9690. 10.1073/pnas.0702859104
- ↵Wang B, Yan J, Peng Z, Wang J, Liu S, Xie X, Ma X. 2011. Teratocarcinoma-derived growth factor 1 (TDGF1) sequence variants in patients with congenital heart defect. Int J Cardiol 146: 225–227. 10.1016/j.ijcard.2009.08.046
- ↵Winata CL, Kondrychyn I, Kumar V, Srinivasan KG, Orlov Y, Ravishankar A, Prabhakar S, Stanton LW, Korzh V, Mathavan S. 2013. Genome wide analysis reveals Zic3 interaction with distal regulatory elements of stage specific developmental genes in zebrafish. PLoS Genet 9: e1003852. 10.1371/journal.pgen.1003852
- ↵Witzel HR, Jungblut B, Choe CP, Crump JG, Braun T, Dobreva G. 2012. The LIM protein Ajuba restricts the second heart field progenitor pool by regulating Isl1 activity. Dev Cell 23: 58–70. 10.1016/j.devcel.2012.06.005
- ↵Xu C, Liguori G, Persico MG, Adamson ED. 1999. Abrogation of the Cripto gene in mouse leads to failure of postgastrulation morphogenesis and lack of differentiation of cardiomyocytes. Development 126: 483–494.
- ↵Xu X, Meiler SE, Zhong TP, Mohideen M, Crossley DA, Burggren WW, Fishman MC. 2002. Cardiomyopathy in zebrafish due to mutation in an alternatively spliced exon of titin. Nat Genet 30: 205–209. 10.1038/ng816
- ↵Yelon D, Horne SA, Stainier DY. 1999. Restricted expression of cardiac myosin genes reveals regulated aspects of heart tube assembly in zebrafish. Dev Biol 214: 23–37. 10.1006/dbio.1999.9406
- ↵Yelon D, Ticho B, Halpern ME, Ruvinsky I, Ho RK, Silver LM, Stainier DY. 2000. The bHLH transcription factor Hand2 plays parallel roles in zebrafish heart and pectoral fin development. Development 127: 2573–2582.
- ↵Zamir L, Singh R, Nathan E, Patrick R, Yifa O, Yahalom-Ronen Y, Arraf AA, Schultheiss TM, Suo S, Han JJ, 2017. Nkx2.5 marks angioblasts that contribute to hemogenic endothelium of the endocardium and dorsal aorta. eLife 6: e20994. 10.7554/eLife.20994
- ↵Zhang Y, Liu T, Meyer CA, Eeckhoute J, Johnson DS, Bernstein BE, Nusbaum C, Myers RM, Brown M, Li W, 2008. Model-based Analysis of ChIP-Seq (MACS). Genome Biol 9: R137. 10.1186/gb-2008-9-9-r137