
Reprogramming of the human intestinal epigenome by surgical tissue transposition
- Fides D. Lay1,2,
- Timothy J. Triche Jr.3,4,
- Yvonne C. Tsai1,
- Sheng-Fang Su1,2,
- Sue Ellen Martin5,
- Siamak Daneshmand6,
- Eila C. Skinner7,
- Gangning Liang1,6,
- Yoshitomo Chihara8,9 and
- Peter A. Jones1,6,9
- 1Department of Biochemistry and Molecular Biology, Norris Comprehensive Cancer Center, Keck School of Medicine, University of Southern California, Los Angeles, California 90033, USA;
- 2Program in Genetic, Molecular and Cellular Biology, University of Southern California, Los Angeles, California 90033, USA;
- 3USC Epigenome Center, University of Southern California, Los Angeles, California 90033, USA;
- 4Department of Preventive Medicine, University of Southern California, Los Angeles, California 90033, USA;
- 5Department of Pathology, Norris Comprehensive Cancer Center, Keck School of Medicine, University of Southern California, Los Angeles, California 90033, USA;
- 6Department of Urology, Norris Comprehensive Cancer Center, Keck School of Medicine, University of Southern California, Los Angeles, California 90033, USA;
- 7Department of Urology, Stanford University Medical Center, Stanford, California 94305, USA;
- 8Department of Urology, Nara Medical University, Kashihara 634-8521, Japan
Abstract
Extracellular cues play critical roles in the establishment of the epigenome during development and may also contribute to epigenetic perturbations found in disease states. The direct role of the local tissue environment on the post-development human epigenome, however, remains unclear due to limitations in studies of human subjects. Here, we use an isogenic human ileal neobladder surgical model and compare global DNA methylation levels of intestinal epithelial cells pre- and post-neobladder construction using the Infinium HumanMethylation450 BeadChip. Our study is the first to quantify the effect of environmental cues on the human epigenome and show that the local tissue environment directly modulates DNA methylation patterns in normal differentiated cells in vivo. In the neobladder, the intestinal epithelial cells lose their tissue-specific epigenetic landscape in a time-dependent manner following the tissue’s exposure to a bladder environment. We find that de novo methylation of many intestine-specific enhancers occurs at the rate of 0.41% per month (P < 0.01, Pearson = 0.71), while demethylation of primarily non-intestine-specific transcribed regions occurs at the rate of −0.37% per month (P < 0.01, Pearson = −0.57). The dynamic resetting of the DNA methylome in the neobladder not only implicates local environmental cues in the shaping and maintenance of the epigenome but also illustrates an unexpected cross-talk between the epigenome and the cellular environment.
Epigenetic mechanisms, including DNA methylation, histone modifications, and nucleosome positioning, work cooperatively to regulate differential gene expression and act as regulators of cellular phenotype. DNA methylation, the most studied epigenetic mechanism, is the covalent addition of a methyl group to cytosines existing in the CpG dinucleotide context. This epigenetic modification is heritable through somatic cell division and has long been associated with transcriptional silencing when located at promoters. However, the emergence of genome-wide studies suggests that the role of DNA methylation may be dependent on its genomic context (Bird 2002; Jones 2012). In mammals, the most dramatic changes in global DNA methylation occur during embryonic development in a process known as epigenetic reprogramming (Cantone and Fisher 2013). The methylome of fully differentiated cells, however, is unique for each cell type and remarkably stable, whereby aberrant alterations are often associated with diseases such as cancer (Baylin and Jones 2011; Halley-Stott and Gurdon 2013).
Various local environmental factors are known to influence epigenetic programming during mammalian development and contribute to disease susceptibility (Jirtle and Skinner 2007; Feil and Fraga 2011; Gordon et al. 2012; Walker and Ho 2012; Zhu et al. 2013). The role of the local tissue environment in maintaining normal DNA methylation patterns, and subsequently the cellular phenotype of differentiated human cells, however, has remained elusive as studies in human subjects have mostly been limited to in vitro models and/or epidemiological observations where the extent of environmental exposure is often not precisely known (Feil and Fraga 2011; Rakyan et al. 2011; Cortessis et al. 2012; Mill and Heijmans 2013).
Here, we introduce a novel in vivo isogenic human neobladder model to examine the interaction between the local tissue environment and the epigenome of normal, differentiated cells. Construction of the orthotopic ileal neobladder is part of an existing standard of care for bladder cancer patients whose bladders have been completely removed. During the surgery, a 60- to 70-cm segment of the patient’s small intestine or ileum is reshaped into a bladder-like reservoir. The ureters are connected to this reservoir, which in turn is reconnected to the urethra to allow patients to urinate normally (Freeman et al. 1996; Stein et al. 2005; Hautmann et al. 2007). The autologous transposition of the small intestine to form a neobladder marks the precise time point when the tissue becomes exposed to a foreign bladder environment in which low intraluminal pH and various urinary solutes trigger patho-physiological changes in the otherwise normal intestinal mucosa (Philipson et al. 1987; Aragona et al. 1998; Gatti et al. 1999; Di Tonno et al. 2012). The neobladder, however, maintains the blood supply of the original tissue so that the predominant change of the local tissue environment is in the content of the lumen to which the intestinal cells are exposed. Subsequently, intestinal epithelial cells become exfoliated into the urine, allowing us to noninvasively collect them at various time points following surgery for global DNA methylation analyses. Using this model, we have the advantage of knowing the exact time and length of altered environmental exposure; thus we are able to directly quantify the effect of the local tissue environment on DNA methylation and show a dynamic interaction in which it directly shapes the human epigenome, particularly the enhancer regions, in a nondiseased state.
Results
Tissue-specific DNA methylation as markers of sample purity
Unlike urine sediments from individuals with normal urothelium, the neobladder urine specimens are highly cellular, often thick with mucus (Fig. 1A), and may be contaminated with white blood cells which are present in elevated numbers due to inflammation that occurs in patients in the early stage post-surgery (Philipson et al. 1987; Aragona et al. 1998). Mucus production and white blood cell count decrease substantially with time, but it remains important to exclude urine samples with substantial contamination in order to measure the correct population of cells in analyzing DNA methylation changes in the neobladder. In our study, we used tissue-specific DNA methylation loci as surrogate markers to confirm the identity of the cell population collected from the neobladder urine sediments (Houseman et al. 2012; Reinius et al. 2012). We have previously generated Infinium HumanMethylation27 data for normal blood, small intestine, and bladder, from which we identified inflammatory cell-specific probes which are specifically unmethylated in white blood cells and methylated in normal small intestine and urothelium (Supplemental Fig. 1A). We chose the markers KLHL6, LAPTM5, and LPXN, which have high sensitivity and specificity, to distinguish between normal white blood cells and small intestine (Supplemental Fig. 1B–G), and subsequently assayed DNA methylation levels of these loci in the neobladder using pyrosequencing (Supplemental Table 1). Low methylation levels at these loci in the neobladder samples indicate the enrichment of inflammatory cells in the urine sediments, and these samples were subsequently excluded from further analysis (Fig. 1B; Supplemental Fig. 1H,I).
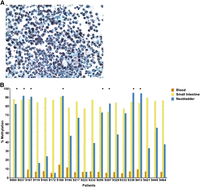
Inflammatory cell-specific DNA methylation markers as surrogate markers of neobladder sample purity. (A) Urine sediment collected from a neobladder patient is highly cellular and often thick with mucus due to the presence of mucus-producing goblet cells. Inflammatory cells may also contaminate the urine samples due to increased inflammation in patients immediately after surgery. Mucus production and white blood cell count, however, decrease over time. (B) Methylation level of KLHL6, a blood-specific gene, is measured in all matched samples using pyrosequencing. KLHL6 is hypomethylated in all blood samples (7.57 ± 2.45%) and highly methylated in the normal small intestine (83.09 ± 8.01%). Hypermethylation of this marker in the neobladder indicates enrichment for intestinal epithelial cells, while low or intermediate methylation indicates a significant presence of an inflammatory cell population. (*) Neobladder samples that passed the quality-control threshold, which is a methylation level within 10% of the matched small intestine. For downstream analysis, HM450 data were generated for neobladder samples that are enriched for intestinal cells as indicated by the high methylation level in at least two of the three inflammatory cell markers (see Supplemental Fig. 1 and Supplemental Table 2).
For neobladder samples that were enriched for intestinal cells, we performed an additional filter at the global level. We expanded the panel of three locus-specific markers using the Infinium HumanMethylation450 (HM450) platform, from which we identified a cluster of 2995 probes that are specifically unmethylated in blood and methylated in the small intestine and bladder (Supplemental Fig. 1J). We calculated the average beta value of this cluster of probes for each sample including the neobladder (Supplemental Fig. 1K). Neobladder samples whose average beta value is above one standard deviation of the average small intestine beta value were excluded from downstream analysis to reduce noise and confounders from residual heterogeneity previously undetected by pyrosequencing (Supplemental Material; Supplemental Table 2).
DNA methylation changes occur in the neobladder
Analysis of matched blood, small intestine, and neobladder samples collected from five patients within the first year post-surgery shows a high degree of correlation between the neobladder and their respective matched small intestine, further confirming the enrichment of intestinal epithelial cells in the neobladder (Supplemental Fig. 2A). We also observed a low-level increase in methylation for the majority of probes that are differentially methylated in the neobladder 1 yr post-surgery (Supplemental Fig. 2B). We confirmed this change in methylation by performing bisulfite sequencing of the individual-specific VTRNA2-1 locus on the matched samples (Supplemental Fig. 2C,D). This locus may be monoallelically methylated (Supplemental Fig. 2C) or unmethylated (Supplemental Fig. 2D) across various tissues of different individuals but never fully methylated (Treppendahl et al. 2012). The increase of methylation in this locus thus appears to be an effect of the drastic changes in the local tissue environment of the intestinal epithelial cells in the neobladder, rather than an artifact of sample heterogeneity.
Time-dependent de novo DNA methylation of small intestine-specific probes
After confirming that DNA methylation changes may occur in the neobladder, we expanded our analysis to include samples collected up to 5 yr post-surgery which may or may not be matched with normal tissue controls. Global analysis of all probes shows that samples across different individuals cluster together based on their cell type, suggesting that variation between tissues is greater than variation between individuals (Fig. 2A; Supplemental Fig. 2A). Although the neobladder samples cluster on the same side as the normal small intestines, they appear to form distinct groups (Fig. 2B) and exhibit a time-dependent effect in which neobladder samples from earlier time points cluster closer to the normal small intestine compared to samples from later time points (Supplemental Fig. 3A).
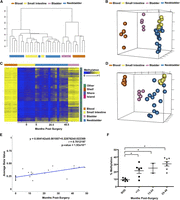
DNA methylation changes in the neobladder is a dynamic process. (A) Dendrogram of hierarchical clustering performed on a single Euclidean distance for normal blood, small intestine, bladder, and neobladder samples shows the relationship between each tissue type. Neobladder samples cluster closer to the small intestine than to the control bladder and blood. (B) Nonmetric multidimensional scaling (MDS) plot using all HM450 probes for all samples shows distinct separation between normal small intestine, blood, and bladder (Kruskal’s stress = 0.0334). Each axis represents one dimension. Although the neobladder samples cluster closer to the small intestine control, many have diverged away, suggesting alterations in DNA methylation of intestinal epithelial cells post-surgery. (C) A heat map showing intestine-specific unmethylated probes that have significant (Benjamini-Hochberg adjusted P-value < 0.05) linear regression value (n = 4162). Neobladder samples are arranged from the earliest to the latest time points post-surgery (0–48.5 mo) and show increased methylation over time. (D) Nonmetric MDS plot using the cluster of probes that gain methylation in the neobladder illustrates the distinctiveness of neobladder samples from each other in comparison to the normal tissue controls that cluster tightly together based on their respective cell type (Kruskal’s stress = 0.0098). (E) The rate of de novo methylation in the neobladder was measured for individual probes and as an average of the cluster shown in C, and Pearson’s correlation (r) was calculated to show that changes in DNA methylation in the neobladder are time dependent. Time 0 refers to normal small intestine tissues collected before being transplanted into a bladder environment. (F) Pyrosequencing of REG4, an intestine-specific gene, validates the global finding that there is a significant time-dependent methylation increase of intestine-specific unmethylated probes in the neobladder. T-test was performed. (*) P-value < 0.05.
To further characterize the methylation changes in the neobladder, we calculated the variance across all samples and hierarchically clustered the most variable probes. We found a significant increase of methylation in the neobladder in the cluster of probes that were specifically unmethylated in the small intestine (Supplemental Fig. 3B,C). Most of these altered intestine-specific probes are located in non-CpG islands, including CpG shores and shelves, consistent with the more dynamic and tissue-specific behavior of non-CpG island methylation (Jones 2012). Interestingly, a smaller subset of intestine-specific unmethylated probes did not show any changes, and we also did not detect significant reciprocal demethylation of probes that were specifically methylated in the small intestine, many of which are located in CpG islands (Supplemental Fig. 3B).
We fitted each probe in the intestine-specific cluster into a linear regression model and found 4162 probes to have a significant linear relationship with time post-surgery, despite two individuals exhibiting minimal or no increase in DNA methylation at 16 and 36 mo post-surgery, respectively (Fig. 2C). We further observed an increased dissimilarity in the neobladder samples in which each neobladder sample appeared to gain its own unique DNA methylation pattern, distinct from the normal small intestine and other neobladders (Fig. 2D), which cannot be attributed to cellular heterogeneity in the neobladder samples (Supplemental Fig. 4A–C; Supplemental Material). Interestingly, despite the gain of methylation, the methylation patterns of the neobladders do not a show a shift toward normal bladders (Fig. 2D).
As a cluster, the gain of methylation in probes specifically unmethylated in the intestine occurred at the average rate of 0.41% per month, or ∼5% per year post-surgery (Fig. 2D). This association with time holds true for many of the probes even when excluding normal small intestines from the linear regression model (Supplemental Fig. 3D). We confirmed the overall trend of increased methylation in the neobladder by performing pyrosequencing of intestine-specific, unmethylated loci (Fig. 2E; Supplemental Fig. 3E). Bisulfite sequencing further revealed that the gain of methylation in the neobladder is not limited to specific CpG sites but rather occurred in a widespread manner in broader genomic regions (Supplemental Figs. 2C,D, 3F).
Time-dependent DNA demethylation of non-intestine-specific probes
DNA methylation changes in the neobladder are not limited to tissue-specific probes. We identified a subset of non-CpG island probes that were methylated across all the normal tissues and exhibited a trend of demethylation in the neobladder. We fitted a linear regression model for each probe within the cluster and identified 748 probes as having significant time-dependent demethylation (Fig. 3A; Supplemental Fig. 5A). We also examined the similarity between the normal tissue controls and the neobladders using this group of demethylated probes and found that the methylomes of the neobladders are shifted in a heterogeneous fashion away from the normal small intestine as well as the blood and bladder controls (Fig. 3B). Unlike the normal tissues that exhibit a high similarity within each tissue type, the neobladder exhibits a higher variation in methylation between each sample in these non-tissue-specific probes.
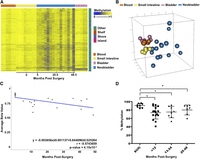
Loss of DNA methylation in the neobladder occurs dynamically on non-tissue-specific CpG sites. (A) A heat map showing a subset of probes (n = 748) that is methylated across all normal tissue and exhibits a significant trend of demethylation over time in the neobladder (Benjamini-Hochberg adjusted P-value < 0.05). (B) Nonmetric MDS using demethylated probes shows increased variation between the neobladder samples. (C) Linear regression analysis shows that demethylation in the neobladder is also time dependent and occurs at a rate comparable to de novo methylation in intestine-specific probes. (D) Demethylation of TJP2 is validated using pyrosequencing. T-test was performed. (*) P-value < 0.05.
As a cluster, loss of methylation occurs at the rate of 0.37% per month, or ∼4.4% per year (Fig. 3C). We validated this global trend of demethylation at the locus-specific level by pyrosequencing (Fig. 3D; Supplemental Fig. 5B,C). The trend of demethylation of non-intestine-specific probes is not as dramatic as the increased methylation of intestine-specific probes; however, the rate of methylation changes in the neobladder remains much more dramatic than the rate of methylation changes previously attributed to tissue-specific aging (Ahuja et al. 1998; Christensen et al. 2009; Heyn et al. 2012; Hannum et al. 2013). We measured the average rate of methylation changes in age-associated probes in normal colon using publicly available TCGA data (The Cancer Genome Atlas Network 2012) and found that it is roughly 15-fold lower compared to the rate of methylation changes in the neobladder (Supplemental Fig. 6A,B; Supplemental Material). Moreover, we found very minimal overlap between probes that are associated with aging and probes that are changing in the neobladder (Supplemental Fig. 6C,D), further suggesting that changes in the local tissue environment, rather than aging, directly alter the methylome of normal differentiated cells.
DNA methylation changes in the neobladder are a surrogate for detecting alterations in distinct chromatin states
DNA methylation works in concert with other epigenetic mechanisms to define the human epigenome. To place DNA methylation changes in the context of the broader epigenetic landscape, we used publicly available ChIP-seq data of active and repressive histone marks to characterize the chromatin configurations present in the small intestine using the chromHMM model (Ernst et al. 2011). We generated a 20-chromatin-state emission model and calculated the enrichment and segmentation of each chromatin state in various genomic elements in the small intestine to further annotate each chromatin state and subsequently collapsed the model into a 10-state model covering promoter, enhancer, transcribed and repressed regions (Fig. 4A; Supplemental Fig. 7A–C). For example, the heterochromatic or quiescent state is enriched in the genome overall, whereas the active promoter state is enriched around the transcription start sites, as expected (Supplemental Fig. 7A–C).
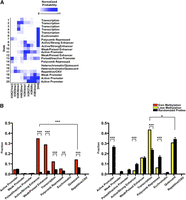
Alteration of the epigenetic landscape in the neobladder occurs predominantly in the enhancers and transcribed regions. (A) Chromatin states for the normal small intestine are defined based on a 20-states chromHMM model using publicly available data, and underlying chromatin states were determined for each CpG probe. Color scale measures the normalized probability of finding a specific histone mark in a particular chromatin state, and each state is annotated based on the levels of enrichment of each histone mark. (B) Chromatin states were collapsed into 10 distinct states as plotted on the x-axis. A cluster of 4162 probes that gain methylation (left panel) and a cluster of 748 probes that lose methylation (right panel) were compared to randomized sets of an equal number of loci where 1000 trials were performed, and the P-value was determined using a binomial test. ([***] P < 2.2 × 10⁻¹⁶, [**] P < 3.3 × 10⁻¹³). The enhancer states are significantly enriched in the cluster of probes that gains methylation, whereas the cluster of probes that loses methylation predominantly falls in the transcribed regions.
We then correlated each methylation probe with the underlying chromatin states of the small intestine and calculated the distribution of each chromatin state (Supplemental Fig. 7D,E). We found that in the cluster of probes that gain methylation, there was a significant enrichment of the enhancer state, where >50% of the probes fall in the active and weak enhancer regions, with the remaining probes in the cluster distributed across the heterochromatic/quiescent state, transcribed regions, the polycomb repressed state, and to a lesser extent, the promoter regions. (Fig. 4B, left panel; Supplemental Fig. 7E). The enrichment of the enhancer regions is specific to the small intestine because the same group of probes exhibits a different chromatin state distribution in the normal bladder (Supplemental Fig. 7F). These enhancer regions also have a low methylation average in the normal small intestine (0.15 ± 0.071 to 0.26 ± 0.081), consistent with what is known about enhancers having low-methylated regions or LMRs (Stadler et al. 2011). We performed gene ontology analysis of the closest gene to these enhancers using DAVID and found that the enhancer category is enriched for genes that are specifically expressed in the small intestine and may regulate biological functions which include metabolism and actin cytoskeleton organization (Supplemental Table 3).
In the cluster of probes that becomes demethylated, we observed a significant enrichment of transcribed regions where >40% of the probes fall in this category (Fig. 4B, right panel). Unlike the enhancers, these regions are not specific to the intestine because the majority of these probes also fall in the transcribed region in the normal bladder control (Supplemental Fig. 7F). Predictably, this group of probes is significantly depleted of active promoter and enhancer regions because DNA methylation is anticorrelated with active chromatin states (Thurman et al. 2012). We further measured the rate of methylation change for each chromatin state to determine whether a particular chromatin configuration drove the average rate of change in each cluster and found that it was not the case (Supplemental Fig. 4G,H). This suggests that the epigenetic changes in the neobladder may occur in a tightly controlled manner on distinct genomic regions, leading to the loss of small intestine characteristics in the neobladder.
Discussion
The interplay between environmental cues and epigenetic changes has been described at length in the context of cellular development and/or pathogenesis, yet not much is known about the role of the tissue environment in maintaining the epigenome of normal somatic cells (Feil and Fraga 2011; Zhu et al. 2013). This is partly because most human studies have been largely limited either to epidemiological approaches, where exposure time is often unknown, or in vitro systems, which, while useful, do not always recapitulate in vivo conditions (Wilson and Jones 1983; Christensen et al. 2009; Cortessis et al. 2012; Mill and Heijmans 2013; Zhu et al. 2013). Our study using the human ileal neobladder is the first model that attempts to characterize and quantify the dynamic interaction between the local tissue environment and the epigenetics in vivo.
The epigenome of fully differentiated cells has long been thought to be stable and less easily perturbed by environmental cues than during mammalian development (Feil and Fraga 2011; Halley-Stott and Gurdon 2013). In fact, one of the hallmarks of DNA methylation is its faithful inheritance mediated by DNA methyltransferases in somatic cells (Jones and Liang 2009). Our results add another layer to the currently accepted model of somatic inheritance of DNA methylation in that the fidelity of the process requires precise signals from the local tissue environment. In the neobladder model, the autologous transposition of the intestinal epithelium means the cells would receive drastically different signals from the aseptic bladder environment compared to the intestinal tissue environment that normally includes a complex microbiome (Philipson et al. 1987; Wullt et al. 2004). Following the tissue transposition, we observe a widespread alteration in the methylome of the otherwise normal intestinal epithelium which cannot be attributed to the natural aging process alone, because at the rate of 4%–5% per year, the changes in the neobladder are more dramatic than the cumulative changes previously seen in aging (Ahuja et al. 1998; Heyn et al. 2012; Hannum et al. 2013). The changes we see in the neobladder are also more dynamic and extensive compared to the focal hypomethylation observed during differentiation of the LGR5+ intestinal stem cells into the specialized epithelial cells (Kaaij et al. 2013). Thus, it is unlikely that the changes we see in the neobladder are a result of overproliferation in the intestinal stem cells. Taken together, our study presents the first evidence that signals from the local tissue environment may be required to ensure epigenetic maintenance in somatic cells.
The increase of DNA methylation in CpG sites located in the enhancer regions is particularly striking because enhancer activity is known to be anticorrelated with DNA methylation and is highly cell type-specific (Heintzman et al. 2009; Stadler et al. 2011; Bonn et al. 2012). We have also previously shown that repressed genes may have permissive enhancers that can initiate cell-fate reprogramming in fibroblasts (Taberlay et al. 2011), but what we observe in the intestinal epithelium illustrates another side in the complex regulation of cell identity. The methylation of these intestine-specific enhancers suggests that in a bladder environment, where the intestine serves as a urinary storage instead of as a digestive organ, the intestinal epithelium gradually loses its uniquely small-intestine epigenetic landscape presumably because the epithelium no longer receives the necessary signals to maintain the enhancers in a permissive state. The idea that the epigenome mediates how genomic DNA is translated into various phenotypes is well-established, but the loss of the intestinal landscape over time in the neobladder in a “use-it-or-lose-it” manner implies that functionality may also conversely dictate how the epigenome is shaped.
The requirement for the epigenome to adapt and maintain normal cellular function is only one element in the complex interaction between DNA methylation and the local tissue environment. One would expect a gain of urothelium-like methylome in the neobladder to support the new function of the intestinal epithelial cells as an alternative bladder, but we did not see such changes. Instead, we observed demethylation of non-intestine-specific probes in the transcribed region that are highly methylated across all of the normal tissues we analyzed. Methylation of transcribed or gene body regions has been positively correlated with expression level and as such may be used as surrogate markers for transcription level (Jones 1999; Hellman and Chess 2007). Demethylation of loci that are transcribed in both normal small intestine and bladder suggests the down-regulation of non-tissue-specific genes. Taken together, these changes describe a phenomenon in which the neobladder undergoes dynamic reprogramming to adopt its own unique epigenetic signature as a response to the physiological stress triggered by the drastic tissue environmental changes.
It is widely accepted that environmental agents may reprogram the epigenome to alter gene expression and promote tumorigenesis (Walker and Ho 2012). The neobladder, however, shows a surprising degree of epigenetic plasticity and adaptability, suggesting that drastic alteration of the environment may initiate in vivo reprogramming of differentiated cells. Distinct chromatin states appear to be gaining and losing methylation at similar rates overall, 0.41 ± 0.1% and 0.37 ± 0.1% per month, respectively. This comparable rate of change suggests that alterations of the methylome in normal somatic cells may occur in a controlled process to maintain equilibrium. This is in contrast to aberrant changes often seen in diseases such as cancer, where genome-wide hypomethylation is accompanied by focal hypermethylation of CpG islands (Baylin and Jones 2011; Berman et al. 2012).
Additional studies will be needed to better understand the mechanism of somatic maintenance as well as the specific environmental cues required for the process. For instance, we do not yet know the sequence of events during the loss of intestinal enhancers in the neobladder, in that it is unclear whether DNA methylation drives the loss of the active enhancer state or is a consequence of reduced function. Furthermore, we speculate that inflammation may also play a role in epigenetic changes seen in the neobladder, although the mechanism by which inflammation mediates or alters somatic DNA methylation maintenance is not fully understood (Maekita et al. 2006).
Overall, our results show that the neobladder is a valuable model for studying the complex cross-talk between the local tissue environment and the epigenome in vivo. This model allows us to precisely quantify the effect of the local tissue environment on the epigenome and to elucidate the susceptibility of tissue-specific enhancers to epigenetic reprogramming. Altogether, the widespread changes in the neobladder also illustrate the critical role that local environmental factors play in epigenetic maintenance.
Methods
Patient sample collection and ethics statement
All tissue and urine samples were collected from patients >50 yr old in accordance with institutional guidelines. For neobladder patients from whom we were able to collect at least one neobladder urine follow-up, we also collected their matched peripheral blood and/or small intestine sample before surgery. A normal bladder or urothelium sample was collected from patients undergoing radical prostatectomy for prostate cancer and without indications of bladder cancer or related diseases.
Sample preparation and loci-specific methylation analysis
All tissue samples were examined by pathologists and processed immediately upon collection. Fresh, uncultured small intestine tissue was cut longitudinally and washed with ice cold PBS twice. The tissue was cleaned of excess fat and residual fecal matter, dissected into 1-cm cubes, and subsequently incubated in HBSS/30 mM EDTA solution at 37°C for 30 min with gentle rotation to detach the epithelial layers (Supplemental Fig. 8A–C). This EDTA treatment mimicked the physiological shedding of intestinal epithelial cells in the neobladder, allowing us to collect a pure population of intestinal epithelial cells and measure the same cell population pre- and post-surgery. Normal urothelium control was isolated by microdissection of hematoxylin and eosin (H&E)-stained tissue. Urine sediments from the neobladder patients were centrifuged for 10 min at 1300 rpm, and DNA was extracted from the cell pellet using a standard phenol-choloroform method.
To detect the DNA methylation level, 1 μg of genomic DNA was bisulfite-converted using the Zymo EZ Methylation kit according to the manufacturer’s instructions and used for pyrosequencing, bisulfite sequencing, and/or DNA methylation array. Briefly, bisulfite-converted DNA was PCR-amplified using a biotin-labeled 3′ primer and purified using Streptavidin-Sepharose beads. Pyrosequencing was performed using the PSQ HS96 System, and the DNA methylation level was expressed for each locus as a percentage of methylated cytosines over the sum of methylated and unmethylated cytosines. For bisulfite sequencing, bisulfite PCR fragments were cloned using the TOPO TA cloning kit, and individual colonies were screened for the insert and sequenced. All primers used in this study are listed in Supplemental Table 4.
Global DNA methylation analysis
DNA methylation of more than 450,000 CpG sites was measured using the Infinium HumanMethylation450 BeadChip (Illumina) according to the manufacturer’s protocol (Bibikova et al. 2011; Sandoval et al. 2011). Details on patient samples used for the analysis can be found in the Supplemental Material and Supplemental Table 2. Preprocessing of the array was performed using the methylumi package available through Bioconductor and as previously described (Davis et al. 2012; Triche et al. 2013). We excluded samples that had a mean detection P-value > 0.05 across all probes and performed background correction and dye-bias equalization. The methylation level of each CpG locus is expressed in terms of a beta value of 0–1.0, signifying percent methylation of 0%–100%. At the probe level, we excluded probes on the X and Y chromosomes as well as probes that contain SNPs and/or repetitive elements on the target CpG to avoid bias in our analysis. We also removed probes containing missing data in one or more samples. After filtering, 410,808 probes and 34 samples including 15 neobladder samples were available for downstream analyses. All statistical and clustering analyses were performed on R using Bioconductor packages. For more details, see Supplemental Material.
Chromatin-state discovery and segmentation
Chromatin-state calling and segmentation were performed as previously described using publicly available ChIP-seq data from the Roadmap Epigenomics Project (Ernst et al. 2011; Ernst and Kellis 2012). Briefly, the hidden Markov model (HMM) was applied to the following histone marks for small intestine to generate a 20-state model: H3K27Ac, H3K4me3, H3K36me3, H3K4me1, H327me3, H3K9me3, and Input (Series# GSE16256, The Human Epigenome Atlas Release 8). We used this model to annotate and define 10 global chromatin states. Annotations of genomic regions were obtained through the UCSC Genome Browser. Segmentation of the chromatin states is included in Supplemental Table 5.
Data access
Methylation array data have been submitted to the NCBI Gene Expression Omnibus (GEO; http://www.ncbi.nlm.nih.gov/geo/) under accession number GSE50475.
Acknowledgments
We thank Dr. Terry Kelly, Dr. Jessica Charlet, and Nathalie Paucar for a critical reading of the manuscript, and Dr. Kim Siegmund for helpful discussions. We thank Moli Chen at the Norris Cancer Center Tissue Procurement Facility for assistance in sample collection and Dr. Dan Weisenberger at the USC Epigenome Center for assistance in generating the methylation array data. We thank Dr. Bing Ren at UCSD Ludwig Institute for Cancer Research for generously allowing us to use the small intestine ChIP-seq data. F.D.L. is partially funded by an NIH T32 CBM Training Grant. This work is funded by NIH R01CA083867 to P.A.J.
Author contributions: F.D.L., Y.C., G.L., and P.A.J. conceived the study. All authors made substantial contributions in data acquisitions. F.D.L., T.J.T., G.L., and P.A.J. analyzed and interpreted data and were involved in the manuscript preparation.
Footnotes
-
↵9 Corresponding authors
E-mail pjones{at}med.usc.edu
E-mail yychihara{at}gmail.com
-
[Supplemental material is available for this article.]
-
Article published online before print. Article, supplemental material, and publication date are at http://www.genome.org/cgi/doi/10.1101/gr.166439.113.
- Received September 9, 2013.
- Accepted February 6, 2014.
This article is distributed exclusively by Cold Spring Harbor Laboratory Press for the first six months after the full-issue publication date (see http://genome.cshlp.org/site/misc/terms.xhtml). After six months, it is available under a Creative Commons License (Attribution-NonCommercial 3.0 Unported), as described at http://creativecommons.org/licenses/by-nc/3.0/.


