
High nucleosome occupancy is encoded at X-linked gene promoters in C. elegans
- Sevinç Ercan1,2,5,6,
- Yaniv Lubling3,5,
- Eran Segal3,4,6 and
- Jason D. Lieb1,2
- 1 Department of Biology, Carolina Center for the Genome Sciences, University of North Carolina, Chapel Hill, North Carolina 27599-3280, USA;
- 2 Lineberger Comprehensive Cancer Center, University of North Carolina, Chapel Hill, North Carolina 27599-3280, USA;
- 3 Department of Computer Science and Applied Mathematics, Weizmann Institute of Science, Rehovot 76100, Israel;
- 4 Department of Molecular Cell Biology, Weizmann Institute of Science, Rehovot 76100, Israel
-
↵5 These authors contributed equally to this work.
Abstract
We mapped nucleosome occupancy by paired-end Illumina sequencing in C. elegans embryonic cells, adult somatic cells, and a mix of adult somatic and germ cells. In all three samples, the nucleosome occupancy of gene promoters on the X chromosome differed from autosomal promoters. While both X and autosomal promoters exhibit a typical nucleosome-depleted region upstream of transcript start sites and a well-positioned +1 nucleosome, X-linked gene promoters on average exhibit higher nucleosome occupancy relative to autosomal promoters. We show that the difference between X and autosomes does not depend on the somatic dosage compensation machinery. Instead, the chromatin difference at promoters is partly encoded by DNA sequence, because a model trained on nucleosome sequence preferences from S. cerevisiae in vitro data recapitulate nearly completely the experimentally observed difference between X and autosomal promoters. The model predictions also correlate very well with experimentally determined occupancy values genome-wide. The nucleosome occupancy differences observed on X promoters may bear on mechanisms of X chromosome dosage compensation in the soma, and chromosome-wide repression of X in the germline.
Eukaryotic genomes are packaged by nucleosomes, which consist of ∼147 bp DNA wrapped around an octamer of histone proteins H2A, H2B, H3, and H4 (Luger et al. 1997). DNA sequence, chromatin remodelers, transcription factors, and structural proteins such as linker histones affect nucleosome locations, and likewise nucleosome positions can affect the binding of regulatory proteins such as transcription factors. Determining nucleosome occupancy across the genome is required to understand the relation between nucleosomes and underlying cellular processes such as transcription.
Many of the techniques that map nucleosomes rely on preferential digestion of linker DNA by the micrococcal nuclease (MNase) (Clark 2010). Microarray analysis or direct sequencing of MNase-generated mononucleosomal DNA (MNase-seq) provides a high-resolution measure of nucleosome occupancy across the genome. Using MNase-seq, a previous study mapped nucleosomes in C. elegans using a mixture of all stages of the life cycle (Valouev et al. 2008). The C. elegans life cycle is highly dynamic, consisting of the embryo, four larval stages, and adult, which contains a rapidly proliferating germline that constitutes approximately half of all adult nuclei. Another study in C. elegans used embryonic extracts and a biotinylation tagging system to examine nucleosome occupancy in different chromatin fractions by microarray analysis (Ooi et al. 2010). These data reflect enrichment or depletion of nucleosome occupancy in different chromatin fractions relative to whole-genome chromatin.
Our study builds on these previous nucleosome mapping efforts by separating two stages of the life cycle (embryos and adults), and by further separating the somatic and germ cells of the adult stage by using two mutant strains. The first mutant (glp-1) produces germlineless adults, in which almost all cells are fully differentiated somatic cells. The second mutant (fem-2) produces animals with a feminized germline that cannot produce sperm, and are therefore incapable of producing embryos. These mutant animals provide a mixture of somatic cells and a fully developed germline.
In C. elegans, the X chromosome is subjected to two different chromosome-wide transcriptional repression mechanisms. The first involves transcriptional silencing of the X chromosome in the germline during meiosis (Kelly and Aramayo 2007). The second involves somatic dosage compensation, in which the transcription from both of the X chromosomes in XX hermaphrodites is halved to match the transcriptional output from the single X in males (Ercan and Lieb 2009). This reduction is mediated by the dosage compensation complex, which binds to active gene promoters on the X chromosome (Ercan et al. 2007, 2009; Jans et al. 2009). Here, we focus on nucleosome occupancy differences between the X chromosome and autosomes.
We found that in both embryos and adults, C. elegans X chromosome promoters exhibit higher measured nucleosome occupancy than the promoters of autosomal genes. This is partly dependent on DNA sequence, because GC content, which correlates with higher nucleosome occupancy, is also higher at the X promoters. A model trained on in vitro nucleosome preferences of yeast DNA correlates well with in vivo nucleosome occupancy in C. elegans. The higher nucleosome occupancy on the promoters of X-linked genes may relate to mechanisms that regulate X chromosome transcription in soma and germline.
Results
Data generation and processing
We prepared chromatin from three distinct C. elegans populations. First, to sample nucleosome occupancy during development, we used wild-type embryos. Second, to examine nucleosome occupancy in mature somatic cells, we prepared extract from glp-1(q224) adults, which lack a germline. We refer to these animals as “germlineless adults” throughout the manuscript. Finally, to examine chromatin organization in a mixture of purely adult somatic and germ cells, we used fem-2(b245) adults, which contain a germline but cannot produce embryos due to defects in sperm production. These animals are referred to as “germline-containing adults” from this point on. We digested chromatin with increasing concentrations of MNase, and purified mononucleosomal DNA by gel electrophoresis (Supplemental Fig. 1A).
Three lanes of paired-end Illumina GAIIx sequencing were performed for each of two independent replicates. We obtained ∼40 million pairs of reads per replicate, and aligned the reads to C. elegans WS170 (ce4) genome (see Methods). For each sample, the majority (50%–80%) of the sequenced fragments were between 130 and 160 bp in length (Supplemental Fig. 1B), consistent with the nucleosome core particle length of ∼147 bp. The presence of fragments shorter and longer than 147 bp may result from both differential accessibility of the genome to MNase and the presence of variant nucleosomes that stably wrap differing lengths of DNA. The distributions of autosomal and X chromosome fragment lengths were nearly identical (Supplemental Fig. 1C), and using only those fragments that are longer than 146 bp recapitulates our main result (Supplemental Fig. 1D).
To prevent inaccuracies in measured nucleosome occupancy caused by differences in mappability, we excluded any region of the genome within 147 bp of a read that maps to multiple locations. This filtering step resulted in a final count of 17–27 million unique read pairs per replicate (Supplemental Table 1). The paired reads were joined, and the number of reads that cover each coordinate was normalized by log2 transforming the ratio of reads at a given base to the average genome coverage. The two replicates of each data set correlated well with each other (correlation coefficients for embryo 0.91, germlineless adults 0.90, and germline-containing adults 0.96). Therefore, we averaged the base coverage ratios from the replicates and used this track as a measure of nucleosome occupancy (data from each replicate and the average are shown for two loci in Supplemental Fig. 2).
The nucleosome occupancy of X chromosome promoters is higher than that of autosomes, as measured by micrococcal nuclease digestion
For each of the six C. elegans chromosomes, we aligned all genes by their annotated transcript start sites, and plotted the average nucleosome occupancy. The most striking feature of these plots was increased nucleosome occupancy in X-linked gene promoters relative to the autosomal gene promoters (highlighted with an arrow in Fig. 1A). This difference was specific to the region near the transcript start site. Increased nucleosome occupancy was not a general feature of the X chromosome, because no such difference was apparent when the data were aligned using other genomic features, including the annotated transcript stop sites (Fig. 1B).
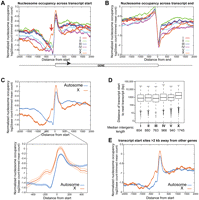
Higher nucleosome occupancy on X promoters. Normalized embryo nucleosome occupancy per base pair was averaged across all transcripts, and plotted across the transcript start (A) and end (B) for each chromosome. A schematic representation of a gene is shown below the panels, and the red arrow in panel A indicates the higher nucleosome occupancy on the X promoters. (C) The same as A, but the data from autosomes are collapsed. The lower panel zooms to the 1-kb region around the transcript start. The lighter shades of each line represent two standard errors from the mean. (D) The distance between each transcript start to the nearest upstream transcript is plotted for each chromosome. Median length is reported below. (E) Same as A, but for only genes whose transcript starts are more than 2 kb away from other genes are used. This consisted of 5084 autosomal and 1480 X chromosome transcripts.
Focusing on the 5′ region and collapsing all of the results from autosomes into a single plot reveals that the higher nucleosome occupancy occurs mostly at the promoter region, and to smaller extent at the nucleosome just downstream from the transcript start site (Fig. 1C). The difference in nucleosome occupancy between X and autosomes was also observed in adult somatic cells, and in animals containing both somatic and germ cells (Supplemental Fig. 3A,B). We confirmed the increased nucleosome occupancy that we observed on X by reanalysis of data from a previous study that used Applied Biosystems (Life Technologies) SOLiD System sequencing to profile nucleosome occupancy in mixed stage animals (Supplemental Fig. 3C; Valouev et al. 2008).
Genes on the X chromosome are separated by longer intervals than autosomal genes (Fig. 1D), and neighboring genes can influence the nucleosome occupancy profiles of genes that are closely positioned (Supplemental Fig. 3D). Therefore, we tested whether the shorter intergenic regions on autosomes might somehow be driving the difference in nucleosome occupancy we observed near transcript start sites. We did this by considering only genes on X and autosomes with an upstream intergenic region larger than 2 kb. Using this set of promoters, the nucleosome occupancy difference between X and autosomal promoters persisted (Fig. 1E). Importantly, the apparent nucleosome occupancy differences at regions greater than 500 bp upstream of the transcript start sites disappeared, suggesting that these were caused by neighboring genes.
The differences in measured nucleosome occupancy between X and autosomes occur chromosome-wide
We next examined whether the difference between X and autosomes was due to just a few genes, or was a more widespread property of X-linked genes. A histogram of nucleosome occupancy (Fig. 2A) shows that the entire distribution of X-linked promoter nucleosome occupancy values is significantly shifted to the right (t-test, P < 10−12). This is also illustrated by a heat map representation of nucleosome occupancy of all genes on the X versus the autosomes (Fig. 2B). Both the heat map and the histogram show that although the X harbors many gene promoters that have a typical nucleosome-depleted region, nucleosome occupancy is higher at the 5′ of genes compared to autosomal genes.
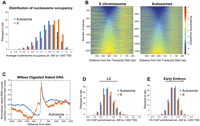
Nucleosome occupancy values at the beginning of X and autosomal genes. (A) Distribution of average embryo nucleosome occupancy at −300 to +200 bp of the transcript start sites among X and autosomes. (B) Heat map representation of nucleosome occupancy at all genes on the X and autosomes. Genes were sorted by their average occupancy between −300 to −100 bp from the transcript start site. The scale for the color gradient for occupancy values is shown on the right. (C) Naked DNA was extensively digested by MNase and sequenced. The read coverage per base pair is normalized and is plotted across the X and autosomal transcript start sites. (D,E) Histograms illustrate the distribution of average H3 ChIP enrichment between X and autosomes in L3 (D) and early embryos (E). Average ChIP enrichment was calculated from microarray probes within the −300 to +200 of the transcript start sites.
It is well known that MNase cuts naked DNA with sequence preferences that match the sequences characteristic to linker DNA (Keene and Elgin 1981; Yuan et al. 2005; Albert et al. 2007; Valouev et al. 2008; Clark 2010). Despite this correspondence between the sequence preferences of MNase and linker DNA, it has been firmly established that MNase digestion of chromatin results in 147 bp particles that are nucleosomes (Lutter 1979, 1981; Cartwright and Elgin 1982; Jessee et al. 1982; Prunell and Kornberg 1982; Cartwright et al. 1983; Richmond et al. 1984; Hayes et al. 1990; Flaus et al. 1996; Richmond and Davey 2003; Widlak and Garrard 2006; Visnapuu and Greene 2009). As expected, digestion of naked C. elegans DNA with MNase also resulted in a higher signal on X promoters than on autosomes (Fig. 2C).
Independent of MNase digestion and sequencing, others measured nucleosome occupancy by histone H3 ChIP microarray analysis in L3 larvae (Liu et al. 2011) and early embryos (Rechtsteiner et al. 2009). Using data from these studies, we found higher H3 enrichment around transcript start sites on the X compared to autosomes (−0.02 vs. −0.13 for L3 [Fig. 2D], and 0.04 vs. −0.02 for early embryo [Fig. 2E]; t-test, P < 2.4 × 10⁻¹⁸ for L3 and P < 4.4 × 10⁻¹² for early embryo). These H3 ChIP data sets were generated using chromatin extracts prepared by sonication instead of MNase treatment, and H3 enrichment was measured by microarrays instead of high-throughput sequencing, and corroborate higher nucleosome occupancy at X promoters.
Differences in GC content between X and autosomal promoters may underlie the differences in experimentally measured nucleosome occupancy
It has long been known that GC content correlates positively with nucleosome occupancy (Widom 2001; Lee et al. 2007; Peckham et al. 2007; Chung and Vingron 2009; Schwartz et al. 2009), and recent studies indicate that it may indeed be the dominating factor in DNA-encoded nucleosome occupancy (Tillo and Hughes 2009). Therefore, we examined whether the DNA sequence composition of X-linked promoters could account for the difference in the MNase-generated occupancy profiles. Indeed, at individual promoters across the genome (−300 to +200 relative to the transcript start site), GC content correlated positively with nucleosome occupancy (Supplemental Fig. 3E, Pearson correlation coefficient 0.79). The difference in GC content between X and autosome promoters mirrored the measured difference in nucleosome occupancy, with the largest difference in both measures occurring ∼150 bp upstream of the transcript start site (see arrow, Fig. 3A). Similar to the measured nucleosome occupancy values (Fig. 2A), the distribution of GC content values for individual promoters on X was shifted positively relative to autosomal values (Fig. 3B). In the region surrounding the transcript start sites, GC content of the X (36.7%) was higher than that of each individual autosome (35.8% for I, 36.0% for II, 35.6% for III, 35.2% for IV, and 35.1% for V). On average, GC content differed by 1.2% (35.5% on autosomes vs. 36.7% GC on X). At the same region, measured nucleosome occupancy on X-linked promoters is 1.6-fold higher relative to autosomes.
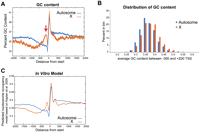
DNA sequence factors that influence nucleosome occupancy on X and autosomes. (A) Percentage of GC bases in a 50 base-pair window surrounding each base pair is averaged and plotted separately across X and autosomal transcript start coordinates. (B) Distribution of average GC content (−300 to +200 of the transcript start sites) among X and autosomes. (C) Normalized nucleosome occupancy per base pair was predicted by a model derived from in vitro reconstitution of nucleosomes on yeast DNA. The values from this model are averaged and plotted across the X and autosomal transcript start sites.
A DNA-sequence based model correlates with nucleosome occupancy throughout the genome and recapitulates X and autosome differences
A nucleosome occupancy prediction model that is based on in vitro assembly of yeast nucleosomes (Kaplan et al. 2009) correlated well with in vivo C. elegans nucleosome occupancy. The Pearson correlation coefficient of 0.84 for embryos and 0.75 for germlineless adults (Supplemental Fig. 2F) is similar to the correlation observed between the model and in vivo nucleosome occupancy in yeast (0.74) (Kaplan et al. 2009). The in vitro model also predicted the higher nucleosome occupancy of X promoters (Fig. 3C). Two major components of this model are GC content and dinucleotide frequency. To test whether dinucleotide frequency is also different between X and autosomes, we aligned 147 bp sequenced fragments and counted the frequency of dinucleotides. Dinucleotide periodicity was apparent in the MNase digestion of chromatin (Supplemental Fig. 4A) as previously observed (Kaplan et al. 2009), but not in the digestion of naked DNA (Supplemental Fig. 4B). We next examined only nucleosomes that reside near transcript start sites (−300 to +200). There were no striking differences in dinucleotide frequencies between X and autosomes, although a disturbance in the pattern was observed 20 to 30 bp from the dyad among nucleosomes in X-linked promoters, the significance of which is not clear (Supplemental Fig. 4C).
Differences in operon usage or repeat frequency do not account for nucleosome occupancy differences between X and autosome promoters
The C. elegans genome contains over 1000 operons, which account for about 15% of all protein-coding genes (Blumenthal et al. 2002). However, fewer than 5% of the operons are on the X (Blumenthal et al. 2002; Reinke and Cutter 2009). To ensure that this difference in gene content was not driving our result, we selected only genes that were either not part of operons, or were the first gene transcribed within operons. C. elegans transcripts undergo trans-splicing, which removes the beginning of RNA transcripts and adds one of two RNA splice leaders to each transcript, either “SL1” or “SL2” (Blumenthal 1995). Genes that are not in operons or are the first gene in operons typically receive the SL1 leader, with genes internal to operons receiving SL2. When we compared X and autosomal SL1-spliced genes (Gerstein et al. 2010), we found the same increased nucleosome occupancy at −300 to +200 bp from transcript starts (Fig. 4A) as reported for all genes (Fig. 1C). In contrast, SL2-spliced genes derived from the X and autosomes, which are internal to operons, have much more similar nucleosome occupancy profiles surrounding their transcript start sites (Fig. 4B).
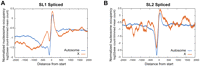
Nucleosome occupancy across the SL1 and SL2 spliced transcript starts. Normalized embryo nucleosome occupancy per base pair was averaged and plotted across X and autosomal transcript starts that have an SL1 (A) or SL2 (B) splice leader.
The X chromosome sequence differs from autosomes in other ways. For example, the X chromosome contains fewer repeat sequences, and therefore has more unique sequences, than autosomes. Consequently, the short sequence reads could be assigned to the X chromosome 1.13-fold more frequently per kilobase than on autosomes (Supplemental Table 2). Differences in the ability to map short sequence reads also occur across the transcript start and end sites (Supplemental Fig. 5A,B), as has been observed in the human genome (Rozowsky et al. 2009). However, the increased nucleosome occupancy we see at X-linked gene promoters is not due to such differences, because we only consider uniquely mappable regions on autosomes and the X. In addition, the mappability of the genome does not affect analysis of GC content or the in vitro model of nucleosome occupancy.
Higher nucleosome occupancy at X-linked promoters does not depend on dosage compensation
To test whether the binding of the dosage compensation complex to X affects nucleosome occupancy at X-linked promoters, we mapped nucleosomes in a mutant strain that is karyotypically male (XO), but is transformed into a hermaphrodite for ease of growth and culture [her-1(e1520) sdc-3(y126) V; xol-1(y9) X] (Davis and Meyer 1997). In these animals, the dosage compensation complex does not bind to the X chromosome. We found that nucleosome occupancy in these XO animals was similar to that in XX animals (Fig. 5A). As expected, half the number of reads map to X. Correcting for the karyotype by doubling the number of reads assigned to X results in a nucleosome occupancy pattern that is similar to XX animals, with higher nucleosome occupancy at the beginning of X genes relative to autosomal genes (Fig. 5B).
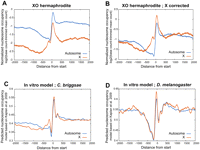
Higher nucleosome occupancy at the X promoters does not depend on somatic dosage compensation. (A) Nucleosome occupancy was measured in L3 XO hermaphrodites, which do not undergo dosage compensation. Nucleosome occupancy is averaged and plotted across X and autosomal transcript start sites. (B) X chromosome reads were doubled to correct for a single X in XO animals. (C,D) Nucleosome occupancy prediction from the in vitro model is plotted for X and autosomes of C. briggsae (C) and D. melanogaster (D).
Nucleosome occupancy differences among X and autosomal promoters are predicted in a related nematode species, but not in Drosophila
We examined whether the differences in nucleosome occupancy extended to other species. C. briggsae is a nematode separated from C. elegans by ∼100 million years of evolution, but which may employ a dosage compensation mechanism similar to that in C. elegans. In C. briggsae, nucleosome occupancy on X promoters is also predicted to be higher than autosomes (Fig. 5C). In contrast, predicted nucleosome occupancy in D. melanogaster lacks differences between X and autosomal promoters (Fig. 5D). Drosophila is estimated to have shared a last common ancestor with C. elegans more than 800 million years ago and has a completely different dosage compensation system (Straub and Becker 2007).
Discussion
There are several challenges associated with profiling nucleosome occupancy in C. elegans by MNase-seq. First, the true site of transcriptional initiation in C. elegans is not well-annotated due to trans-splicing (Krause and Hirsh 1987; Hastings 2005). Thus, throughout this manuscript we refer to the “transcript start site” rather than the “transcription start site,” because in almost all cases the exact site of transcription initiation at a given gene is not known. For most of our analyses, we used the longest transcript coordinates annotated in the WS170 assembly of the genome. If we instead use transcript start coordinates from recent RNA-seq experiments, which are independently derived but still suffer from the ambiguity caused by trans-splicing, the results agree with our main finding that X promoters harbor higher nucleosome occupancy (Fig. 4A; data not shown). Second, nucleosome occupancy measurements recorded at each genomic region reflect occupancy in mixed tissues and multiple cells. This could result in a more “blurred” nucleosome map, especially in a highly dynamic sample such as embryos. Consistent with this possibility, overall nucleosome coverage of the genome appears to be more even in embryos relative to adults (Supplemental Fig. 5C). Third, high-throughput sequencing of the C. elegans genome contains an inherent positive bias toward GC content (Hillier et al. 2008). However, this bias would apply to the entire genome, not just X promoters, and our finding was corroborated by independent data using the SOLiD sequencing platform, a model for nucleosome occupancy derived from in vitro nucleosome assemblies, straightforward measures of GC content, and histone ChIP experiments detected on DNA microarrays (Fig. 2D,E).
Nucleosome occupancy has been studied in many organisms, including yeast (Yuan et al. 2005; Lee et al. 2007; Kaplan et al. 2009; Zhang et al. 2009), Aspergillus (Nishida et al. 2010), the malaria parasite (Ponts et al. 2010), C. elegans (Valouev et al. 2008; Ooi et al. 2010), Drosophila (Mavrich et al. 2008), and human tissue culture cells (Schones et al. 2008). The results of our experiments are similar to previous studies with respect to the relationship between overall nucleosome occupancy and gene structure. Both the 5′ and 3′ ends of C. elegans genes harbor lower nucleosome occupancy, with a well-positioned nucleosome just downstream from the transcript start. C. elegans exons also contained higher nucleosome occupancy compared to introns (Supplemental Fig. 5D). Similar to other studies (Schones et al. 2008), we did not find a simple correlation between nucleosome occupancy and transcription. On average, in genes that change in expression between embryos and adults, nucleosome occupancy tended to increase at promoters when RNA levels decreased, and vice versa (correlation coefficient −0.12).
Unlike the autosomes, the X chromosome is subject to chromosome-wide regulation in both the soma and germline. During meiosis, the X chromosome is devoid of chromatin marks that correlate with active transcription (Kelly et al. 2002; Bender et al. 2006). In the soma, dosage compensation complex binds to promoters of expressed genes on the X (Ercan et al. 2007; Jans et al. 2009), and represses transcription by a factor of two (Meyer and Casson 1986). Here, we report higher nucleosome occupancy in promoters on the X chromosome relative to autosomal promoters in both embryonic and adult cells in C. elegans. The higher nucleosome occupancies on X did not depend on dosage compensation, and may be due to the higher GC content on X chromosome promoters relative to autosomes.
Both in vivo and in vitro evidence suggest that nucleosomes are generally repressive to transcription (for review, see Workman 2006). Thus, higher nucleosome occupancy on X may confer resistance to transcription. In humans, the DNA at tissue-specific promoters tends to specify higher nucleosome occupancy (Tillo et al. 2010), perhaps because these promoters should be activated in only a subset of the tissues. Consistent with this hypothesis, genes whose expression depends strongly on chromatin remodelers have higher nucleosome occupancy in their promoters (Ioshikhes et al. 2006; Field et al. 2008; Tirosh and Barkai 2008). Perhaps higher nucleosome occupancy at C. elegans X chromosome promoters facilitates the activity of chromatin remodelers that differentially regulate X-linked transcription in multiple tissues and life stages.
Nucleosome occupancy at gene promoters evolves according to the expression program of that gene (Field et al. 2009; Tirosh et al. 2009, 2010; Tsankov et al. 2010). It is possible that the high nucleosome occupancy at X promoters coevolved with the somatic and germline dosage compensation mechanisms that regulate X transcription. In a related nematode, C. briggsae, X is also predicted to have higher nucleosome occupancy (Fig. 5C). In contrast, no such difference is observed in D. melanogaster (Fig. 5D), where transcription from the single X in males is increased twofold, probably through an elongation-mediated mechanism (Straub and Becker 2007). C. elegans dosage compensation is mediated by a condensin-like protein complex, with four out of five members also involved in chromosome assembly and condensation during mitosis and meiosis (Csankovszki et al. 2009). Whether nucleosome occupancy and positioning helps to provide specificity to condensin targeting will be exciting to explore.
Methods
Worm strains and growth
Mixed-stage embryos (wild type N2) were isolated and treated with 2% formaldehyde for 15 min. Germlineless adults were obtained by growing JK1107 [glp-1(q224)] at permissive temperature (15°C), then shifting L1s to restrictive temperature (25°C) until they reach adulthood. Germline containing adults DH245 [fem-2(b245)] were grown similar to JK1107 strain, except that the L1s were shifted to 23°C. TY2205 [her-1(e1520) sdc-3(y126) V; xol-1(y9) X] was grown at 20°C and L1s were filtered to separate from dead embryos, and grown until they reached L3 stage. The worms were collected in one volume of PBS and frozen by dripping into liquid nitrogen. A cryo-mortar and pestle were used to grind worms to a fine powder. The powder was incubated in 1% formaldehyde for 1 min before chromatin preparation.
MNase digestion and preparation of mononucleosomal DNA for sequencing
Samples were washed and dounced in dounce buffer (0.35 M sucrose, 15 mM HEPES-KOH at pH 7.5, 0.5 mM EGTA, 0.5 mM MgCl2, 10 mM KCl, 0.1 mM EDTA, 1 mM DTT, 0.5% Triton X-100, 0.25% NP-40). Samples were pelleted and washed with MNase digestion buffer (110 mM NaCl, 40 mM KCl, 2 mM MgCl2, 1 mM CaCl2, 50 mM HEPES/KOH at pH 7.5) then resuspended in six volumes of MNase digestion buffer, and digested with increasing amounts of MNase at 25°C for 10 min. DNA was purified from each sample and mononucleosomal DNA was gel purified. Sequencing libraries were prepared from 50 ng of DNA. End repair was done with NEB Klenow, T4 DNA polymerase, and T4 PNK for 30 min at 20°C. Exo(–) Klenow fragment and dATP was used to add adenosine at the 3′ ends, 1 h at 37°C. DNA were ligated to pair-end adaptors (Illumina) and amplified by PCR. DNA between 200 and 400 bp in size was gel purified. Paired-end sequencing was performed by GAIIx at the UNC high-throughput sequencing facility.
RNA preparation and expression array analysis
Embryos in 10 volumes of TRIzol (Invitrogen) were freeze-cracked. Adult RNA was prepared from frozen powder in TRIzol. Purification was done according to the manufacturer's protocol. RNA was further cleaned up using the Qiagen RNeasy kit. Labeling and hybridization to expression arrays were performed at Roche NimbleGen.
Data processing
Raw data was processed through Illumina pipeline. Each pair of reads was mapped independently to the WS170 genome, using a proprietary software (SeqHit) allowing a single mismatch and not allowing any gaps. If a read mapped more than one region of the genome, that read was extended (on both sides) up to 147 bp, and removed from the analysis, as being part of a non-unique region. We used only those pairs of uniquely mapped reads that were less than 200 bp apart. The two read edges were extended to cover the coordinates in between. The raw coverage of a coordinate is calculated by adding up the number of read pairs that cover it. Zero value is assigned to base pairs that were in a unique region but not covered by any read pair. Raw data files and wiggle tracks of nucleosome coverage per base pair are at the NCBI Gene Expression Omnibus database (http://www.ncbi.nlm.nih.gov/geo) and the Sequence Read Archive (http://www.ncbi.nlm.nih.gov/Traces/sra/sra.cgi) under accession number GSE20136. Any region of base coverage greater than 10 times the genome median, were trimmed to equal 10 times the median. The number of reads that cover each coordinate was normalized by log2-transforming the ratio of reads to the average genome coverage. The two replicates of each data set were averaged and used as a measure of nucleosome occupancy. Wiggle tracks of normalized files are available at the modENCODE Data Coordination Center (DCC) (http://www.modencode.org/). DCC accession numbers for nucleosome occupancy in embryos, germlineless, and germline-containing adults are 2763, 2764, and 3276, respectively. The DCC accession numbers for H3 ChIP experiments in L3 and early embryos are 2407 and 2312, respectively. H3 ChIP enrichment was calculated by standardizing log2 ratios of the intensity of H3 ChIP channel to the input DNA channel obtained from hybridization to NimbleGen microarrays (080922_modENCODE_CE_chip_HX1, GEO platform number GPL8647) that tile the whole genome at 50-bp resolution.
Data analysis
Transcript coordinates were composed from WormBase WS170. For genes with multiple transcripts, only the longest transcript was selected. Transcripts shorter than 200 bp were discarded (71 transcripts). In vitro model predictions were done on C. briggsae (UCSC genome version Cb3), and on D. melanogaster (UCSC genome version dm3).
More detailed descriptions of our methods are provided in the Supplemental material.
Acknowledgments
We thank LaDeana W. Hillier, Andreas Rechtsteiner, Nicole Cheung, Tao Liu, and Isabel Latorre for providing processed data and annotation lists; Hoang Pham for growing germline-containing adults; Christina Whittle for growing germlineless adults; A. Leo Iniguez and Heidi Rosenbaum for processing expression microarrays; the UNC High Throughput Sequencing Facility for sequencing; and the Dernburg, Ahringer, Strome, Liu, and Desai labs for helpful discussions and suggestions. This research was supported by modENCODE grant U01 HG0044270.
Footnotes
-
↵6 Corresponding authors.
E-mail ercan{at}email.unc.edu.
E-mail eran.segal{at}weizmann.ac.il.
-
[Supplemental material is available for this article. The sequencing and microarray data from this study have been submitted to the NCBI Gene Expression Omnibus (http://www.ncbi.nlm.nih.gov/geo) under accession no. GSE20136.]
-
Article published online before print. Article, supplemental material, and publication date are at http://www.genome.org/cgi/doi/10.1101/gr.115931.110.
- Received September 27, 2010.
- Accepted November 15, 2010.
- Copyright © 2011 by Cold Spring Harbor Laboratory Press


