
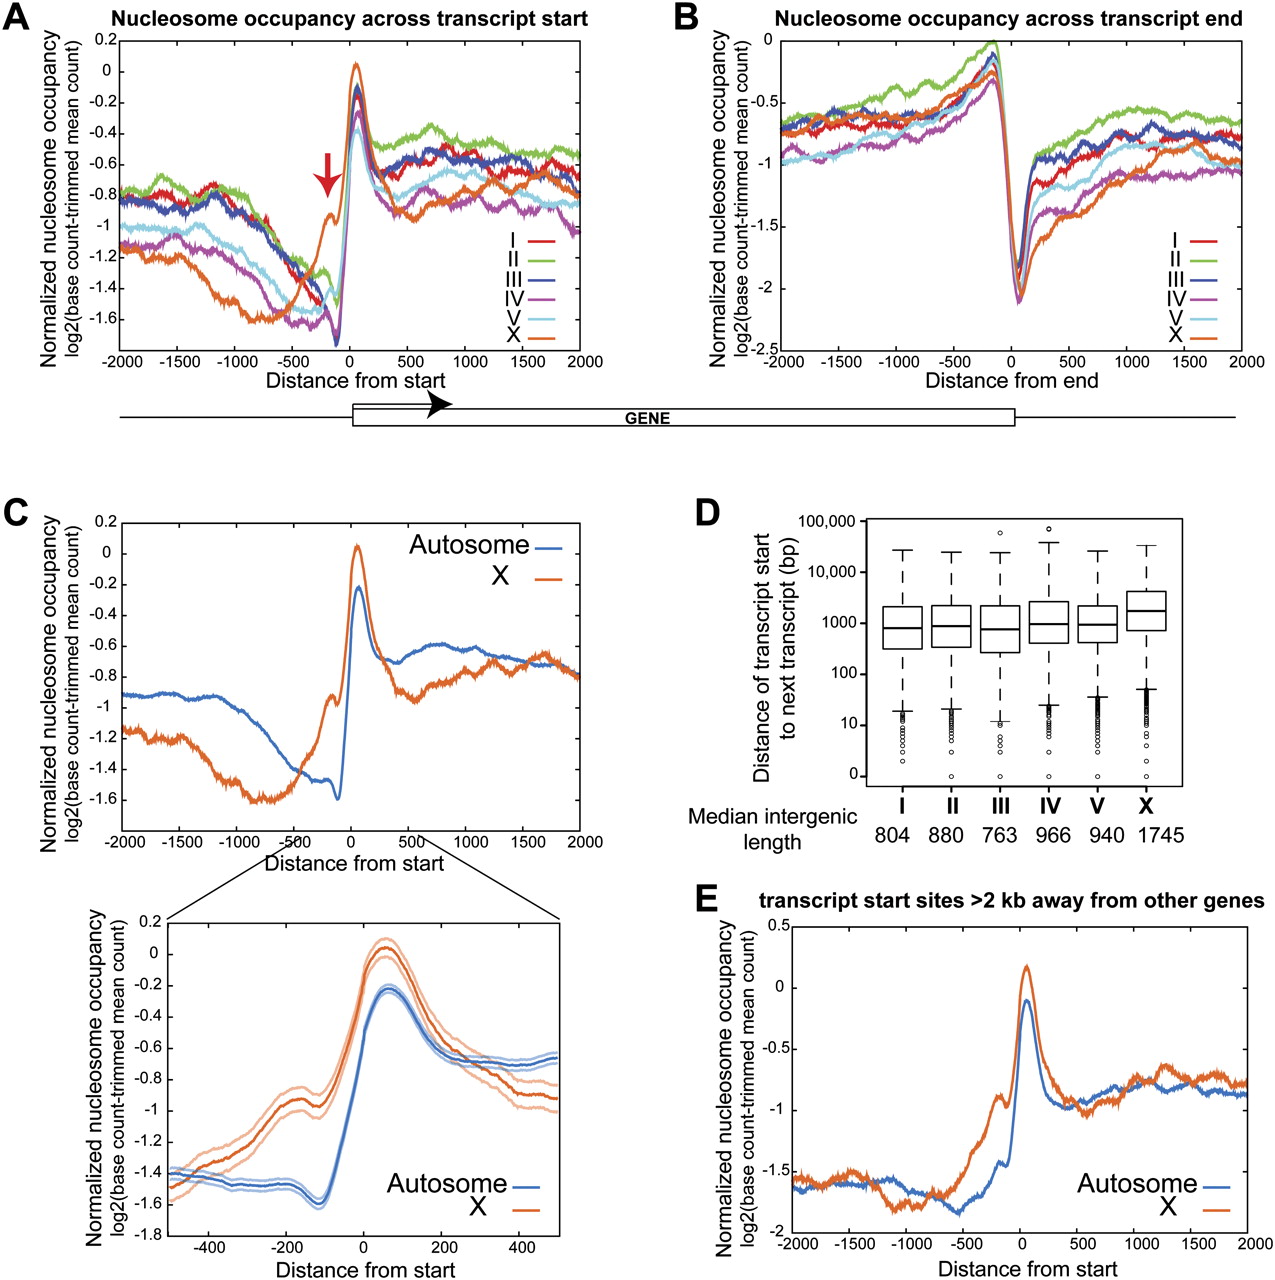
Higher nucleosome occupancy on X promoters. Normalized embryo nucleosome occupancy per base pair was averaged across all transcripts, and plotted across the transcript start (A) and end (B) for each chromosome. A schematic representation of a gene is shown below the panels, and the red arrow in panel A indicates the higher nucleosome occupancy on the X promoters. (C) The same as A, but the data from autosomes are collapsed. The lower panel zooms to the 1-kb region around the transcript start. The lighter shades of each line represent two standard errors from the mean. (D) The distance between each transcript start to the nearest upstream transcript is plotted for each chromosome. Median length is reported below. (E) Same as A, but for only genes whose transcript starts are more than 2 kb away from other genes are used. This consisted of 5084 autosomal and 1480 X chromosome transcripts.


