
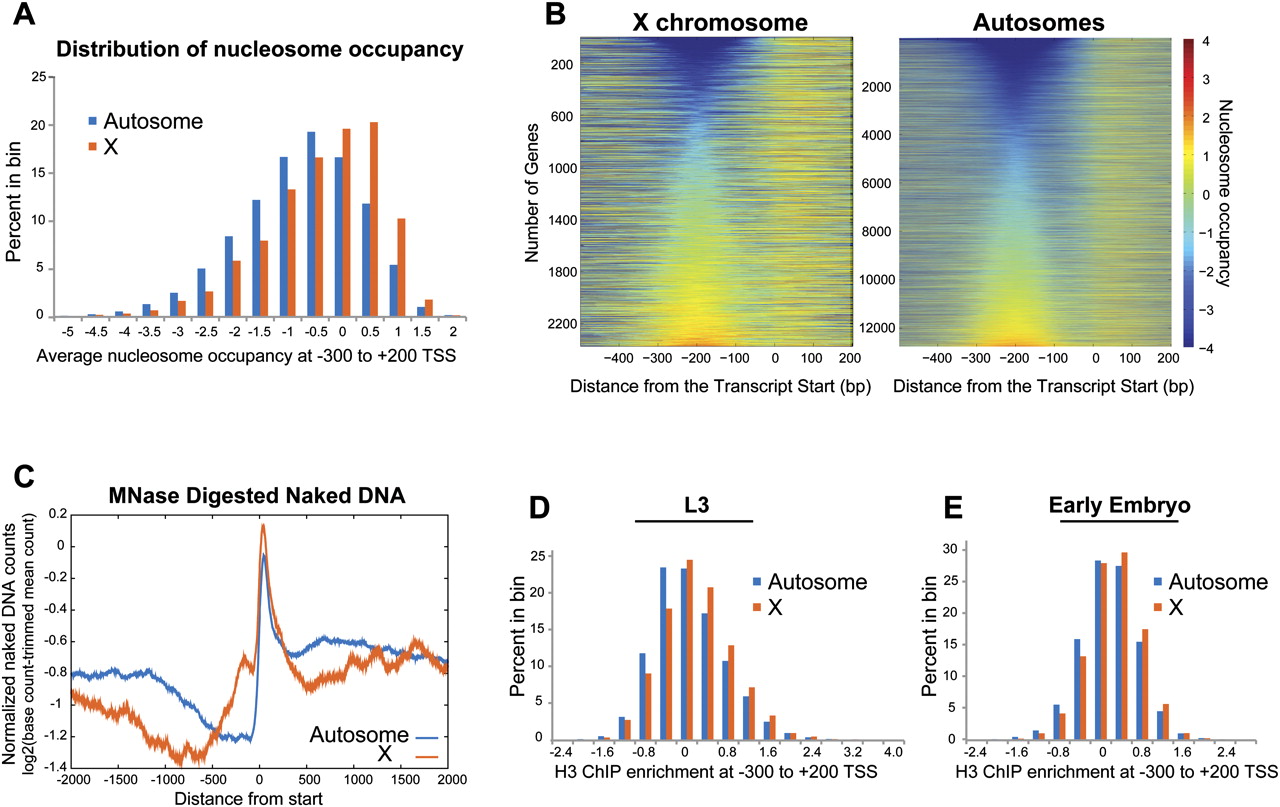
Nucleosome occupancy values at the beginning of X and autosomal genes. (A) Distribution of average embryo nucleosome occupancy at −300 to +200 bp of the transcript start sites among X and autosomes. (B) Heat map representation of nucleosome occupancy at all genes on the X and autosomes. Genes were sorted by their average occupancy between −300 to −100 bp from the transcript start site. The scale for the color gradient for occupancy values is shown on the right. (C) Naked DNA was extensively digested by MNase and sequenced. The read coverage per base pair is normalized and is plotted across the X and autosomal transcript start sites. (D,E) Histograms illustrate the distribution of average H3 ChIP enrichment between X and autosomes in L3 (D) and early embryos (E). Average ChIP enrichment was calculated from microarray probes within the −300 to +200 of the transcript start sites.


