
Abstract
Pollen, the male gametophyte of flowering plants, represents an ideal biological system to study developmental processes, such as cell polarity, tip growth, and morphogenesis. Upon hydration, the metabolically quiescent pollen rapidly switches to an active state, exhibiting extremely fast growth. This rapid switch requires relevant proteins to be stored in the mature pollen, where they have to retain functionality in a desiccated environment. Using a shotgun proteomics approach, we unambiguously identified ∼3500 proteins in Arabidopsis pollen, including 537 proteins that were not identified in genetic or transcriptomic studies. To generate this comprehensive reference data set, which extends the previously reported pollen proteome by a factor of 13, we developed a novel deterministic peptide classification scheme for protein inference. This generally applicable approach considers the gene model–protein sequence–protein accession relationships. It allowed us to classify and eliminate ambiguities inherently associated with any shotgun proteomics data set, to report a conservative list of protein identifications, and to seamlessly integrate data from previous transcriptomics studies. Manual validation of proteins unambiguously identified by a single, information-rich peptide enabled us to significantly reduce the false discovery rate, while keeping valuable identifications of shorter and lower abundant proteins. Bioinformatic analyses revealed a higher stability of pollen proteins compared to those of other tissues and implied a protein family of previously unknown function in vesicle trafficking. Interestingly, the pollen proteome is most similar to that of seeds, indicating physiological similarities between these developmentally distinct tissues.
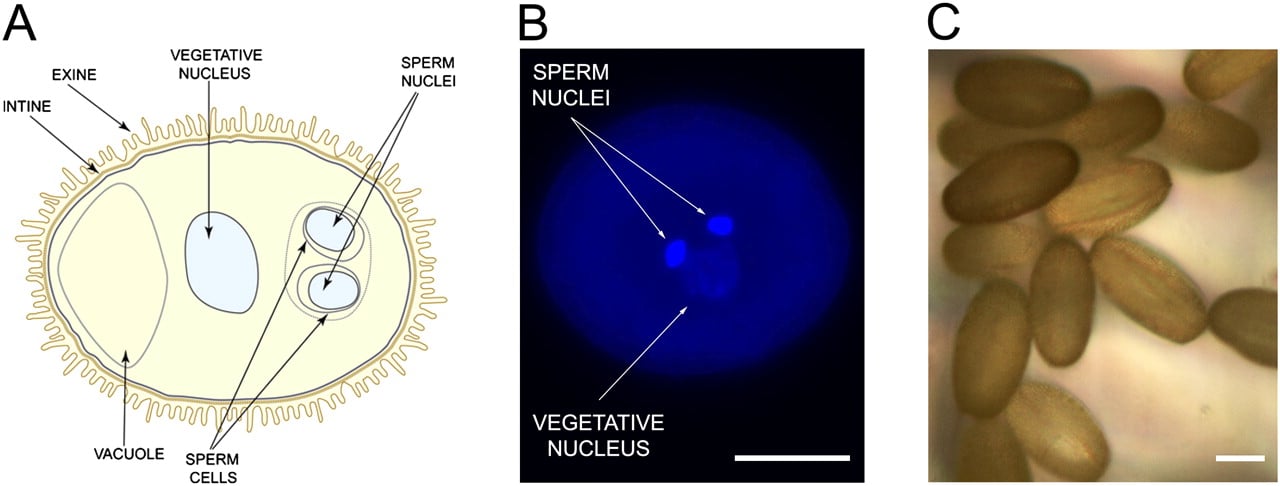
The plant life cycle alternates between a diploid and a haploid generation, the spore-producing sporophyte and the gamete-producing gametophyte, respectively (Supplemental Fig. S1). Unlike in animals, where meiotic products directly differentiate into gametes, the haploid spores undergo several mitotic divisions to form multicellular gametophytes, which in turn form the gametes. In the anther, microspores initiate male gametophyte (pollen) development through an asymmetric division forming a large vegetative and a smaller generative cell (McCormick 2004). The latter is engulfed into the cytoplasm of the vegetative cell and divides again to form the two sperm cells (Fig. 1A,B). The mature pollen is released from the anther and, after deposition on the stigma, the pollen grain germinates, grows a pollen tube, and transports the sperm cells to the female gametes where double fertilization ensues. Consequently, the pollen grain—although in a silent state—must be poised for these rapid physiological changes. Since pollen is a vehicle for dispersal, it is largely dehydrated and has to survive harsh environmental conditions before it reaches a fertilization partner.
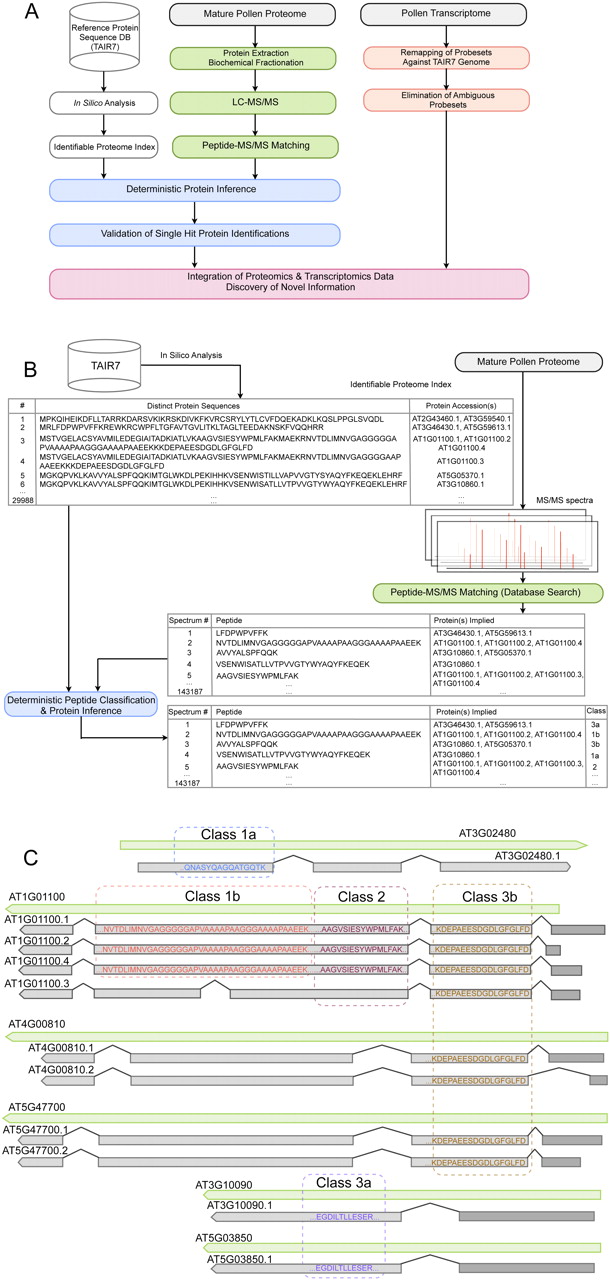
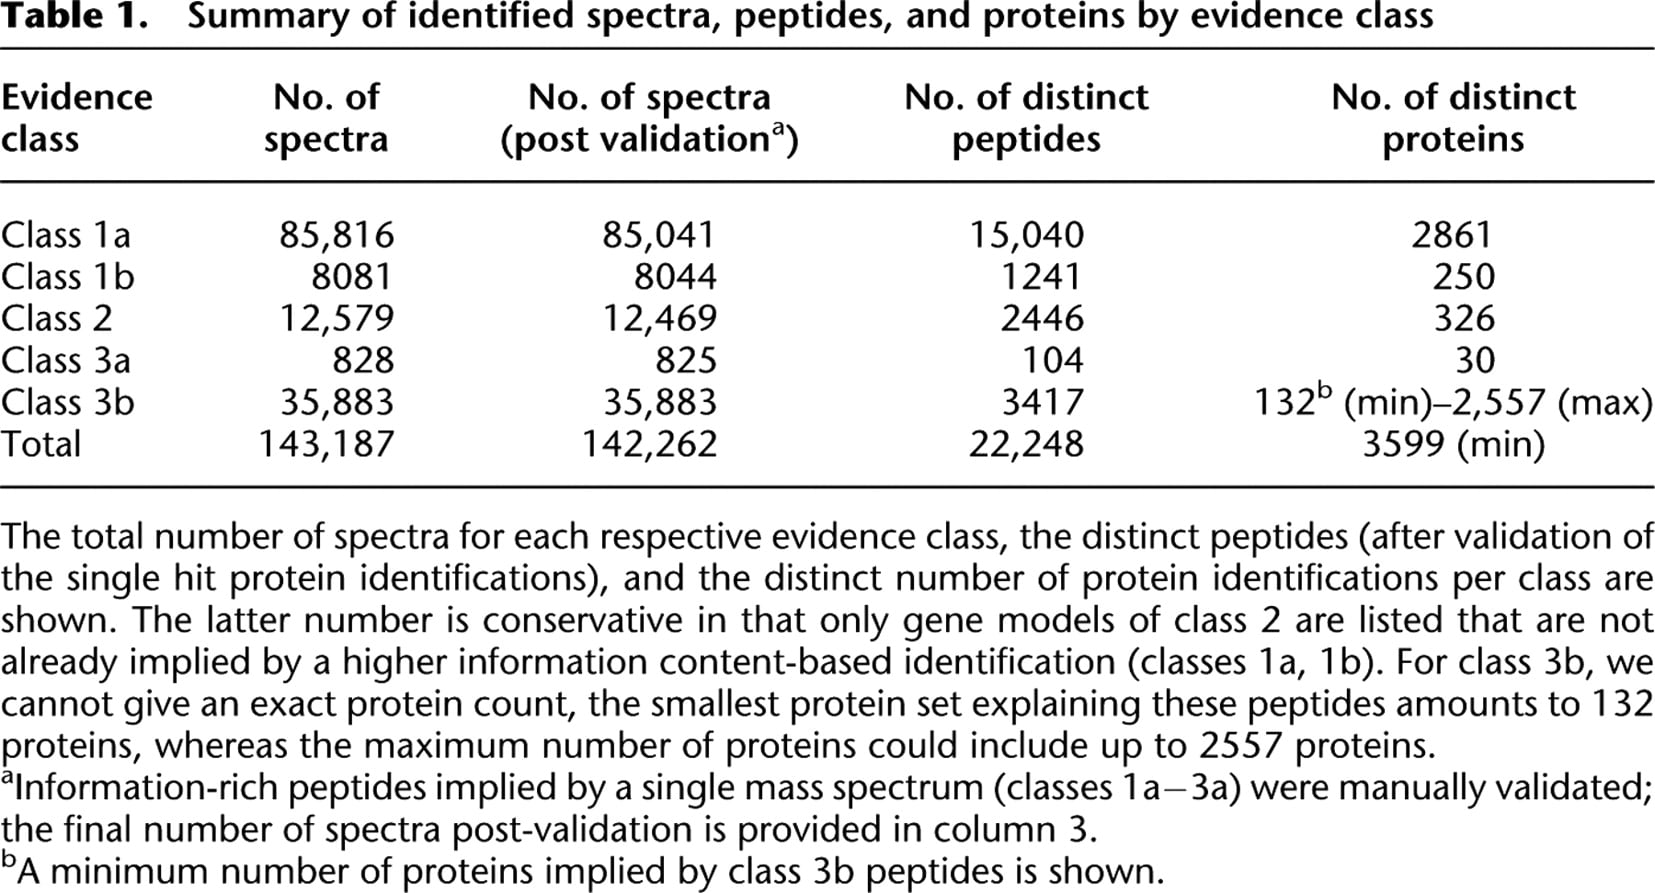
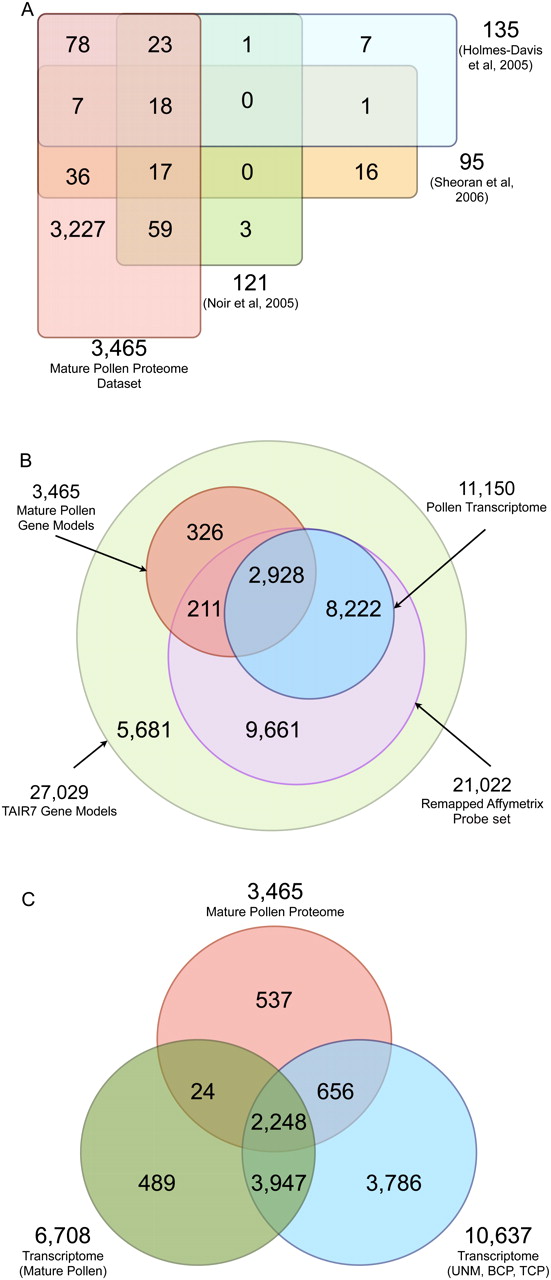
Arabidopsis thaliana male gametophyte (pollen grain). (A) Schematic representation of a mature pollen grain, which contains two sperm cells enclosed in the cytoplasm of a vegetative cell. Characteristics of the vegetative cell include a large vacuole and nucleus. The pollen coat is composed of an external layer (the exine) and an internal layer (the intine). (B) DNA staining with DAPI (diamidino-2-phenylindole) showing the vegetative nucleus and two sperm nuclei. (C) Purity of mature pollen grains collected on the 6-μm mesh. Scale bars, 10 μm.
Mature pollen represents a largely autonomous, highly simplified organism, which is specialized for the dispersal and transport of male gametes. It is ideally suited for the study of cell growth and morphogenesis as well as processes underlying dehydration and prolonged survival (Hepler et al. 2001; Boavida et al. 2005). Since pollen is the main allergen for type I allergy, and more than 400 million people suffer from seasonal asthma or hay fever, pollen biology is of major medical interest (Taylor et al. 2007).
Most of our knowledge about pollen development and function is based on genetic analyses and transcriptomics studies in a few plant model systems such as Arabidopsis thaliana or Zea mays. Expression evidence for ∼12,000 genes has been reported from various stages of pollen development (Becker et al. 2003; Honys and Twell 2003, 2004; Pina et al. 2005; Schmid et al. 2005). The transcriptome complexity of mature pollen (6500 expressed gene models) was lowest among 79 Arabidopsis tissues characterized in the AtGenExpress data set, and stood out based on its very broad distribution of expression levels, which included a prominent fraction of low expressed genes, as well as a minor fraction of highly expressed genes (Schmid et al. 2005).
Transcription is not essential for the mature pollen grain and during pollen tube growth (Mascarenhas 1965; Onodera et al. 2008), suggesting that significant control is exercised at the post-transcriptional level. As the correlation between pollen transcript and protein levels is not known and the ATH1 array used in transcriptome studies covers only 83% of the protein-coding gene models of the Arabidopsis reference database TAIR7, proteomic studies promise additional insights. Despite this, our knowledge about the pollen proteome is very limited: 2D gel electrophoresis approaches have collectively identified 266 distinct proteins (Holmes-Davis et al. 2005; Noir et al. 2005; Sheoran et al. 2006). Mature pollen represents a difficult system for a proteomics approach in terms of sample preparation, where sufficient quantities of protein have to be collected. Moreover, the significant amount of genome duplication in higher plants, combined with the expectation (based on transcriptomics data) that a large percentage of proteins can only be identified by a single peptide, poses a significant data analysis challenge.
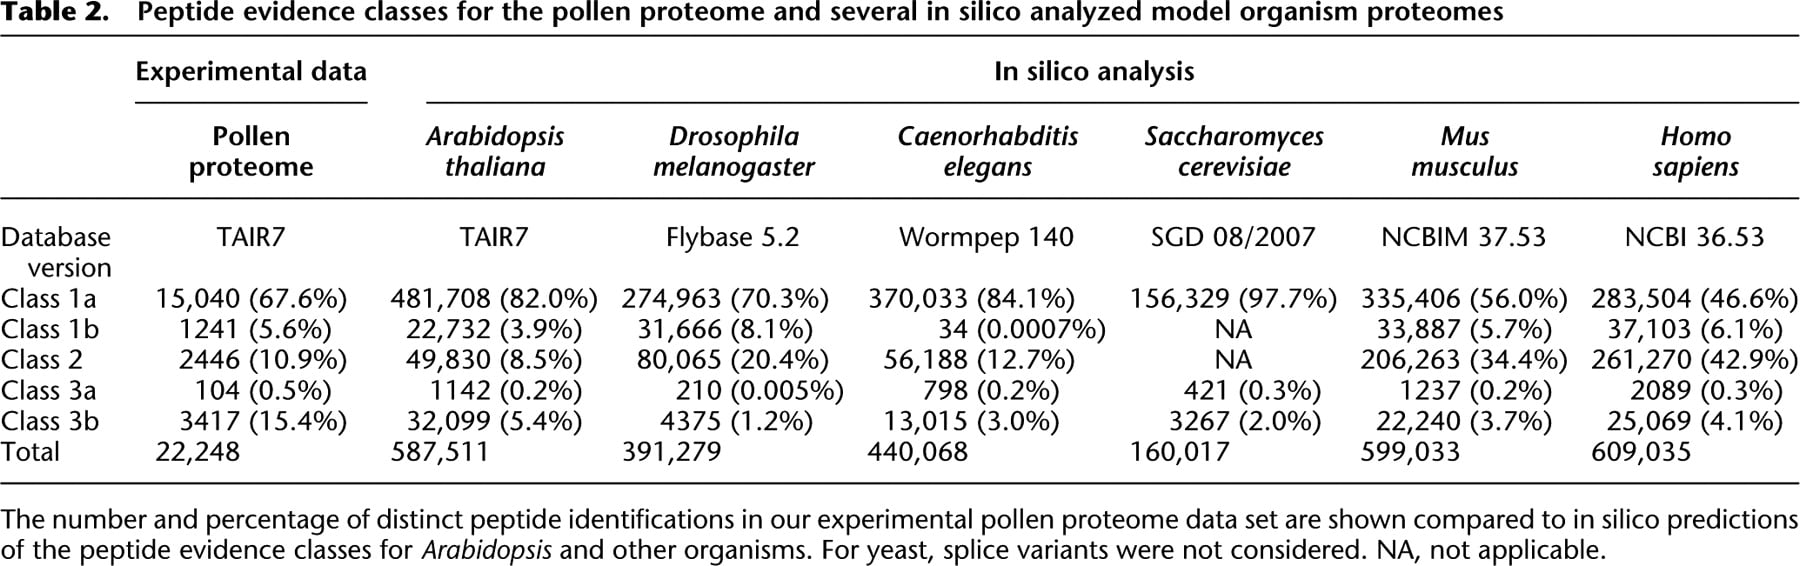
The peptide-centric nature of shotgun proteomics has the effect that identified peptides often cannot be unambiguously assigned to one protein. This makes a subsequent biological data interpretation very difficult and requires strategies to extract the maximum of unambiguous protein evidence. To address this issue, we have devised a novel deterministic peptide classification and protein inference scheme for shotgun proteomics data, which differs from the existing approaches such as ProteinProphet (Nesvizhskii et al. 2003), EBP (Price et al. 2007), and IDPicker (Zhang et al. 2007) in three aspects: (1) Our deterministic classification is the only approach that considers the gene model–protein sequence–protein accession relationships and classifies each peptide sequence according to its information content (Fig. 2B,C). Thus it distinguishes unique peptides from those shared by several proteins, either encoded by the same gene model or by distinct gene models; (2) in contrast to probabilistic approaches, it only considers peptides above a certain confidence threshold after the peptide spectrum matching process, not peptides of lower score, hence the name deterministic. By filtering less informative, ambiguous peptides a conservative cumulative protein list with a minimal number of false or ambiguous protein assignments can be generated, allowing researchers to draw firm conclusions from the final data set; (3) by considering the protein–gene model relationship, our classification scheme facilitates the seamless integration with transcriptomics data sets.
Overall workflow and peptide classification scheme. (A) Our workflow integrates the in silico analysis of the Arabidopsis reference protein database (TAIR7; Supplemental Fig. S3) to generate an identifiable proteome index (open boxes); the extraction, biochemical processing, and digestion of pollen proteins followed by mass spectrometric analysis and identification of peptides (green boxes); the manual validation of single hit proteins following deterministic peptide classification and protein inference (blue boxes); the reanalysis of transcriptomics data after remapping of the probe sets versus the TAIR7 genome and elimination of ambiguous probe sets (orange boxes); and finally the integration of proteomics and transcriptomics data allowing for discovery of novel information (pink box). (B) In silico analysis of TAIR7 allows definition of the identifiable proteome and the protein sequence–protein accession–gene model relationships. Comparison of the database search results with this identifiable proteome index (29,988 distinct protein sequences) allows us to classify each experimentally observed peptide (143,187) according to its information content and to subsequently report a conservative list of unambiguous protein identifications, as well as a likely list of proteins identified by ambiguous peptides. (C) Schematic visualization of our classification into five evidence classes. We show examples of experimentally observed peptides of class 1a (e.g., QNASYQAGQATGQTK, which unambiguously identifies AT5G65880.1); class 1b (e.g., NVTDLIMNVGAGGGGGAPVAAAAPAAGGGAAAAPAAEEK, which could imply three proteins with identical sequence that may only differ in their 5′ or 3′ UTRs [only the 5′ UTRs are represented as dark gray boxes], namely AT1G01100.1, AT1G01100.2, and AT1G01100.4 of the gene model AT1G01100, but not the splice variant AT1G0110.3, which has a different protein sequence); class 2 (e.g., AAGVSIESYWPMLFAK, which implies all splice variants of gene model AT1G01100 [in this case two distinct protein sequences]; class 3a (e.g., EGDILTLLESER, which unambiguously identifies one protein sequence that can be encoded by the distinct gene models AT3G10090.1 and AT5G03850.1). Finally, class 3b gathers peptides pointing to different protein sequences encoded by different gene models (ambiguous protein identifications).
Using shotgun proteomics, we identified ∼3500 proteins, expanding the mature pollen proteome by a factor of 13. Manual validation of all unambiguous single hit protein identifications enabled us to eliminate a large number of false positive identifications and to provide a reference data set of high quality. Integration of our proteomics data with published transcriptomics data sets allowed us to report >500 proteins that were not previously identified in mature pollen. Functional analysis of the mature pollen proteome provided novel insights into pollen function and development, related to dehydration, prolonged survival, protein stability, post-transcriptional control, and rapid tip growth.
Results and Discussion
Identification of peptides from mature pollen
We performed shotgun proteomics experiments on highly pure, mature Arabidopsis thaliana pollen grains (Fig. 1C). Extensive coverage of a biologically complex protein sample depends on reducing its complexity by biochemical processing (Fig. 2A). We used a four-buffer sequential protein extraction protocol (Supplemental Methods) and fractionated the proteins using gel electrophoretic separation (one-dimensional SDS-PAGE) and a gel-free, chromatography-based peptide separation method: isotope-coded affinity tagging (ICAT) (Gygi et al. 1999). In this context the ICAT method was used for reduction of sample complexity (Supplemental Methods). Using this methodology, we could identify lower abundant proteins as well as proteins with distinct biochemical properties.
Mass spectrometric analysis was performed using electrospray ionization-based liquid chromatography–tandem mass spectrometry with a two-dimensional linear ion trap. We performed 15 experiments (Supplemental Fig. S2) and identified 22,248 distinct peptides corresponding to at least 3599 proteins. Using a novel, deterministic classification scheme, we could unambiguously assign either one protein sequence or the encoding gene model for 3467 of these proteins (Table 1). Our data was uploaded into the public protein repository PRIDE (http://www.ebi.ac.uk/pride/) under the accession numbers 8743–8750 and in the AtProteome database as “Pollen proteome map of Arabidopsis thaliana” (http://fgcz-atproteome.unizh.ch/; Baerenfaller et al. 2008).
Summary of identified spectra, peptides, and proteins by evidence class
[i] The total number of spectra for each respective evidence class, the distinct peptides (after validation of the single hit protein identifications), and the distinct number of protein identifications per class are shown. The latter number is conservative in that only gene models of class 2 are listed that are not already implied by a higher information content-based identification (classes 1a, 1b). For class 3b, we cannot give an exact protein count, the smallest protein set explaining these peptides amounts to 132 proteins, whereas the maximum number of proteins could include up to 2557 proteins.
[ii] aInformation-rich peptides implied by a single mass spectrum (classes 1a−3a) were manually validated; the final number of spectra post-validation is provided in column 3.
[iii] bA minimum number of proteins implied by class 3b peptides is shown.
Overall integrative workflow
To assess to which extent our proteomics study provides additional and novel insights, a robust data integration strategy is required. We used the Arabidopsis database TAIR7 as a common reference point to compare our proteomics data with previous transcriptomics data sets. Our overall workflow (Fig. 2A) integrates several steps: (1) a thorough in silico analysis of the TAIR7 Arabidopsis protein reference database (Supplemental Fig. S3) combined with our novel deterministic classification scheme (Fig. 2B), (2) pollen protein extraction/fractionation maximizing the biochemical diversity of proteins, (3) estimation of the overall false discovery rate (FDR) by a decoy database search strategy, (4) manual validation of all single peptide hit protein identifications by information-rich peptides, and (5) seamless integration with transcriptomics data after reanalysis against the TAIR7 genome release.
Peptide classification and deterministic protein inference
The protein inference problem, typical of shotgun proteomics (Nesvizhskii and Aebersold 2005), is further accentuated by the significant amount of genome duplications in higher plants. In order to extract the maximum of unambiguous protein evidence, we have developed a novel, generic deterministic peptide classification scheme. This scheme evaluates the uniqueness of each peptide sequence, and thus its information content, by considering the gene model–protein sequence–protein accession relationships. Peptides were classified in terms of whether they unambiguously identify a certain protein, or merely imply a gene model, but not a specific protein isoform. This classification is based on preprocessing of the TAIR7 protein database (Supplemental Fig. S3), to define the identifiable proteome and to create an index of the gene model–protein sequence–protein accession relationships. The database search result for each assigned spectrum is then compared to this index (Fig. 2B), allowing us to classify identified peptides into one of five classes (Fig. 2C). Class 1a peptides unambiguously identify a single unique protein sequence and represent peptides with the highest information content. Class 1b peptides unambiguously identify a unique protein sequence, which could be encoded by several splice isoforms of the same gene model. These isoforms all encode an identical protein sequence, i.e., their transcripts only differ in the 5′ and/or 3′ untranslated region (UTR) sequences. Class 2 peptides unambiguously identify a gene model, but cannot be used to distinguish between several distinct protein sequences encoded by different splice isoforms. Class 3a peptides unambiguously identify one protein sequence, but this sequence can be encoded by several gene models from distinct loci. Finally, class 3b peptides can be derived from different protein sequences encoded by several gene models from distinct loci and have the least information content. Existing protein inference approaches either use probabilistic reasoning for aggregating peptides, including peptides with scores well below the confidence threshold, into protein groups (Nesvizhskii et al. 2003; Price et al. 2007), or extract the minimal set of protein groups that explain all the observed peptides (Zhang et al. 2007). However, they do not capture the gene model–protein sequence relationship, which is part of our inference process assigning clear information content to protein identifications of classes 1b, 2, or 3a and differentiating them from class 3b. This additional information content of peptides also suggests that an extension of the standards for protein identification, which rely on two unique peptides (Carr et al. 2004; Bradshaw et al. 2006), seems appropriate. Due to their ambiguity, class 3b peptides should not qualify as a second peptide, while class 2 peptides limit the identification to the gene model level and not to a particular protein isoform encoded by this gene model. Our classification approach allows us to filter a data set according to information content, which can be useful in different contexts: Proteins identified by peptides of classes 1a, 1b, and 2 (and their corresponding gene models) can be seamlessly integrated with transcriptomics data, while selection of unambiguously identified proteins (identified by peptides of classes 1a, 1b, 3a) provides the most accurate data set for protein parameter analysis. An in silico analysis of protein reference databases of several organisms, including human, underlines that our classification scheme is generally applicable (Table 2). While the percentage of the most relevant class 3b peptides is highest in Arabidopsis (5.4%), other organisms also have significant amounts of class 3b peptides (1.2% to 4.1%; Table 2). In principle, any reference database with a clear relationship between gene models and encoded protein isoforms can be analyzed using this deterministic classification scheme.
Peptide evidence classes for the pollen proteome and several in silico analyzed model organism proteomes
[i] The number and percentage of distinct peptide identifications in our experimental pollen proteome data set are shown compared to in silico predictions of the peptide evidence classes for Arabidopsis and other organisms. For yeast, splice variants were not considered. NA, not applicable.
Mature pollen proteome reference data set
For stringent data processing, we searched the mass spectra against the TAIR7 reference database concatenated with a decoy database plus roughly 260 additional common contaminants (keratins, trypsin, etc.) and only considered peptide identifications with a PeptideProphet probability (Keller et al. 2002) of ≥0.9 (excluding contaminant hits), yielding roughly 143,200 spectra. Based on the decoy database search (Elias and Gygi 2007), we determined an overall spectra FDR of 1.4% for our data set, translating to ∼1000 wrongly assigned peptides (0.7%) among the forward database hits. In large-scale shotgun proteomics experiments, up to 30% of the proteins are identified by a single mass spectrum (Nesvizhskii and Aebersold 2005). Since the error rate among single spectrum protein identifications is higher than for proteins identified by multiple spectra, these identifications are often discarded without further validation, with the consequence of loosing valuable information on truly expressed proteins. Our classification scheme, however, enables us to extract the high information content (classes 1a–3a) single hit protein identifications (1407). The corresponding spectral assignments were manually validated and 35% of them (482/1407) were accepted as correct assignments, systematically reducing the FDR of the entire data set.
The calculation of spectra FDR is based on the assumption that the number of false positives among the forward database hits equals that among the decoy hits. Similar assumptions cannot be made on the peptide or protein level since true positive spectra collapse first into peptides and then into proteins, whereas the false positives tend to be distributed randomly in the “decoy space.” The 965 spectra pointing to decoy proteins collapsed into 809 decoy peptides and 792 decoy proteins. A FDR of 1% on the spectra level can result in protein FDR levels of up to 8%–11% (Balgley et al. 2007). By eliminating 925 single hits with our manual validation (Supplemental Methods), in the best-case scenario we would have eliminated 95% of the assumed false positives and roughly 40 false positive spectra would remain among the forward hits. In the worst case these would point to 20 proteins and imply a protein FDR of 0.5%. Even if we assume that 200 false positive spectra would remain, our spectra, peptide, and protein FDR would maximally amount to 0.14%, 0.9%, and 2.9%, respectively.
Using this workflow, we identified 143,187 redundant and 22,248 distinct peptides, which correspond to at least 3599 distinct protein sequences in mature Arabidopsis thaliana pollen (Table 1); 3467 of these proteins (encoded by 3465 gene models) were identified by peptides of high information content (classes 1a, 1b, 2, 3a), allowing us to unambiguously assign either one protein sequence or the encoding gene model (Table 1). For two cases of proteins identified by class 1a peptides, we observed two closely related splice isoforms (Supplemental Fig. S4). For the significant amount of class 3b peptides (15.4% of our distinct peptide sequences), we report a minimal list of 132 protein identifications that could completely explain the experimental peptide evidence (Supplemental Table S1). However, if all proteins that could possibly be implied by the 3b peptides were considered to be present in the sample, they would amount to 2557 proteins, illustrating why these class 3b peptides are difficult to integrate into a reference data set (Table 1); hence, we excluded them from further functional analyses. The final list of the identified protein sequences, the contributing peptides, the information from previous transcriptomics and 2D gel proteomics experiments, and their evidence code are provided in Supplemental Table S1. An overview of the spectral and distinct peptide coverage of the 3467 proteins is provided in Supplemental Figure S5.
Our final reference data set of 3467 unambiguous protein/gene model identifications expands the previously described Arabidopsis pollen proteome by a factor of 13: Three 2D gel electrophoresis studies had identified between 95 and 135 distinct proteins each (Holmes-Davis et al. 2005; Noir et al. 2005; Sheoran et al. 2006) and a combined total of 266 distinct proteins (at the gene model level). Our proteomics data set shows a high overlap ranging from 82% to 97% with these previous data sets. Overall, only 28 proteins identified by the 2D gel electrophoresis analyses were missed in our study (Fig. 3A). For some of the 28 proteins we have class 3b peptide evidence, indicating that the overlap is even higher (Supplemental Table S2). All 12 proteins for which we have no peptide evidence were reported in the study by Sheoran and colleagues (Supplemental Table S2), with which we have the lowest overlap of 82% (Fig. 3A). This can, in part, be explained by the use of a different Arabidopsis accession as gene expression differences have previously been reported between Landsberg erecta and Col-0 (Schmid et al. 2003).
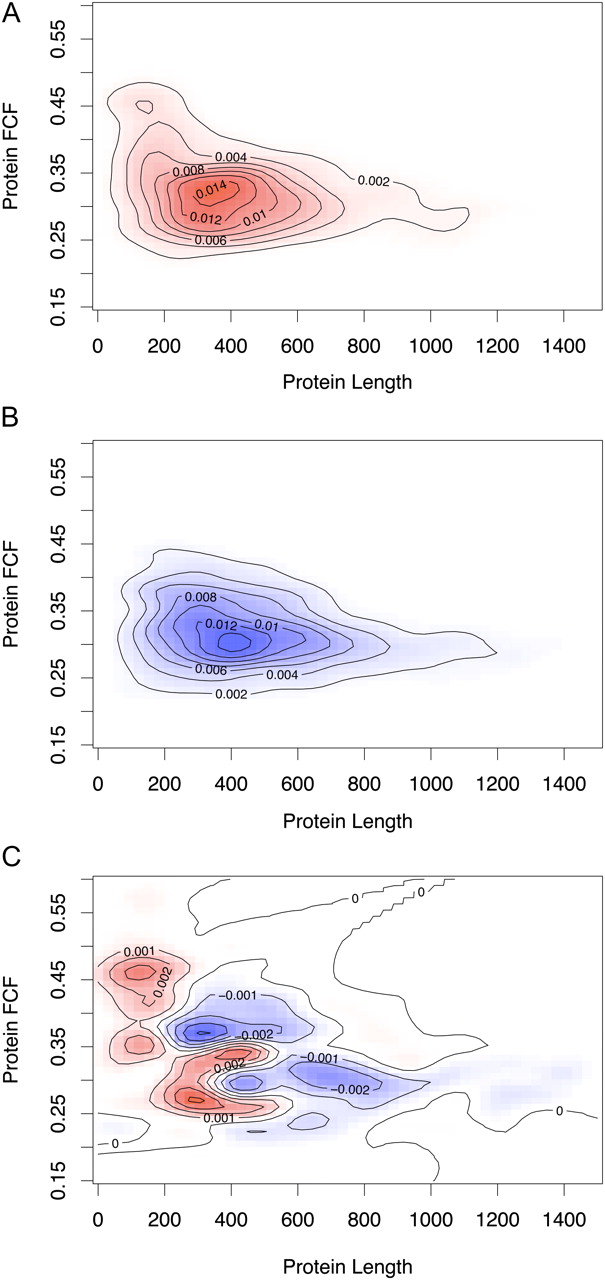
Venn diagrams visualizing the overlap of our pollen proteome data set with previous proteomics and transcriptomics studies. (A) Overlap of the gene models identified by four different proteomics studies of Arabidopsis mature pollen. The published gene model identifiers were compared to our 3465 gene models that encode 3467 proteins (classes 1a–3a). (B) Overlap of the mature pollen proteome with previous transcriptomics data sets, and (C) transcripts expressed in mature pollen versus those expressed in earlier stages of pollen development.
Integration of proteomics with transcriptomics data
To assess whether our shotgun proteomics data set contributed any novel insights into pollen biology we compared it to previous transcriptomics studies of mature pollen (Pina et al. 2005; Schmid et al. 2005) or pollen development (Honys and Twell 2004). Since the genome sequence and annotation have evolved significantly after the initial design of the probe sets for the ATH1 array (∼2001), we reanalyzed these data sets using publicly available, stringently remapped Affymetrix probe sets to exclude probes that hybridize to multiple genome locations. Previous studies had shown that a high percentage of false hybridization results could be eliminated in this manner (Dai et al. 2005), and that updated probe sets improved both the precision and accuracy of microarray data (Sandberg and Larsson 2007). Among a total of 21,022 gene models that provide unambiguous gene expression evidence (Supplemental Fig. S6), 11,150 (∼53%) are actively expressed during all stages of pollen development (Fig. 3B; Supplemental Table S3). In contrast, when we integrated the expression evidence from three studies on mature pollen (requiring an expression signal in at least three of the overall six arrays), only 6708 gene models (31.9%) are transcribed (Fig. 3C).
Integration of the reanalyzed transcriptomics data with our pollen data set (we only considered gene models identified by proteins of classes 1a, 1b, or 2) revealed that 537 gene models identified in the mature pollen proteome (15.5% of the entire data set) are either not represented on the ATH1 array (326) or no consistent expression evidence has been reported (211).
A comparison with the reanalyzed transcriptomics data from all four stages of pollen development (Honys and Twell 2004) (uninuclear microspores [UNM]; bicellular pollen [BCP]; tricellular pollen [TCP]) to the mature pollen (MP) proteome (Fig. 3C; Supplemental Table S4) revealed that >83% of the mature pollen proteome had a corresponding transcript detected in early pollen development. Transcripts of only very few proteins in our data set are specifically transcribed in mature pollen, such that either there is a significant delay between transcript and protein accumulation, or the proteins, but not their mRNAs, are very stable. Thus, many transcripts that are expressed during earlier stages of pollen development appear to be deposited as proteins in the mature pollen in preparation for the rapid physiological changes that occur during germination. Including our proteomics data, the number of expressed gene models in mature pollen amounts to 7901 (29.2% of the 27,029 protein-coding gene models of TAIR7), the number of expressed gene models during all stages of pollen development to 11,687 (43.2%; Supplemental Table S4).
To assess the correlation between protein abundance and gene expression signals, we compared the spectral count of proteins identified by peptides of classes 1a, 1b, and 2 to the average of the hybridization signals of the respective gene models in the data set of Schmid et al. (2005), the only mature pollen study with three replicates. We noted an overall positive, but weak correlation (Pearson correlation 0.25; Supplemental Fig. S7). Since the spectral count is biased by a number of factors including peptide detectability and protein length, we calculated the absolute protein expression measurement (APEX) values (Lu et al. 2007) for our pollen data set. The correlation of the APEX values and hybridization signals was higher (Pearson correlation 0.31; Supplemental Fig. S7B), similar to what had been reported for Saccharomyces cerevisiae and Escherichia coli (Lu et al. 2007). The low correlation can, in part, be explained considering that mature pollen was characterized by a broad range of expression levels including many low abundant transcripts (Schmid et al. 2005), and that correlations tend to be better for abundant transcripts and proteins (de Godoy et al. 2008). We further observed that gene models whose transcripts were expressed, but whose encoded proteins we did not detect, tended to have significantly lower hybridization signal distributions (Supplemental Fig. S7A). Overall protein detectability is one of the factors influencing this: The distribution of the mean peptide detectability values (an outcome of the training step for the APEX calculation) of identified proteins is significantly shifted to higher values compared to that of proteins we did not identify, but whose gene models were expressed (P-value < 1.5 × 10⁻¹⁰; Supplemental Fig. S7C). Finally, the abundance of proteins identified by 2D gel approaches is much higher than that of the 537 proteins we imply for the first time in pollen biology (Supplemental Fig. S8).
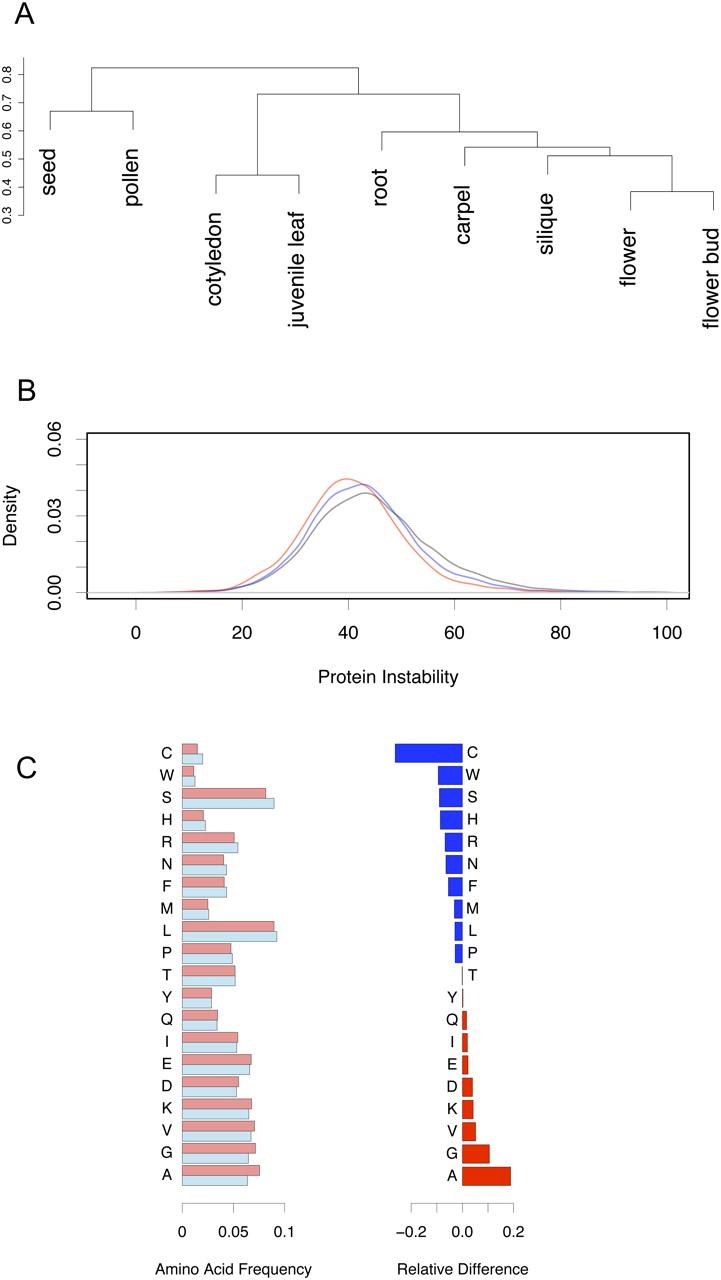
Our validated single hit protein identifications are significantly enriched for shorter proteins compared to those of rejected single hit proteins (P-value < 10−10). We used the favorite codon frequency (FCF) as an in silico predicted measure for protein abundance (Duret and Mouchiroud 1999), since we have no APEX values for the rejected single hits. The validated single hits are mainly proteins <500 amino acids (Fig. 4). For very short proteins <200 amino acids, higher protein abundance seems required in order to identify a protein by a single peptide. These results can be explained by the fact that fewer peptides can be detected for short and/or low abundant proteins. Our classification, which directed the focus of manual validation on the small, information-rich part (roughly 1% of all spectra) of our data set, allowed us to keep valuable single hit identifications, and showed that not all “one-hit wonders” (Veenstra et al. 2004) should be discarded per se.
Validated single peptide hit proteins tend to be shorter proteins of varying abundance. 2D density plots of protein length and predicted protein abundance based on FCF values for proteins identified by a validated single peptide hit (A, red), and proteins identified by a rejected single peptide hit (B, blue). (C) A different view of the previous plots (red, areas of relative overrepresentation of the validated single hit proteins; blue, areas where false-positive identifications are overrepresented) shows that validated single peptide hit identifications tend to be shorter proteins. Very short proteins that were successfully identified are preferentially higher abundant proteins.
Validation of proteome data by genetic studies
It is difficult to provide experimental validation for large-scale data sets as the one reported here. One way of assessing the quality of the pollen reference data set is to take advantage of the genetic tractability of Arabidopsis and to check for the presence of proteins that are known to play a role in pollen development. To this end, we used a set of 127 genes whose disruption causes a defect in pollen development or function (Supplemental Table S5). Since male transmission defects can arise at any stage of pollen development—pollen germination, pollen tube growth, guidance and reception, and double fertilization—we performed stage-specific comparisons between the proteome data set and genes exhibiting a pollen phenotype if mutated. Proteins suggested to be involved at early stages of pollen development (i.e., UNM, BCP) were not among the mature pollen proteome data set as expected (1/27). This finding, however, suggests that most of these gene products are not reused at later stages of pollen development or germination. In contrast, 67/100 mutations affecting mature pollen and pollen tube growth were represented in the mature pollen proteome. These included genes that are active throughout pollen development (CALS5, ADL1C, TPLATE) (Kang et al. 2003; Dong et al. 2005; Van Damme et al. 2006), genes with an enhanced activity in post-mitotic pollen grains (TUA1) (Carpenter et al. 1992), and genes affecting maturation of the pollen grain (VHA-A, GPT1) (Dettmer et al. 2005; Niewiadomski et al. 2005). Similarly, genes affecting pollen hydration, germination, and pollen tube growth were present: GRP17 (Mayfield and Preuss 2000), ACA9 (Schiøtt et al. 2004), SEC8 (Cole et al. 2005), POK (Lobstein et al. 2004; Guermonprez et al. 2008), VANGUARD1 (Jiang et al. 2005), ATAPY1 (Wolf et al. 2003), ATPPME1 (Tian et al. 2006) (Supplemental Table S5). In summary, our proteome data set included two thirds of the proteins known to affect the mature pollen grain or the growing pollen tube, while proteins that are required at earlier stages were not. The validation of 67 of the identified proteins by previous genetics studies, which identified 100 genes affecting the mature pollen, confirms that we obtained a rather comprehensive proteome of the mature pollen grain.
Comparison with an Arabidopsis protein tissue index
We compared our pollen proteome data set with a recently described Arabidopsis tissue index (Baerenfaller et al. 2008). The large number of protein identifications (13,029) was reported at the gene model level. Our mature pollen data set contributed 488 novel identifications, such that the total number of experimentally identified gene models in Arabidopsis increases to 13,517 gene models, i.e., a coverage of 50% of the protein-coding gene models of TAIR7. Among the nine tissues included in our further analysis (we did not consider the suspension cell culture data set), pollen has the lowest number of identified gene models (3465), while the most gene models have been identified in roots (6125; Supplemental Table S6).
We analyzed the percentage of gene models that show a tissue-restricted expression and observed the highest percentage of selectively expressed genes in roots (17.7% of all root gene models), closely followed by pollen (17.0%) and seed (13.6%) (Supplemental Table S6). These proteome-based results are comparable with results from large-scale transcriptome analyses (Schmid et al. 2005), where roots and seeds showed a larger number of specifically expressed transcripts than, for example, leaves (5.8% selectively expressed gene models in our study). A hierarchical cluster analysis of the gene models identified in the eight Arabidopsis tissues and the 3465 gene models identified in pollen suggested that pollen is quite dissimilar to the other tissues. Surprisingly, despite a distinct developmental origin and a different tissue composition, pollen clusters closest together with seed (Fig. 5A; Supplemental Fig. S9). This may, in part, be because pollen and seeds share physiological properties: Both survive for prolonged periods in a dehydrated state, and both are a means of dispersal, existing as independent organisms until germination.
Comparison of the mature pollen proteome with the proteomes of other Arabidopsis thaliana tissues. (A) Cluster dendrogram (Ward method) using the Jaccard-based distance as a measure of dissimilarity between protein lists. The clustering implies that pollen is quite dissimilar with respect to the other tissues; the most similar tissue is “seed.” (B) Proteins of mature pollen are preferentially stable proteins. The distributions of protein instability parameter values of several data sets are shown: 29,988 distinct TAIR7 protein sequences (black line), unambiguously identified proteins by Baerenfaller et al. (2008) (12,043; blue line), and unambiguously identified protein sequences in mature pollen (classes 1a, 1b, 3a; 3141 proteins; red line). (C) Amino acid frequency analysis of all mature pollen proteins versus all distinct proteins in TAIR7. The normalized frequency of the amino acids for both data sets is shown on the left (light red, mature pollen; light blue, TAIR7), and the relative difference on the right. (Blue) Amino acids occurring at a lower relative frequency in the pollen proteome; (red) amino acids with higher relative frequency.
To specifically compare the properties of the identified proteins rather than the gene models, we classified all peptides from the Baerenfaller et al. (2008) study according to our deterministic model and used 12,043 unambiguously identified protein sequences (classes 1a and 1b). In Figure 5B, we show that the distribution of values for the predicted parameter “protein instability” (computed at http://www.expasy.ch with the tool ProtParam) is statistically significantly lower for the proteins identified by Baerenfaller and colleagues compared to all distinct TAIR7 proteins (P-value < 10−10). A protein instability value <40 indicates that a protein is preferentially stable (Guruprasad et al. 1990). The proteins identified in mature pollen are significantly more stable, which may explain their survival in a dehydrated state; their value distribution compared to the tissue index data set is again statistically significantly shifted to lower values (i.e., more stable proteins, P-value < 10−10; Fig. 5B). Among the other eight tissues, we find that the protein instability value distribution of seed proteins is closest to that of mature pollen proteins. The parameter “protein instability,” which assesses dipeptide composition of proteins and was originally linked to in vitro protein stability (Guruprasad et al. 1990), thus appears to correlate with in vivo stability, since both seeds and pollen survive in a largely dehydrated state. Furthermore, a correlation of relative amino acid frequency with protein half-life had been reported by a study quantifying protein half-lives in vivo for >3750 proteins from S. cerevisiae (Belle et al. 2006). Alanine, glycine, valine, and lysine showed the highest relative frequency increase in the pollen proteome when compared to all distinct proteins of TAIR7 (Fig. 5C). These four amino acids had the strongest positive correlation with the protein log half-life (Belle et al. 2006), implying that they may have a role in protein stability. The frequencies of three amino acids with the strongest negative correlation with protein half-life, serine, asparagine, and histidine, were all underrepresented in the pollen proteome (Fig. 5C).
Functional analysis of the pollen proteome
To identify the overall trends of over- or underrepresentation of specific functional categories in the mature pollen proteome, we carried out a functional annotation using the systematic FunCat classification scheme (Ruepp et al. 2004). We analyzed three data sets: all protein-coding gene models of TAIR7 (27,029), the gene models identified in mature pollen (3465), and the gene models exclusively identified in our mature pollen proteome data set (537) (Fig. 3C). For this first-pass analysis we considered the first to third level FunCat annotations (Fig. 6; Supplemental Table S7). We noted a statistically significant overrepresentation of the first-level categories “metabolism,” “energy,” “protein fate,” “protein synthesis,” “cellular transport,” and “development,” while the categories “cell cycle,” “DNA processing,” “transcription,” and “unclassified proteins” (Fig. 6) were underrepresented. Functional categories such as metabolism and energy, shown to be predominant in previously reported pollen transcriptome and proteome studies, are also overrepresented in our proteome data set (Fig. 6). Even though physiological activity is kept at a minimum in the dehydrated, quiescent pollen, the onset of germination requires a burst of metabolism that needs to be energetically supported. Therefore, an overrepresentation of different metabolic and energy processes is expected in the mature pollen proteome. Among the 537 gene models providing novel insights, we find a higher proportion of unclassified proteins (Fig. 6), indicating a potential connection of unclassified proteins and processes important for pollen biology.
Functional analysis of the mature pollen proteome. Classification of the major FunCat categories for three data sets: all protein-coding gene models of TAIR7 (27,029), 3465 gene models identified in our mature pollen proteome study, and 537 gene models exclusively identified in our study. Asterisks indicate statistically significant over- or underrepresentation (for the comparison of the pollen proteome versus TAIR7, P-value < 0.05).
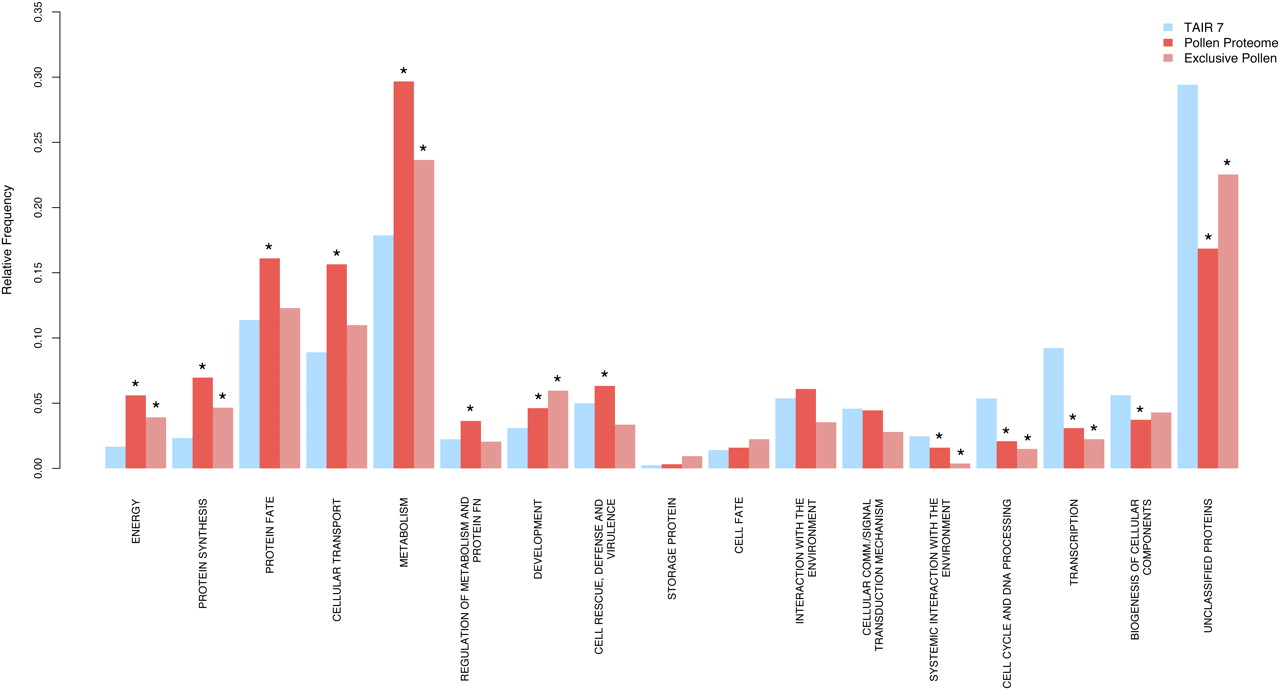
While statistically not significant (due to low representative number of gene models), the observed overrepresentation of the functional category “storage protein” (Fig. 6) supports the idea that the pollen grains do not store only transcripts (Becker et al. 2003; Honys and Twell 2003, 2004; Pina et al. 2005) but also proteins (Holmes-Davis et al. 2005), which will be used for pollen tube formation and growth. The categories “protein synthesis,” “protein fate,” and “regulation of metabolism and protein function” are also overrepresented in the mature pollen proteome (Supplemental Fig. S10). The translation of the stored transcripts is likely a prioritized event at germination and during the initial stage of pollen tube formation. Among “protein fate,” the subcategories “protein folding” and “protein stabilization” are overrepresented, indicating that, in addition to the higher stability of pollen proteins reported above, there are also factors that ensure protein stability in the dehydrated pollen grain. The subcategory “protein degradation” is also overrepresented (Supplemental Fig. S10). This may be related to the fact that many processes in plants are regulated by protein degradation (Lechner et al. 2006), and that the transition from a quiescent to a highly active metabolic state requires both protein synthesis and degradation.
Consistent with the crucial role of vesicle trafficking and secretion for rapid pollen tube growth, the category “cellular transport” is overrepresented in our data set (Fig. 6). The subcategories “protein transport,” “vesicular transport,” “cytoskeleton-dependent transport,” and “cellular export and secretion” are all essential to polarized tip growth (Supplemental Fig. S10). Polarized tip growth is regulated by small GTPases (Cheung and Wu 2008) and the finding that the subcategories “nucleotide exchange factor” and “regulator of G-protein signaling” are overrepresented (Supplemental Fig. S10) is consistent with the prominent role they play during pollen tube growth. These findings demonstrate, however, that all these functional categories are already present in the dehydrated, mature pollen grain, which is ready for a rapid germination and pollen tube growth, providing insights into the regulation of the switch from a quiescent to an active state.
The “cell cycle and DNA processing” category is underrepresented, which is expected, as in mature Arabidopsis pollen all the cellular components of the male gametophyte are formed and no cell division occurs. Transcription is another category that is underrepresented. Transcription factors are predominantly small, basic, low abundant proteins that are often missed in shotgun proteomic studies (Brunner et al. 2007; Baerenfaller et al. 2008). This finding is consistent with previous observations showing that transcription is not essential for pollen tube growth (Mascarenhas 1965; Onodera et al. 2008). Moreover, the subcategories of “transcription” showed the following trends: While “RNA synthesis” (of ribosomal, transfer, and messenger RNA) was underrepresented or absent, the subcategories related to the processing or modification of these RNAs were overrepresented (Supplemental Fig. S10). The transcripts stored in dehydrated pollen are likely to require the presence of specific proteins, such as RNA chaperones, RNA annealers, and RNA helicases (Rajkowitsch et al. 2007), which help the stored RNAs to get translated upon germination. Indeed, RNA helicases are highly overrepresented in the subcategory “RNA processing”: We identified 16 genes with predicted RNA helicase activity, two belonging to the Eukaryotic Initiation Factor 4A (EIF 4A) class, and 14 other helicases that also contain a DEAD/DEAH domain. We have also identified the two polyA-binding proteins (PABP) that are known to interact with EIF to regulate translation initiation (Kuhn and Wahle 2004) and show restricted expression in reproductive tissues, PAB3 and PAB5 (Belostotsky 2003). The overrepresentation of post-transcriptional processes in the mature pollen grain indicates that the processing and translation of stored transcripts is one of the first events triggered at germination and during initial pollen tube growth.
Analysis of protein domains and protein families indentified in the pollen proteome
The function of a protein is reflected by its functional domains. We carried out a comparative Pfam (Finn et al. 2008) analysis of the 3467 pollen proteins and the 29,988 distinct TAIR7 protein sequences. The overrepresented Pfam domains were related to protein folding and stabilization, small GTPase protein signaling, vesicle transport, cytoskeleton and cell wall reorganization, and calcium binding and transport (Supplemental Table S8). Underrepresented Pfam domain families included those present in F-box associated proteins, transcription factors, and membrane proteins (data not shown). In combination, the FunCat and Pfam analyses highlighted the importance of (1) the dehydrated state, (2) the rapid transition to a highly active physiological state, and (3) polar tip growth and associated signaling pathways.
The extreme dehydrated state of mature pollen requires factors that facilitate the long-term storage of proteins and lipids. One class of proteins associated with cellular tolerance to dehydration is the late embryogenesis abundant proteins (LEA), a family of low molecular weight proteins that are highly hydrophilic and heat stable. LEA proteins provide protection from dehydration not only in plants, but also in bacteria, cyanobacteria, nematodes, and rotifers, and are induced by either drying, freezing, or salt stress (Hong-Bo et al. 2005; Hundertmark and Hincha 2008). LEA proteins are represented in our data set with 14 members, five belonging to the LEA_4 group, the most prominent in Arabidopsis (Hundertmark and Hincha 2008), which also includes genes affecting gametophyte development (Pagnussat et al. 2005). Additionally, two of the three proteins of the PvLEA group, which get induced upon dehydration in the bean Phaseolus vulgaris, are present in the mature pollen proteome (Colmenero-Flores et al. 1999; Hundertmark and Hincha 2008). While having been studied extensively during seed development, the role of LEA proteins has been neglected in pollen studies.
The dehydrated state of pollen likely requires chaperones to facilitate conformational changes and stabilize stored proteins. Pfam analysis showed a significant overrepresentation of several domains required for chaperone function, such as heat shock proteins HSP70 and HSP90, chaperonin subunits CPN10 and CPN60_TCP1, DNAJ and DNAJ-C (J-domains associated with the HSP70 heat-shock system), and universal stress protein Usp (Supplemental Table S8). Pollen and seeds share several components related to desiccation, such as the LEA proteins and chaperones. Moreover, we found that, at the whole proteome level, these tissues are most similar to each other. We suggest that these findings are related to the fact that both mature pollen and seeds are a propagule for dispersal and survive prolonged periods in a desiccated state.
Neutral lipid granules present in seeds, the tapetum, and pollen oil bodies are maintained and stabilized by a layer of amphipathic lipids (phospholipids) and amphipathic structural proteins, the oleosins (Kim et al. 2002). Oleosin mutants were shown to affect the attachment of the pollen to the stigma surface and water uptake for germination (Mayfield and Preuss 2000). From the 16 Arabidopsis oleosin genes, we identified seven of the eight oleosins present in the anther tapetum, and two of the three oleosins expressed in both maturing seeds and microspores, but none of the oleosins specific to seeds (Supplemental Table S9). Importantly, we could identify tapetum oleosins, for which no gene expression was reported in pollen. This is consistent with oleosins being synthesized in the tapetum and then transferred onto the pollen grain as components of the exine (Fig. 1A).
The pollen proteome also revealed the complexity of apical tip growth (Fig. 7): While we detected all the proteins previously shown to be functionally important, we also show the presence of many additional members of these gene families. Vesicle trafficking, which ensures sustained tip growth, is regulated by small GTPases and SNAREs (soluble N-ethylmaleimide sensitive factor attachment protein receptors) (Cai et al. 2007). Protein domains specific to both classes of proteins were shown to be overrepresented by the Pfam analysis and, additionally, one third of the Arabidopsis predicted SNAREs (Sanderfoot et al. 2000) and nearly half of the predicted small GTPases (Vernoud et al. 2003) are present in the pollen proteome (Supplemental Tables S8, S9). The best represented families of small GTPases are the RAB family, with a critical role in determining the specificity of vesicle targeting, and the ARF (small ADP ribosylation factor) family, which is involved in the recruitment and assembly of the vesicle protein coat—clathrin and/or non-clathrin—from the cytosol onto the donor membranes. Members of the Rop/Rac GTPase family and their direct regulators, RopGEFs (GEF, guanine nucleotide exchange factor; Gu et al. 2006; Zhang and McCormick 2007; Kost 2008), were shown to regulate pollen tube tip growth (Fig. 7). Notably, only RopGEFs but no Rop/Rac GTPases were identified in the pollen proteome. Since the Rop/Rac GTPase transcripts were present in mature pollen but tip growth occurs only after germination, it is likely that these key regulators of tip growth are stored as transcripts in the mature pollen and are translated only upon hydration and germination.
Vesicle transport during pollen tube growth. The mature pollen proteome contains a wide range of proteins involved in vesicle transport processes (i.e., small GTPases and their regulators; SNAREs; the Rho-GDF refer to phosphoinositide-specific phospholipase C). Number of gene family members identified in the pollen proteome is listed over the total number of gene family members identified in the TAIR7 proteome. We were able to identify most of the potential members of protein complexes (i.e., Exocyst complex) shown to play a role for vesicle selection for exocytosis processes in yeast and animals. Additionally, we identified a family of proteins containing a domain of unknown function 1216 (DUF1216) that are predicted to play a role in vesicle transport.
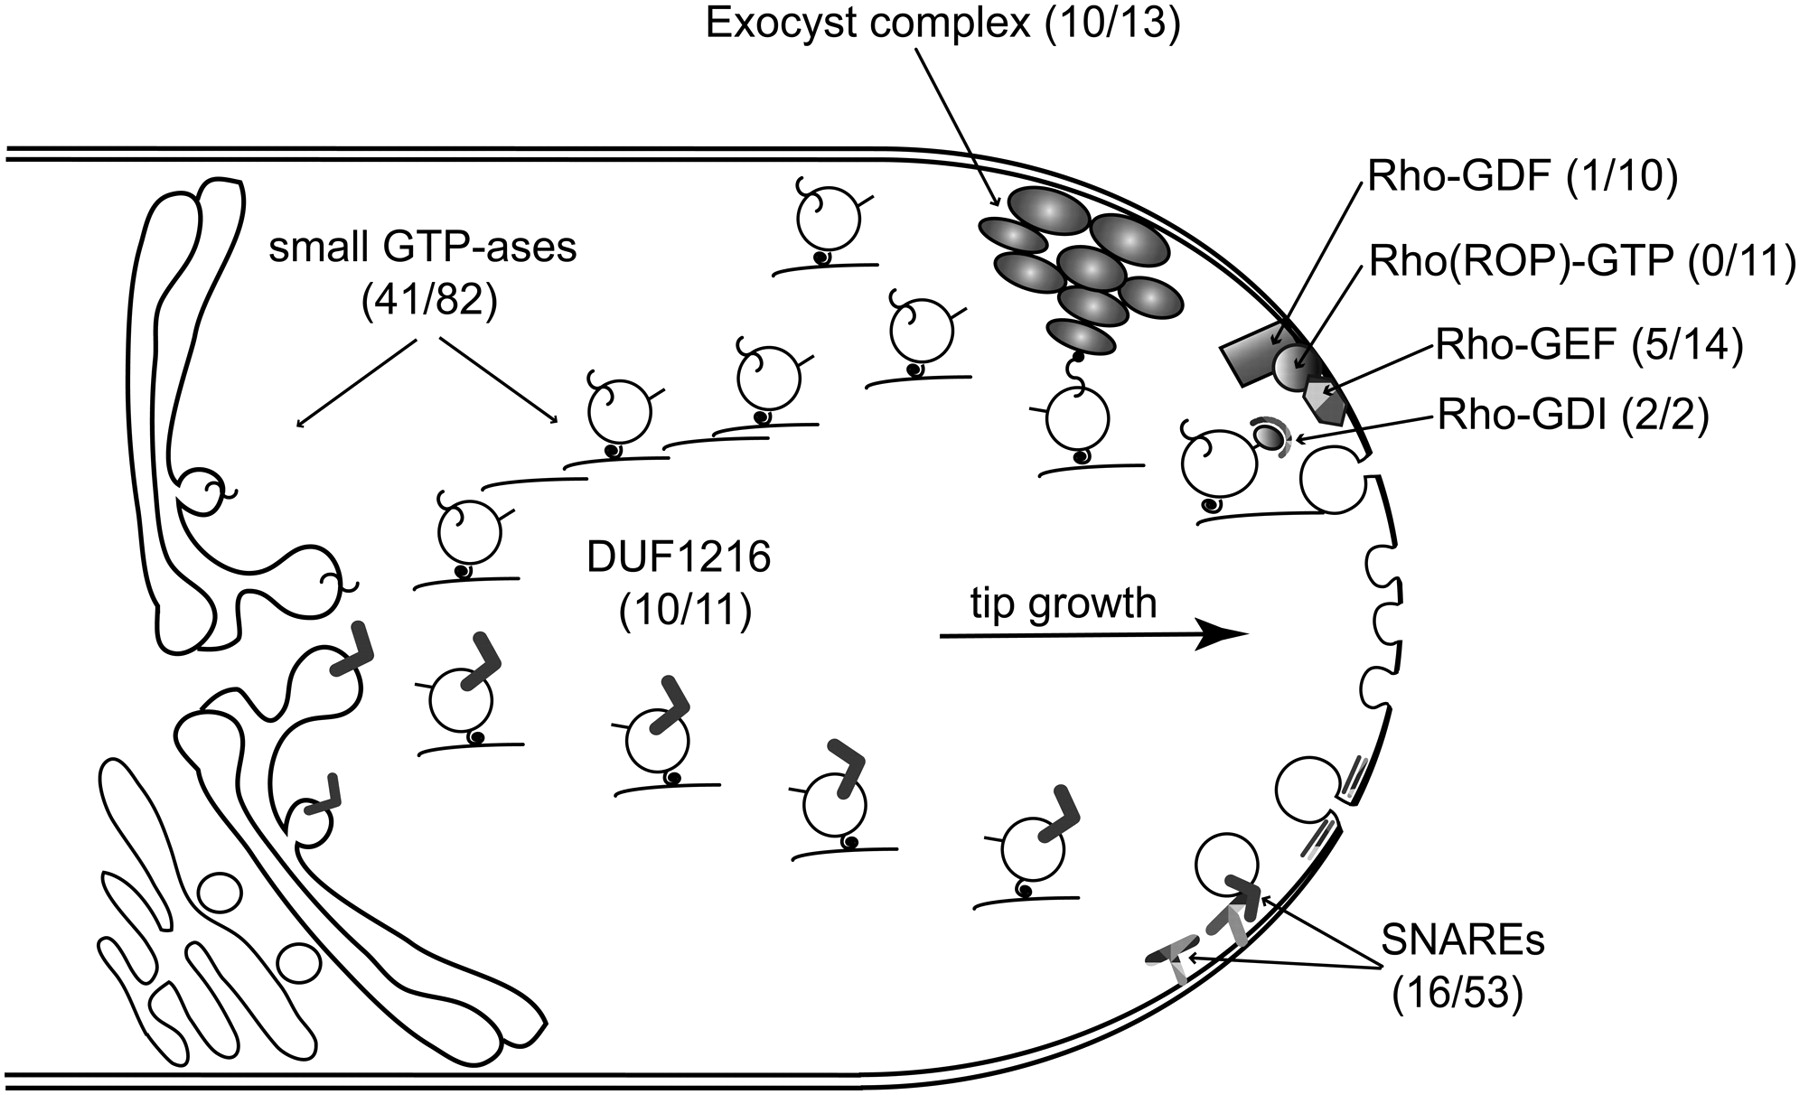
Homologs of SNARE proteins, regulators of vesicle fusion with the target membranes, were identified in the Arabidopsis genome and shown to affect male gametophyte development (Sanderfoot et al. 2000, 2001). All classes of SNAREs were overrepresented in the mature pollen proteome: the plant homologs of the syntaxin, synaptobrevin, and SNAP25 families (Supplemental Tables S8, S9). The Exocyst complex participates in targeted exocytosis by tethering vesicles to exocytic membrane regions (TerBush et al. 1996). In Arabidopsis, homologs of all eight members of the Saccharomyces cerevisiae Exocyst complex were predicted and a functional role in pollen germination and tube growth was shown for SEC3, SEC8, and EXO70A1 (Cole et al. 2005; Hala et al. 2008). We could identify in the pollen proteome the majority of the Arabidopsis putative Exocyst complex members: SEC3a, SEC5a, SEC5b, SEC6, SEC8, SEC10, SEC15a, SEC15b, EXO70-A2, and EXO70-C1, but not EXO84 (Supplemental Table S9).
Recently, reactive oxygen species (ROS) have been implicated in Rop GTPase-regulated polarized growth (Uhrig and Hulskamp 2006), but it is unclear how exactly ROS play a role in the regulation of pollen tube growth. In our data set, we could identify proteins involved in the ascorbate-glutathione cycle that scavenges hydrogen peroxide: L-ascorbate peroxidases (4/8; the latter number referring to the total number of proteins in this class among distinct TAIR7 proteins), glutathione dehydrogenases (2/5), and glutathione-disulfide reductases (2/2). We also identified proteins involved in the removal of superoxide radicals: catalases (2/3), Cu–Zn superoxide dismutases (2/3), a manganese superoxide dismutase (1/2), and an iron superoxide dismutase (1/3) (Supplemental Table S9). ROS may be involved in pollen-stigma interactions and pollen tube growth (McInnis et al. 2006; Potocky et al. 2007); ROS were detected at the pollen tube tip and also in the stigmatic papillae, to which the pollen adheres at pollination. Given the high level of ROS in the extracellular environment and the specific localization at the tip of the pollen tube, it seems likely that a balance of ROS production and removal in the pollen tube is crucial for the spatio-temporal distribution of ROS and may be required for normal tip growth. Moreover, the high level of ROS on stigmatic cells and its reduction in papillae to which a pollen grain adhered (McInnis et al. 2006) suggest a role of ROS in pollen germination.
Potential roles for proteins of unknown function in pollen development
Proteins containing the Pfam domain of unknown function DUF1216 (one or two copies) were among the most abundant proteins identified in the mature pollen proteome based on spectral counts (Supplemental Table S10): Four members were among the top 10 proteins AT3G28830.1, AT3G28790.1, AT3G28980.1, AT5G61720.1 (as reference, the oleosin GRP17 was the third most abundant pollen protein). With 10 of the 11 family members being present, the DUF1216 domain family was significantly overrepresented (P-value < 2.3 × 10⁻⁷; Supplemental Table S8). We were unable to find distant homologs or a predicted structure for this family using sensitive HMM-HMM (hidden Markov model) comparison methods. Our reanalyzed transcriptomics data indicated that eight of the 11 members are expressed in both early and late pollen stages; for two additional members represented by one ambiguous Affymetrix probe set, our proteomics data could unambiguously identify both proteins (Supplemental Table S10). Meta-analysis of transcriptomics data from various Arabidopsis tissues (Zimmermann et al. 2004) indicated that expression of the DUF1216 family is restricted to flowers, which contain pollen. So far, no mutant phenotypes have been described for any of the DUF1216 protein members, most likely due to their redundant function.
A proteome-scale probabilistic gene network generated by the integration of several high-throughput functional genomics data sets using a Bayesian framework allowed accurate prediction of gene function in yeast (Lee et al. 2004). A similar network analysis in Caenorhabditis elegans could place groups of unclassified genes into a functional context and enabled the accurate prediction of phenotypic effects following perturbation of gene function (Lee et al. 2008). We looked for predicted interaction partners of the DUF1216 family in an Arabidopsis gene network that covers 19,647 of the protein-coding genes in TAIR7 (72.7%); 3118 of the mature pollen gene models are represented in this network, accounting for 15.8% of the network nodes. For the five DUF1216 genes present in the network (all annotated with the cellular component GO category “endomembrane system”), 108 interaction partners were predicted by various lines of evidence. Our data integration revealed that we could find proteomics evidence (43 interactors) or transcriptomics evidence (53 interactors in mature pollen; 63 in earlier pollen stages), and combined evidence for pollen expression for a total of 67 predicted interactors (62%). Compared to 16% of interactors expected to be present, this is a highly significant enrichment (P-value < 2 × 10⁻²⁷). Furthermore, five mutants known to affect pollen development (Supplemental Table S5) were among these 67 interactors. Several of the interactors are annotated with functional GO categories associated with vesicle trafficking: t-SNARE activity (13 annotated gene models among 67 interactors, 19 in the entire network), SNAP receptor activity (3/7), and SNARE binding activity (2/5). In total, 18 out of 31 gene models in the network that belong to these vesicle trafficking categories are present (P-value < 1 × 10⁻⁷) (Supplemental Table S10; Fig. 7). Based on these findings, we predict that DUF1216 family proteins are involved in vesicle trafficking, highlighting the value of proteomic analysis in providing insights into proteins of previously unknown function.
Conclusion
We report an extensive proteomics reference data set for mature Arabidopsis pollen. Independent genetic evidence from pollen mutant studies support that our data set is of high quality and covers a significant part of the truly expressed pollen proteome. To address the protein inference problem typical of shotgun proteomics (Nesvizhskii and Aebersold 2005), we have developed a generic deterministic peptide classification scheme. This scheme enabled us to classify the peptide evidence according to information content, to infer a list of protein identifications with a minimum of false or ambiguous assignments, to focus the time-consuming manual validation on a small part of our data set (roughly 1%), and to seamlessly integrate transcriptomics data.
Based on the large fraction of low expressed genes in mature pollen (Schmid et al. 2005), we expected a significant percentage of single hit protein identifications. After manual validation, we only accepted 35% of the single hits, which were indeed significantly enriched for short and low abundant proteins as predicted. We demonstrate that manual validation of “one-hit wonders” (Veenstra et al. 2004) adds significant value to our data set, while concomitantly lowering the overall FDR at the spectra, peptide, and most dramatically at the protein level. Therefore, we believe that manual validation of information-rich single hit protein identifications could become a standard procedure for generating reference data sets using shotgun proteomics approaches.
For an optimal data integration, we selected the Arabidopsis TAIR7 database as a common reference point. Transcriptomics data were stringently reanalyzed against the TAIR7 genome release, while proteomics data was searched against the TAIR7 database using a decoy database strategy. The seamless integration of these data sets allowed us to provide novel insights into pollen biology and development. In many cases our classification enables us to report which of several possible proteins encoded by a gene model were actually observed, providing more information than the transcriptomics data. A detailed analysis of functional categories and protein domains illustrates the importance of stored proteins and post-transcriptional regulation for the rapid switch from a quiescent state to a rapidly growing pollen tube upon germination. In agreement with the existence of the pollen proteins in a desiccated state, we observed a significantly higher stability of pollen proteins compared to those expressed in other tissues. In summary, the mature pollen proteome reference data set reported here allowed us to propose functions for many previously uncharacterized proteins.
Our classification scheme supports future targeted quantitative proteomics studies. We have previously outlined how proteotypic peptides (PTPs, all peptides of classes 1a, 1b, and 3a that unambiguously identify one protein sequence) can be used to target and quantify a set of proteins relevant to a specific biological question, similar to a microarray experiment (Kuster et al. 2005; Ahrens et al. 2007). Experimental PTPs for protein families or entire signaling pathways of interest can be selected from our reference data set, and if needed, complemented with in silico predicted PTPs (Mallick et al. 2007). Their analysis by highly sensitive targeted single reaction monitoring measurements can provide complete quantitative data series that are paramount for systems biology and mathematical modeling approaches. Pollen, as a simple cell biological system, is particular amenable to such approaches.
Methods
Pollen collection and protein extraction
Arabidopsis thaliana plants of the Col-0 accession were grown under greenhouse conditions set at constant humidity (60%), following a 16-h light/8-h dark cycle at a temperature of 21°C day/16°C night. Highly pure mature pollen grains were collected as described in Supplemental Methods and stored at −80°C. Approximately 30–35 mg of pollen was used for a sequential protein extraction, using a series of four buffers as described in Supplemental Methods.
Isotope-coded affinity tagging (ICAT)
ICAT procedures were carried out according to the manufacturer's protocol for Cleavable ICAT Reagent Kit for Protein Labeling (Applied Biosystems). For details see Supplemental Methods.
Mass spectrometry
ESI-based LC-MS/MS was performed with a 2D linear ion trap, Finnigan LTQ (Thermo Electron Corporation) equipped with an Ultimate Nano HPLC System (Dionex Corporation). Samples were injected by a FAMOS Autosampler (Dionex Corporation) and separated on a custom-made reverse-phase tip column (0.075 × 100 mm) packed with C18 material (AQ, 3 μm, 200 Å, Bischoff GmbH). Peptides were analyzed at a flow rate of 250 nL/min of solvent A (5% acetonitrile, 0,2% formic acid in water). The elution of peptides (75 min) followed a gradient of 45% solvent B (80% acetonitrile, 0,2% formic acid in water) for 50 min and 100% solvent B for the next 15 min. Mass spectra were acquired in the mass range of 400–2000 m/z and up to six data dependent MS/MS spectra were recorded from a single survey scan.
In total, we performed 15 independent experiments accounting for 250 total mass spec runs (an overview of mass spectrometry runs is shown in Supplemental Fig. S2).
Classification of experimentally identified peptides
A novel, deterministic protein classification scheme based on the peptide information content was used in order to minimize errors by protein inference. For more details of the five peptide classes, see main text and legends of Table 1 and Figure 2B,C. Class 3a and 3b proteins are listed in Supplemental Table S1 but are not shown in PRIDE and/or in the AtProteome database. The method to infer a minimal list of proteins that explain all peptide evidence is detailed in the Supplemental Methods.
Functional classification
We classified the 27,029 protein-coding gene models of TAIR7 and the 3465 pollen proteome gene models according to the FunCat Database (http://mips.gsf.de/projects/funcat). P-values of over- or underrepresented functional classes were calculated based on hypergeometric tests (Fisher's exact test) and corrected for multiple testing with the 17 major categories shown. Asterisks shown in Figure 6 indicate a P-value < 0.05. For a more fine-grained functional analysis at the protein level, the 29,988 distinct TAIR7 protein sequences were searched against the Pfam database of hidden Markov models (release 22, July 2007, 9318 protein family models), as described (Brunner et al. 2007). The statistical significance of the overrepresentation of certain Pfam domain families among the 3467 experimentally identified proteins was assessed by hypergeometric tests (Fisher's exact test). The P-values were adjusted for multiple comparisons (for the 65 selected Pfam domain families shown in Supplemental Table S8) by using the routine p.adjust in R with the method “Holm.” We show both P-values before and after multiple testing correction (for domains with few members, a biologically relevant observation will often not be supported by the statistics after multiple testing correction).
Comparison of the pollen proteome with tissue-specific A. thaliana proteomes
Our pollen proteome data set was compared with an A. thaliana proteomics tissue index data set (Baerenfaller et al. 2008). The published peptide evidence was classified according to our novel classification scheme, and lists of identified gene models were compiled for each tissue (carpel, cotyledon, flower, flower bud, juvenile leaf, root, seed, and silique; data for cell suspension culture were not further considered in our comparative analysis). The Jaccard coefficient was used as a measure of similarity between the gene model lists, according to formula (1). Thus, the similarity of two lists is calculated from the size of the intersection of the two sets divided by the size of the union of the two sets.


This similarity was converted to a distance for the purpose of clustering according to formula (2). Hierarchical clustering was performed using the routine hclust in R (http://www.r-project.org) with the agglomeration method “Ward.” Clustering results are shown in Figure 4A as a dendrogram, and in Supplemental Figure S9 as a heatmap.
Gene expression data sets
Data from several previous transcriptomics studies on different stages of pollen development were downloaded and further processed: ArrayExpress accession no. E-MEXP-285 for the mature pollen data described in Pina et al. (2005); E-TABM-17 for the mature pollen data set from Schmid et al. (2005); Gene Expression Omnibus accession no. GSE6162 for the data set described in Honys and Twell (2004).
Remapping Affymetrix oligonucleotide probe sets
To apply the same stringency to the transcriptomics data set as to our proteomics data set, i.e., not considering evidence that points to several distinct gene models or protein sequences encoded by different gene models (class 3b), we remapped the Affymetrix probe sets against the TAIR7 database release using the custom CDF libraries (version 10) downloaded from the Brainarray microarray laboratory (http://brainarray.mbni.med.umich.edu/Brainarray/Database/CustomCDF/CDF_download_v10.asp) and eliminated probe sets that could be mapped to multiple positions in the genome (Supplemental Fig. S6; Supplemental Table S3). A detailed description of the remapping procedure is provided in Supplemental Methods.
Spectral counts and correlation to transcriptomics hybridization signal
CEL Files were processed using the Bioconductor implementation of the MAS5 algorithm for computing expression signals (Hubbell et al. 2002) and detection P-values (Liu et al. 2002). A probe set was called present if the detection P-value was <0.05. We only assessed the correlation of gene expression data and spectral counts for proteins of classes 1a, 1b, and 2, for which we can unambiguously assign the respective gene model.
Calculation of APEX values
We calculated the absolute protein expression measurement (APEX) for the pollen data set as described by Lu et al. (2007), using the 40 most abundant pollen proteins (based on total spectral counts) to create the training set, and an estimate of 2.5 × 10⁸ as the total number of protein molecules per cell. A detailed description of the APEX calculation procedure is given in the Supplemental Methods.
Amino acid frequency calculation
For each of the 29,988 distinct protein sequences in TAIR7 we calculated a 20-dimensional vector of frequencies of amino acids and normalized it using the protein length in order to remove the length bias. These vectors of normalized frequencies were summed up for the 29,988 distinct sequences and then divided with 29,988. The same procedure was repeated for the 3467 distinct protein sequences of our pollen proteome data set. Figure 5C (left) compares the absolute frequencies using a bar chart, Figure 5C (right) shows the relative amino acids frequency differences for the pollen proteome versus the distinct sequences of TAIR7.
Acknowledgments
We thank Edward Marcotte (University of Texas at Austin) for access to the unpublished AraNet interaction network; Robert Dudler, Stephen Schauer (University of Zürich), and two anonymous reviewers for helpful comments on the manuscript; Anna Tramontano (University of Rome “La Sapienza”) for help in structure prediction for the DUF1216 family; Ralph Schlapbach for access to the facilities of the Functional Genomics Center Zürich; Christian Panse for support of the database search pipeline; and Katja Baerenfaller for upload of the data in the AtProteome database. We thank Daniel Bollier (University of Zürich) for construction of the vacuum wand and gel cutter. The Center for Model Organism Proteomes is funded by the University of Zurich (http://www.mop.uzh.ch) as part of the University Research Priority Program Systems Biology/Functional Genomics. C.H.A. dedicates this work to the late Elke Ahrens and U.G. to the late Dmitry Belostotsky.
References
- ↵CH Ahrens E Brunner E Hafen R Aebersold K Basler . 2007. A proteome catalog of Drosophila melanogaster: An essential resource for targeted quantitative proteomics. Fly 1: 182– 186
- ↵K Baerenfaller J Grossmann MA Grobei R Hull M Hirsch-Hoffmann S Yalovsky P Zimmermann U Grossniklaus W Gruissem S Baginsky . 2008. Genome-scale proteomics reveals Arabidopsis thaliana gene models and proteome dynamics. Science 320: 938– 941
- ↵BM Balgley T Laudeman L Yang T Song CS Lee . 2007. Comparative evaluation of tandem MS search algorithms using a target-decoy search strategy. Mol Cell Proteomics 6: 1599– 1608
- ↵JD Becker LC Boavida J Carneiro M Haury JA Feijo . 2003. Transcriptional profiling of Arabidopsis tissues reveals the unique characteristics of the pollen transcriptome. Plant Physiol 133: 713– 725
- ↵A Belle A Tanay L Bitincka R Shamir EK O'Shea . 2006. Quantification of protein half-lives in the budding yeast proteome. Proc Natl Acad Sci 103: 13004– 13009
- ↵DA Belostotsky . 2003. Unexpected complexity of poly(A)-binding protein gene families in flowering plants: Three conserved lineages that are at least 200 million years old and possible auto- and cross-regulation. Genetics 163: 311– 319
- ↵LC Boavida JD Becker JA Feijo . 2005. The making of gametes in higher plants. Int J Dev Biol 49: 595– 614
- ↵RA Bradshaw AL Burlingame S Carr R Aebersold . 2006. Reporting protein identification data: The next generation of guidelines. Mol Cell Proteomics 5: 787– 788
- ↵E Brunner CH Ahrens S Mohanty H Baetschmann S Loevenich F Potthast EW Deutsch C Panse U de Lichtenberg O Rinner 2007. A high-quality catalog of the Drosophila melanogaster proteome. Nat Biotechnol 25: 576– 583
- ↵H Cai K Reinisch F-N Susan . 2007. Coats, tethers, rabs, and SNAREs work together to mediate the intracellular destination of a transport vesicle. Dev Cell 12: 671– 682
- ↵JL Carpenter SE Ploense DP Snustad CD Silfloway . 1992. Preferential expression of an alpha-tubulin gene of Arabidopsis in pollen. Plant Cell 4: 557– 571
- ↵S Carr R Aebersold M Baldwin A Burlingame K Clauser A Nesvizhskii . 2004. The need for guidelines in publication of peptide and protein identification data: Working Group on Publication Guidelines for Peptide and Protein Identification Data. Mol Cell Proteomics 3: 531– 533
- ↵AY Cheung HM Wu . 2008. Structural and signaling networks for the polar cell growth machinery in pollen tubes. Annu Rev Plant Biol 59: 547– 572
- ↵RA Cole L Synek V Zarsky JE Fowler . 2005. SEC8, a subunit of the putative Arabidopsis Exocyst complex, facilitates pollen germination and competitive pollen tube growth. Plant Physiol 138: 2005– 2018
- ↵JM Colmenero-Flores LP Moreno CE Smith AA Covarrubias . 1999. Pvlea-18, a member of a new late-embryogenesis-abundant protein family that accumulates during water stress and in the growing regions of well-irrigated bean seedlings. Plant Physiol 120: 93– 104
- ↵M Dai P Wang AD Boyd G Kostov B Athey EG Jones WE Bunney RM Myers TP Speed H Akil 2005. Evolving gene/transcript definitions significantly alter the interpretation of GeneChip data. Nucleic Acids Res 33: e175– 10.1093/nar/gni179
- ↵LMF de Godoy JV Olsen J Cox ML Nielsen NC Hubner F Frohlich TC Walther M Mann . 2008. Comprehensive mass-spectrometry-based proteome quantification of haploid versus diploid yeast. Nature 455: 1251– 1254
- ↵J Dettmer D Schubert O Calvo-Weimar YD Stierhof R Schmidt K Schumacher . 2005. Essential role of the V-ATPase in male gametophyte development. Plant J 41: 117– 124
- ↵X Dong Z Hong M Sivaramakrishnan M Mahfouz D Verma . 2005. Callose synthase (CalS5) is required for exine formation during microgametogenesis and for pollen viability in Arabidopsis. Plant J 42: 315– 328
- ↵L Duret D Mouchiroud . 1999. Expression pattern and, surprisingly, gene length shape codon usage in Caenorhabditis, Drosophila, and Arabidopsis. Proc Natl Acad Sci 96: 4482– 4487
- ↵JE Elias SP Gygi . 2007. Target-decoy search strategy for increased confidence in large-scale protein identifications by mass spectrometry. Nat Methods 4: 207– 214
- ↵RD Finn J Tate J Mistry PC Coggill SJ Sammut HR Hotz G Ceric K Forslund SR Eddy EL Sonnhammer 2008. The Pfam protein families database. Nucleic Acids Res 36: D281– D288
- ↵Y Gu S Li EM Lord Z Yang . 2006. Members of a novel class of Arabidopsis Rho guanine nucleotide exchange factors control Rho GTPase-dependent polar growth. Plant Cell 18: 366– 381
- ↵H Guermonprez A Smertenko M-T Crosnier M Durandet N Vrielynck P Guerche PJ Hussey B Satiat-Jeunemaitre S Bonhomme . 2008. The POK/AtVPS52 protein localizes to several distinct post-Golgi compartments in sporophytic and gametophytic cells. J Exp Bot 59: 3087– 3098
- ↵K Guruprasad BV Reddy MW Pandit . 1990. Correlation between stability of a protein and its dipeptide composition: A novel approach for predicting in vivo stability of a protein from its primary sequence. Protein Eng 4: 155– 161
- ↵SP Gygi B Rist SA Gerber F Turecek MH Gelb R Aebersold . 1999. Quantitative analysis of complex protein mixtures using isotope-coded affinity tags. Nat Biotechnol 17: 994– 999
- ↵M Hala R Cole L Synek E Drdova T Pecenkova A Nordheim T Lamkemeyer J Madlung F Hochholdinger JE Fowler 2008. An Exocyst complex functions in plant cell growth in Arabidopsis and tobacco. Plant Cell 20: 1330– 1345
- ↵PK Hepler L Vidali AY Cheung . 2001. Polarized cell growth in higher plants. Annu Rev Cell Dev Biol 17: 159– 187
- ↵R Holmes-Davis CK Tanaka WH Vensel WJ Hurkman S McCormick . 2005. Proteome mapping of mature pollen of Arabidopsis thaliana. Proteomics 5: 4864– 4884
- ↵S Hong-Bo L Zong-Suo S Ming-Ana . 2005. LEA proteins in higher plants: Structure, function, gene expression and regulation. Colloids Surf B Biointerfaces 45: 131– 135
- ↵D Honys D Twell . 2003. Comparative analysis of the Arabidopsis pollen transcriptome. Plant Physiol 132: 640– 652
- ↵D Honys D Twell . 2004. Transcriptome analysis of haploid male gametophyte development in Arabidopsis. Genome Biol 5: R85– 10.1186/gb-2004-5-11-r85
- ↵E Hubbell WM Liu R Mei . 2002. Robust estimators for expression analysis. Bioinformatics 18: 1585– 1592
- ↵M Hundertmark DK Hincha . 2008. LEA (Late Embryogenesis Abundant) proteins and their encoding genes in Arabidopsis thaliana. BMC Genomics 9: 118– 10.1186/1471-2164-9-118
- ↵L Jiang SL Yang L Xie CS Puah XQ Zhang WC Yang V Sundaresan D Ye . 2005. VANGUARD1 encodes a pectin methylesterase that enhances pollen tube growth in the Arabidopsis style and transmitting tract. Plant Cell 17: 584– 596
- ↵B-H Kang DM Rancour SY Bednarek . 2003. The dynamin-like protein ADL1C is essential for plasma membrane maintenance during pollen maturation. Plant J 35: 1– 15
- ↵A Keller AI Nesvizhskii E Kolker R Aebersold . 2002. Empirical statistical model to estimate the accuracy of peptide identifications made by MS/MS and database search. Anal Chem 74: 5383– 5392
- ↵HU Kim K Hsieh C Ratnayake AHC Huang . 2002. A novel group of oleosins is present inside the pollen of Arabidopsis. J Biol Chem 277: 22677– 22684
- ↵B Kost . 2008. Spatial control of Rho (Rac-Rop) signaling in tip-growing plant cells. Trends Cell Biol 18: 119– 127
- ↵U Kuhn E Wahle . 2004. Structure and function of poly(A) binding proteins. Biochim Biophys Acta 1678: 67– 84
- ↵B Kuster M Schirle P Mallick R Aebersold . 2005. Scoring proteomes with proteotypic peptide probes. Nat Rev Mol Cell Biol 6: 577– 583
- ↵E Lechner P Achard A Vansiri T Potuschak P Genschik . 2006. F-box proteins everywhere. Curr Opin Plant Biol 9: 631– 638
- ↵I Lee SV Date AT Adai EM Marcotte . 2004. A probabilistic functional network of yeast genes. Science 306: 1555– 1558
- ↵I Lee B Lehner C Crombie W Wong AG Fraser EM Marcotte . 2008. A single gene network accurately predicts phenotypic effects of gene perturbation in Caenorhabditis elegans. Nat Genet 40: 181– 188
- ↵WM Liu R Mei X Di TB Ryder E Hubbell S Dee TA Webster CA Harrington MH Ho J Baid 2002. Analysis of high density expression microarrays with signed-rank call algorithms. Bioinformatics 18: 1593– 1599
- ↵E Lobstein A Guyon M Ferault D Twell G Pelletier S Bonhomme . 2004. The putative Arabidopsis homolog of yeast Vps52p is required for pollen tube elongation, localizes to Golgi, and might be involved in vesicle trafficking. Plant Physiol 135: 1480– 1490
- ↵P Lu C Vogel R Wang X Yao EM Marcotte . 2007. Absolute protein expression profiling estimates the relative contributions of transcriptional and translational regulation. Nat Biotechnol 25: 117– 124
- ↵P Mallick M Schirle SS Chen MR Flory H Lee D Martin J Ranish B Raught R Schmitt T Werner 2007. Computational prediction of proteotypic peptides for quantitative proteomics. Nat Biotechnol 25: 125– 131
- ↵JP Mascarenhas . 1965. Pollen tube growth and RNA synthesis by tube and generative nuclei of Tradescantia. Am J Bot 52: 617–
- ↵JA Mayfield D Preuss . 2000. Rapid initiation of Arabidopsis pollination requires the oleosin-domain protein GRP17. Nat Cell Biol 2: 128– 130
- ↵S McCormick . 2004. Control of male gametophyte development. Plant Cell 16: S142– S153
- ↵SM McInnis R Desikan JT Hancock SJ Hiscock . 2006. Production of reactive oxygen species and reactive nitrogen species by angiosperm stigmas and pollen: Potential signalling crosstalk?. New Phytol 172: 221– 228
- ↵AI Nesvizhskii R Aebersold . 2005. Interpretation of shotgun proteomic data. Mol Cell Proteomics 4: 1419– 1440
- ↵AI Nesvizhskii A Keller E Kolker R Aebersold . 2003. A statistical model for identifying proteins by tandem mass spectrometry. Anal Chem 75: 4646– 4658
- ↵P Niewiadomski S Knappe S Geimer K Fischer B Schulz US Unte MG Rosso P Ache U-I Flügge A Schneidera . 2005. The Arabidopsis plastidic glucose 6-phosphate/phosphate translocator GPT1 is essential for pollen maturation and embryo sac development. Plant Cell 17: 760– 775
- ↵S Noir A Brautigam T Colby J Schmidt R Panstruga . 2005. A reference map of the Arabidopsis thaliana mature pollen proteome. Biochem Biophys Res Commun 337: 1257– 1266
- ↵Y Onodera K Nakagawa JR Haag D Pikaard T Mikami T Ream Y Ito CS Pikaard . 2008. Sex-biased lethality or transmission of defective transcription machinery in Arabidopsis. Genetics 180: 207– 218
- ↵GC Pagnussat HJ Yu QA Ngo S Rajani S Mayalagu CS Johnson A Capron LF Xie D Ye V Sundaresan . 2005. Genetic and molecular identification of genes required for female gametophyte development and function in Arabidopsis. Development 132: 603– 614
- ↵C Pina F Pinto JA Feijo JD Becker . 2005. Gene family analysis of the Arabidopsis pollen transcriptome reveals biological implications for cell growth, division control and gene expression regulation. Plant Physiol 138: 744– 756
- ↵M Potocky MA Jones R Bezvoda N Smirnoff V Zarsky . 2007. Reactive oxygen species produced by NADPH oxidase are involved in pollen tube growth. New Phytol 174: 742– 751
- ↵TS Price MB Lucitt W Wu DJ Austin A Pizarro AK Yocum IA Blair GA FitzGerald T Grosser . 2007. EBP, a program for protein identification using multiple tandem mass spectrometry datasets. Mol Cell Proteomics 6: 527– 536
- ↵L Rajkowitsch D Chen S Stampfl K Semrad C Waldsich O Mayer MF Jantsch R Konrat U Blasi R Schroeder . 2007. RNA chaperones, RNA annealers and RNA helicases. RNA Biol 4: 118– 130
- ↵A Ruepp A Zollner D Maier K Albermann J Hani M Mokrejs I Tetko U Guldener G Mannhaupt M Munsterkotter 2004. The FunCat, a functional annotation scheme for systematic classification of proteins from whole genomes. Nucleic Acids Res 32: 5539– 5545
- ↵R Sandberg O Larsson . 2007. Improved precision and accuracy for microarrays using updated probe set definitions. BMC Bioinformatics 8: 48– 10.1186/1471-2105-8-48
- ↵AA Sanderfoot FF Assaad NV Raikhel . 2000. The Arabidopsis genome. An abundance of soluble N-ethylmaleimide-sensitive factor adaptor protein receptors. Plant Physiol 124: 1558– 1569
- ↵AA Sanderfoot M Pilgrim L Adam NV Raikhel . 2001. Disruption of individual members of Arabidopsis syntaxin gene families indicates each has essential functions. Plant Cell 13: 659– 666
- ↵M Schiøtt SM Romanowsky L Bækgaard MK Jakobsen MG Palmgren JF Harper . 2004. A plant plasma membrane Ca2+ pump is required for normal pollen tube growth and fertilization. Proc Natl Acad Sci 101: 9502– 9507
- ↵M Schmid NH Uhlenhaut F Godard M Demar R Bressan D Weigel JU Lohmann . 2003. Dissection of floral induction pathways using global expression analysis. Development 130: 6001– 6012
- ↵M Schmid TS Davison SR Henz UJ Pape M Demar M Vingron B Scholkopf D Weigel JU Lohmann . 2005. A gene expression map of Arabidopsis thaliana development. Nat Genet 37: 501– 506
- ↵IS Sheoran KA Sproule DJH Olson ARS Ross VK Sawhney . 2006. Proteome profile and functional classification of proteins in Arabidopsis thaliana (Landsberg erecta) mature pollen. Sex Plant Reprod 19: 185– 196
- ↵PE Taylor KW Jacobson JM House MM Glovsky . 2007. Links between pollen, atopy and the asthma epidemic. Int Arch Allergy Immunol 144: 162– 170
- ↵DR TerBush T Maurice D Roth P Novick . 1996. The Exocyst is a multiprotein complex required for exocytosis in Saccharomyces cerevisiae. EMBO J 15: 6483– 6494
- ↵G-W Tian M-H Chen A Zaltsman V Citovsky . 2006. Pollen-specific pectin methylesterase involved in pollen tube growth. Dev Biol 294: 83– 91
- ↵JF Uhrig M Hulskamp . 2006. Plant GTPases: Regulation of morphogenesis by ROPs and ROS. Curr Biol 16: R211– R213
- ↵D Van Damme S Coutuer RD Rycke F-Y Bouget D Inzé D Geelen . 2006. Somatic cytokinesis and pollen maturation in Arabidopsis depend on TPLATE, which has domains similar to coat proteins. Plant Cell 18: 3502– 3518
- ↵TD Veenstra TP Conrads HJ Issaq . 2004. What to do with “one-hit wonders”?. Electrophoresis 25: 1278– 1279
- ↵V Vernoud AC Horton Z Yang E Nielsen . 2003. Analysis of the small GTPase gene superfamily of Arabidopsis. Plant Physiol 131: 1191– 1208
- ↵S Wolf S Grsic-Rausch T Rausch S Greiner . 2003. Identifcation of pollen-expressed pectin methylesterase inhibitors in Arabidopsis. FEBS Lett 555: 551– 555
- ↵Y Zhang S McCormick . 2007. A distinct mechanism regulating a pollen-specific guanine nucleotide exchange factor for the small GTPase Rop in Arabidopsis thaliana. Proc Natl Acad Sci 104: 18830– 18835
- ↵B Zhang MC Chambers DL Tabb . 2007. Proteomic parsimony through bipartite graph analysis improves accuracy and transparency. J Proteome Res 6: 3549– 3557
- ↵P Zimmermann M Hirsch-Hoffmann L Hennig W Gruissem . 2004. GENEVESTIGATOR. Arabidopsis microarray database and analysis toolbox. Plant Physiol 136: 2621– 2632
Notes
[5] [Supplemental material is available online at http://www.genome.org. The data from this study have been submitted to public protein repository PRIDE (http://www.ebi.ac.uk/pride/) under accession nos. 8743–8750.]
[6] Article published online before print. Article and publication date are at http://www.genome.org/cgi/doi/10.1101/gr.089060.108.