
Abstract
The view that changes to the control of gene expression rather than alterations to protein sequence are central to the evolution of organisms has become something of a truism in molecular biology. In reality, the direct evidence for this is limited, and only recently have we had the ability to look more globally at how genetic variation influences gene expression, focusing upon inter-individual variation in gene expression and using microarrays to test for differences in mRNA levels. Here, we review the scope of these experimental analyses, what they are designed to tell us about genetic variation, and what are their limitations from both a technical and a conceptual viewpoint. We conclude that while we are starting to understand the impact of this class of genetic variation upon steady-state mRNA levels, we are still far from identifying the potential phenotypic and evolutionary outcomes.
The conceptual framework
Direct analysis of the steady-state mRNA levels from individuals of the same species shows that the amount of mRNA can differ between individuals, suggesting that genetic variation can influence the amount of mRNA in a cell. Extending these observations in an attempt to establish the formal genetic basis for some of this variation is an area of research that was originally named “genetical genomics” by Jansen and Nap (2001) and is now more colloquially referred to as “expression genetics.”
Given the long-standing theoretical interest in variation in the control of gene expression as a driving force in evolution (King and Wilson 1975), there is surprisingly limited direct evidence for the importance of this type of genetic variation. For example, Bennett et al. (1995) suggested variation in DNA adjacent to the INS and IGF2 genes in humans results in changes to mRNA levels that are associated with susceptibility to type 1 diabetes, and Theuns et al. (2000) suggested variations in the promoter region of the PSEN1 gene contribute to an increased risk of early onset Alzheimer’s disease.
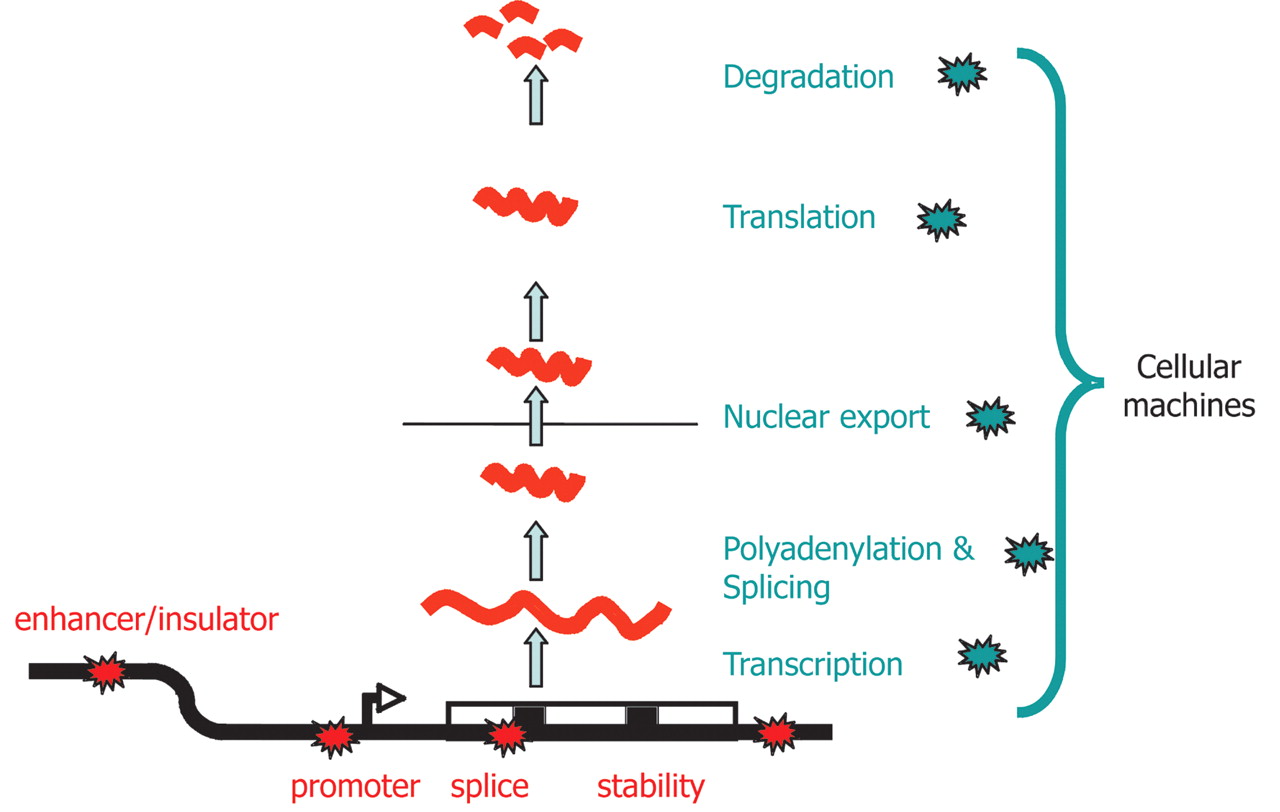
It is important to appreciate that variation in the amount of mRNA does not have to equate to variation in transcription per se. Figure 1 shows schematically the multiple processes that ultimately contribute to mRNA levels in a cell and it is clear that genetic variations in any part of this process could, in principle, result in changes of steady-state mRNA level. Many of these processes are controlled by molecular machines that contain 10 to hundreds of components (Maniatis and Reed 2002; Maciag et al. 2006; Tsankov et al. 2006), but we are not aware of any systematic studies of the extent of polymorphism in the components of these machines. We recognize that variation in the control of alternative splicing (for example, see Hull et al. 2007) can influence attempts to measure steady-state mRNA levels with gene-specific DNA probes, and we have not attempted to extend our review into this area.
Plausible sites of action for genetic determinants of mRNA levels. Genetic variations influencing gene expression may reside within the regulatory sequences, promoters, enhancers, splice sites, and secondary structure motifs of the target gene and so be genetically in cis (red stars), or there may be variations in the molecular machinery that interact with cis-regulatory sequences and so act genetically in trans (blue stars).
In recognition of this complexity, in this review we shall refer to all of these possible influences as being mediated by “regulators” without recognition of their biological role; we stress, regulator does not have to equate to transcription factor. We also describe all genes influenced by a regulator as being “regulated” or “influenced”, again, irrespective of the actual mechanisms involved.
At first sight, the fundamental question all studies are seeking to answer is the extent to which genes are, or are not, influenced by genetic variation and the nature of these influences. Unfortunately, our knowledge of gene expression suggests that this question is itself somewhat simplistic. Gene expression is in many, perhaps most cases, sensitive to externally imposed controls, so a gene may be influenced basally, that is, under all expression conditions, or it may be influenced conditionally due to genetic variation in the molecular machinery that controls mRNA levels during development or in response to environmentally specified changes. In multicellular organisms, this problem is further compounded by the potential differential control of genes within different cells or tissues. A very clear goal of some of these studies is to establish the extent to which this type of genetic variation is tissue specific, but it is important to recognize that this is itself only one of the relevant controls that apply to genes.
Expression genetics as a field is focused primarily upon mapping the genetic determinants of mRNA level variation, essentially treating mRNA levels as a continuously variable phenotype; these are analyzable as a quantitative trait or “QT”. Since mRNA is the result of gene expression, the phrase expression Quantitative Trait Locus, or “eQTL,” mapping has been coined to describe this analysis. For those not familiar with the terminology, it is important to realize that the term eQTL refers explicitly to the mapped locus that influences the variable mRNA level and not the mRNA expression trait (the QT) itself.
Steady-state mRNA levels of multiple genes can be measured either by microarrays or, less commonly, direct cDNA sequencing (for example, see Cowles et al. 2002). PCR-based detection (Singer-Sam et al. 1992) of expression from the two alleles of a gene encoding silent substitutions has also been used (for example, Yan et al. 2002) to detect variation in relative mRNA levels derived from individual alleles of a set of genes. Microarray analysis has been much more widely used and has the advantage over the other methods in that they contain near-global gene complements; microarray studies will be the primary focus of our review.
The experimental design of all of the studies we will review here is conceptually identical. The amount of steady-state mRNA in single or multiple tissues or the whole organism is measured in a panel of genetically typed individuals; next, a variety of statistical approaches are used to identify how changes in relative yield of mRNA across the panel may, or may not, correlate with genetic markers. Statistically significant correlation of mRNA level variation with particular markers then suggests that the markers define the approximate location of a variant regulator that influences the yield of mRNA.
In this review we first discuss the technical difficulties associated with analyzing microarrays in a genetic context; we then review the major studies undertaken in mammalian systems, with reference to key studies performed in yeast, and finally we discuss the major biological interpretations of data from expression genetics experiments. We draw attention to recent reviews from Rockman and Kruglyak (2006) and Gibson and Weir (2005), as well as a special issue of Mammalian Genome (June 2006), which contains several review articles on more specialized aspects of this field.
The technical analysis of microarray experiments
Using microarrays to measure mRNA levels is a powerful technique that is associated with numerous experimental artifacts, as well as having clear and reproducible outcomes (for review, see Microarray Quality Control Consortium 2006). From the perspective of expression genetics, microarrays have particular pitfalls with both experimental and data-analytic procedures that can dramatically influence the outcome of expression-mapping analyses. These problems, in part, are shared with any microarray analysis, but placed into the context of mapping panels, an artefact can be formally misinterpreted as an eQTL that alters the expression level of a gene that is not actually genetically variable in its expression. The outcome in many cases is erroneous identification both of which genes are linked and which regions of the genome harbor the eQTLs.
Relevant studies have identified the following: Doss et al. (2005) and Alberts et al. (2005) demonstrated artefactual cis-eQTL identification arising from SNPs in the mRNA target that is to be interrogated by a short hybridization probe that, as a consequence of a mismatch between probe and target, results in reduced hybridization in some genetic backgrounds but not others, quite irrespective of actual mRNA levels. Alberts et al. (2005) and Williams et al. (2006) identified that artefacts due to batch variation between groups of microarrays could result in spurious master-regulator eQTLs, which are eQTLs that are apparently linked/associated with large numbers of genes (see below for more extensive discussion). Williams et al. (2006) also showed that there could be poor concordance between eQTLs linked to a gene following normalization by several different, but widely used procedures for raw microarray data processing. Finally, Manly et al. (2005) showed that some arrays contain multiple probes that, in principle, represent the same gene, but these different probes identified different eQTLs.
Despite these complications, there is a substantial body of research reporting the outcome of expression genetic analysis and key studies are discussed immediately below.
Survey of key studies
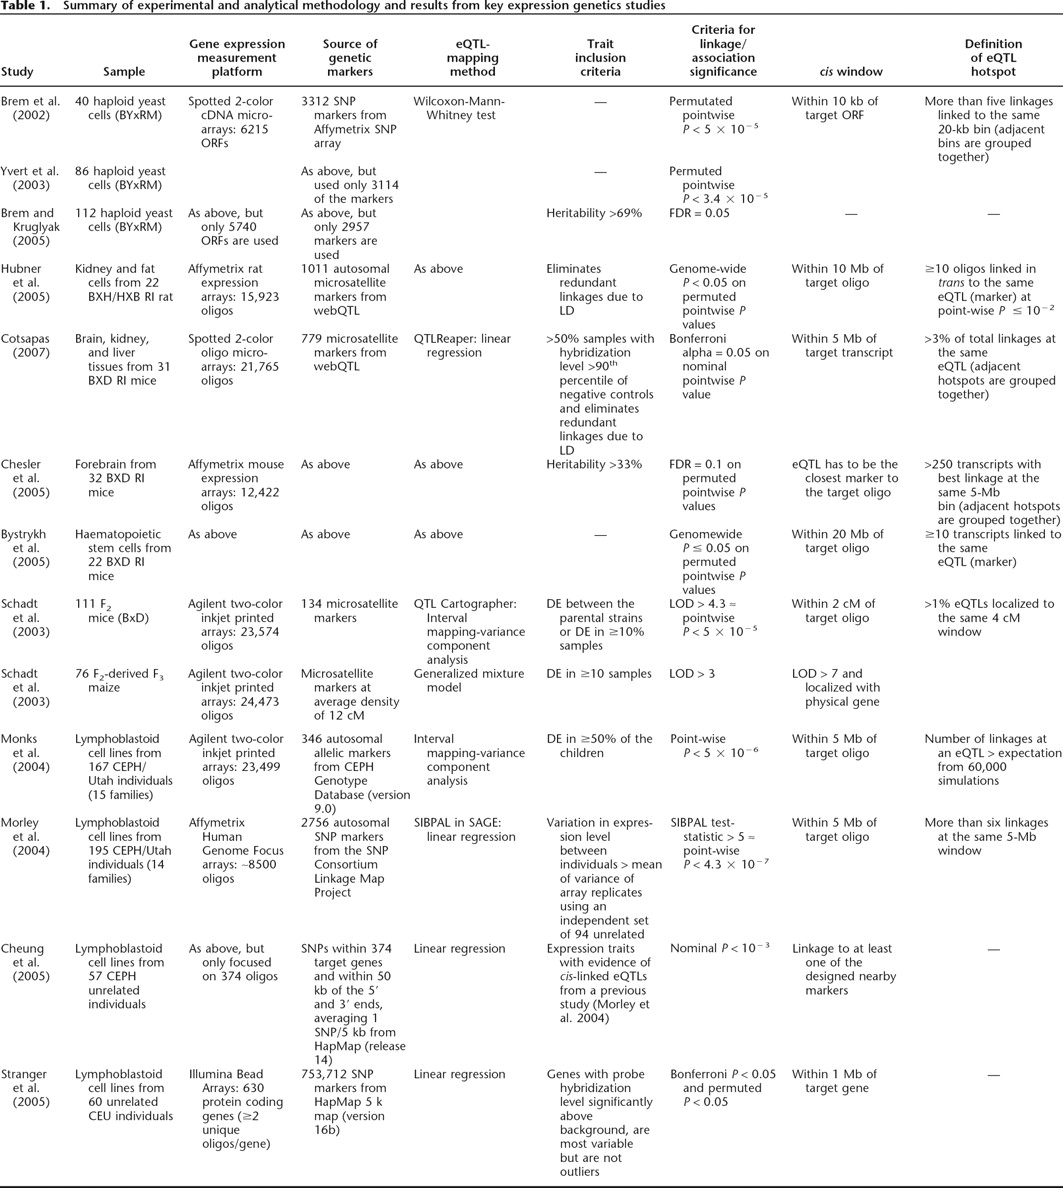
Table 1 lists key experiments at genome-wide scale that we believe represent the foundations of expression genetics. Inevitably, there are great experimental differences between these studies, including the organisms, the numbers of individuals, their genetic complexity (F2, haploid, inbred, outbred), the mRNA sources (tissue/cell types), microarray platforms, types and numbers of genetic markers (SNPs or longer repeats), inclusion criteria for mRNA levels that may have applied prior to analyses, methods of assessing eQTL-linkage/association, and methods of multiple testing correction and assessing significance. As a result of these disparities, it is perhaps not surprising that there are considerable inconsistencies between their results.
Summary of experimental and analytical methodology and results from key expression genetics studies
Bearing in mind the inherent differences between these studies, we now discuss how these eQTL-mapping studies have contributed to our understanding in four areas: the number of detectable genetic influences, the nature of the genetic influence, master regulators of gene expression, and finally, multiple genetic controls of gene expression variation.
The number of detectable genetic influences
One of the least consistent findings is the proportion of expression traits demonstrating linkage or association to at least one eQTL, which ranges from as little as 0.8% to as many as 59% of genes’ mRNA levels (Table 2). The lower limit of 0.8% is from an association study (Stranger et al. 2005) of 374 genes satisfying the inclusion criteria that the overall hybridization level and variance is high in 60 samples of unrelated humans. Of these 374 transcripts, only 0.6% were associated with an eQTL, defined by a Bonferroni cut-off of 0.05. In contrast, the upper limit of 59% is from a linkage study (Brem and Kruglyak 2005), which detected at least one eQTL for 2984 genes, defined by a false discovery rate (FDR) cut-off of 0.05. Many of these differences can be explained by the dissimilarity in experimental methodology, but on average, at least one eQTL can be detected for between 10% and 30% of investigated genes (see Table 2).
Summary of the nature of genetic influence upon gene expression
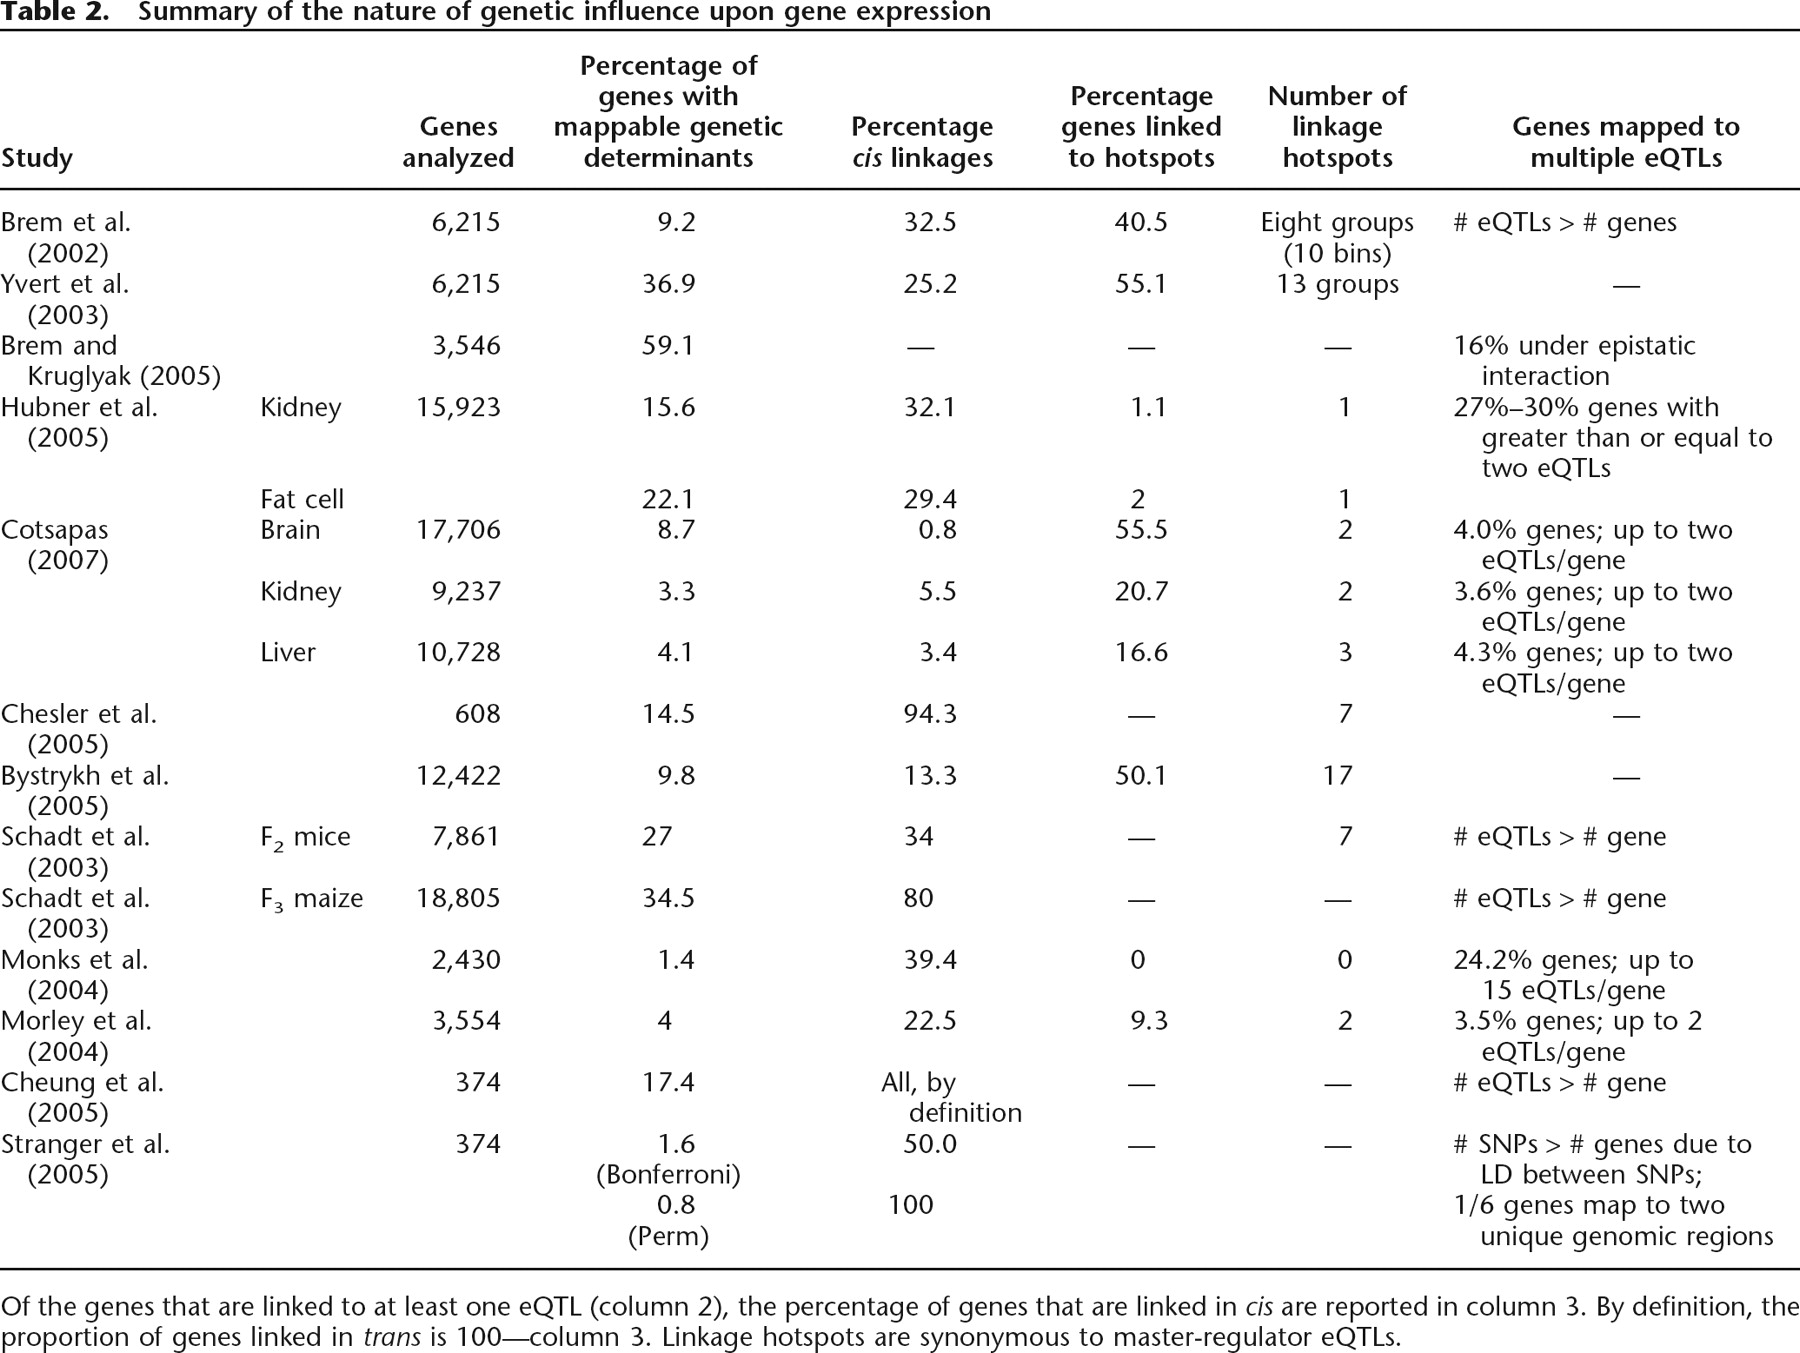
Of the genes that are linked to at least one eQTL (column 2), the percentage of genes that are linked in cis are reported in column 3. By definition, the proportion of genes linked in trans is 100—column 3. Linkage hotspots are synonymous to master-regulator eQTLs.
Statistical power also has a large impact upon the number of genes for which an eQTL can be identified. For example, Brem et al. (2002) using 40 haploid yeast samples identified an eQTL for 9% of genes at P < 5 × 10⁻⁵, whereas Yvert et al. (2003) using almost identical methodology and 86 haploid yeast samples identified an eQTL for 40% of genes at a P < 3.4 × 10⁻⁵. Since the major difference between these two studies is predominantly sample size, these results suggest that a doubling in sample size could potentially increase the power of eQTL detection by fourfold. An important take-home message in expression genetics is that the size of the mapping panel is an important determinant of success, a lesson well documented in the mapping of complex human disorders.
The nature of variation: cis- versus trans-acting variation
Genetic variations influencing gene expression may be within the regulatory sequences, such as promoters, enhancers, splice sites, or secondary structure motifs of the target gene, and so are genetically in cis, or they may be variations in the proteins and RNAs that interact with cis-regulatory sequences and so are genetically in trans (Fig. 1). As the gene associated with each mRNA expression trait can be physically mapped onto the genome, the mechanism (cis-acting or trans-acting) by which an eQTL influences an expression trait can be inferred from the proximity between the physical location of the cognate gene and the eQTL. This process can be confounded by trans-acting influences that by chance map within the appropriate window that is being used to define cis (Ronald et al. 2005). To overcome the logical difficulty presented by a closely linked trans-regulator, Rockman and Kruglyak (2006) distinguish between local and distant linkage rather than cis or trans; this terminology reflects the difficulty of using eQTL studies to dissect explicit molecular mechanism in these special cases. Perhaps more subtly, the extent of linkage disequilibrium will also determine the precision with which location can be defined; in genetic panels created with crosses involving small numbers of recombinations, or in closely related individuals, the lengths of genetically identical DNA are extensive and may preclude separation of a trans eQTL and its cognate gene located in the same genomic region, even over quite large distances.
Table 2 shows that as few as 0.8% and as many as 94% of genes have an eQTL in cis and predictably the number observed is dependent upon both the size of the cis-window (the genomic distance between the gene and the eQTL) used to define cis-linkage/association and on the significance level used for defining linkage/association between trait and eQTL. The location(s) of regulatory elements are not well defined for most genes, and consequently, choices of cis-window sizes vary across eQTL-mapping studies, ranging from 10 kb in Yeast (Brem et al. 2002) to 20 Mb in mouse (Bystrykh et al. 2005). We note that there are documented cis-acting regulatory elements that are located >1 Mb from the gene they control (Pfeifer et al. 1999), so these windows are not implausible. Unsurprisingly, the larger the cis-window, the more likely it is to find an expression trait located within the cis-window of the corresponding eQTL. For instance, in our three-tissue BXD studies using a 5-Mb cis-window, ∼2.6% of linkages are in cis, and this proportion increases to ∼8.0% at 20 Mb; in a similar study in mice, Bystrykh et al. (2005) detected 13.3% of linkages in cis, using a 20-Mb window.
Hubner et al. (2005), Monks et al. (2004), and Schadt et al. (2003) all report that the proportion of cis-acting eQTLs increases with higher linkage or association-significance thresholds, suggesting that cis-acting compared with trans-acting eQTLs have a stronger and more detectable influence on gene expression. Petretto et al. (2006) analyzed four tissues in the rat and showed that trans-eQTLs generally have smaller effect size and higher false discovery rates than cis-eQTLs. Overall, a general conclusion from these studies is that, presently, putative cis-regulatory variation is more readily detectable than trans.
Master regulators of gene expression
Genetic variation in a protein such as a transcription factor that controls the expression of multiple genes is likely to have an influence on all or most of its target genes. This class of variation is of particular biological interest because, in principle, it can be used to identify groups of genes that share common control (formally “regulons”). Correlated variation in groups of, as well as individual genes, may have significant phenotypic consequences.
Such genetic variations have been detected as eQTLs that show linkage/association to a large number of genes, and these have been termed master regulators (Morley et al. 2004). The rules for defining the “same” eQTL are varied; some studies simply count the number of expression traits that best map to a genetic marker regardless of whether the linkage/association is significant at a whole-genome level or not (Chesler et al. 2005), some count the number of whole-genome significant linkages at each marker (Bystrykh et al. 2005; Hubner et al. 2005; Cotsapas 2007), and some first divide the genome into bins, then count the number of significant linkages within each bin (Brem et al. 2002; Schadt et al. 2003; Yvert et al. 2003; Morley et al. 2004). In these studies, as many as 50%–55% of all mappable expression traits have been shown to map up to 17 master regulators (Table 2).
Several reports have suggested that master regulators may be caused by systematic microarray artefacts (Alberts et al. 2005; Li and Burmeister 2005; Williams et al. 2006). Microarray hybridization reactions are complex experimental processes, which measure a combination of biological signal and experimental noise. Normalization is applied to microarray data to remove any sources of nonbiological variation such as within-array differences in hybridization efficiency, but it can be difficult to dissect the biological signal from the noise. Commonly, even after normalization, on some arrays groups of genes can have higher or lower expression relative to the other arrays. In the context of expression genetics, groups of genes that vary coordinately across a panel of individuals can show evidence for linkage to a single eQTL, thus causing spurious master regulators.
Despite these systematic artefacts, Monks et al. (2004) failed to identify an eQTL in human B-cell lines where the number of mapped expression traits exceeded random expectation, suggesting master regulators are not a universal feature.
Multiple genetic regulators of gene expression
As we have discussed above, the regulation of the mRNA level of a single gene is likely dependent on many factors (see Fig. 1), and so may be potentially influenced by more than one genetic variant. In traditional genetic linkage and genome-wide association studies where a single, or a small number of quantitative traits are considered, identification of multiple genetic variants is already difficult because of the statistical complexity and large computational demands imposed by the combinatorial calculations required to test multiple associations. This complexity is compounded in eQTL-mapping studies where up to tens of thousands of expression traits are of interest, and so it is nearly impossible to perform a systematic search for multiple genetic influences. For this reason, all eQTL-mapping analyses listed in Table 1 used single-locus methods, where only one locus is assessed at any one time for linkage/association to each expression trait.
Although these analyses are not explicitly designed to detect multiple influences, expression traits that map to more than one eQTL have indeed been identified (Brem et al. 2002; Schadt et al. 2003; Monks et al. 2004; Morley et al. 2004; Brem and Kruglyak 2005; Cheung et al. 2005; Hubner et al. 2005; Stranger et al. 2005; Cotsapas 2007).
The identification of multiple linkage peaks is not straightforward; simulation studies combined with empirical data have been conducted to predict whether gene expression is likely influenced by multiple genetic loci, and if so, to estimate the number of loci that may contribute to the gene-expression variation (Brem et al. 2002; Brem and Kruglyak 2005). These results show that only 3% of highly heritable traits will be influenced by a single locus, while >50% of the traits are likely to be under the influence of more than five eQTLs. Storey et al. (2005) presented a multilocus mapping method designed for a large number of expression traits, and using this method Brem et al. (2005) demonstrated that the mRNA levels of 65% of genetically influenced genes are influenced by pairs of eQTLs (locus pairs), while only 13% of locus pairs identified using a single-locus mapping method are likely to have significant interaction.
Summary
eQTL-mapping analyses can be used to dissect the genetic regulatory architecture of gene expression. From the studies that have been published so far, we have learned that: (1) genetic influences upon steady-state mRNA levels are common; (2) cis-acting variants are more readily detected than trans-acting variants; (3) the majority of genetically influenced transcripts are likely to be influenced by multiple genetic variants, and thus, we need to develop further methodology that can perform multilocus mapping in these settings. Combined with a pressing need to increase the size of mapping panels to increase statistical power, this presents a formidable technical challenge. A more disappointing general observation is that the ability to combine independent studies, even those carried out upon the same organism, is severely compromised by the multiplicity of mapping panels, genetic markers, statistical methodologies, genes on arrays, and array platforms.
The biological interpretation of expression genetics data
The technical difficulty of expression genetic analyses has led to the development of complementary analytical methods in an attempt to leverage more useful and potentially directly interpretable biological information from the data. These studies can be broadly categorized into five main classes: (1) studies that correlate expression variation with variation in physiological traits; (2) studies focused on regulator genes within eQTLs; (3) studies focused on regulated genes; (4) studies that focus on the genetic determinants of mRNA levels in known signaling and metabolic pathways; (5) the tissue specificity of genetic influences.
Correlation with physiological traits
Treating mRNA levels as an “intermediate phenotype” that could link variation in genetic information to physiological traits was a primary driver of the development of expression genetics and Schadt et al. (2003), Bystrykh et al. (2005), Chesler et al. (2005), Hubner et al. (2005), and Li et al. (2006a) identified correlation between genetically influenced expression and a variety of traits. The logic of these analyses is that a gene with a variable mRNA level found to be located under a linkage peak associated with a physiological QTL is a potential causal candidate. Of course, if the mRNA level variation itself directly correlates with the physiological trait, then this would be strong support for a causal relationship. Bystrykh et al. (2005) found eight genes with cis-acting genetic influence overlapping a physiological QTL affecting hematopoietic stemcell (HSC) turnover independently identified by de Haan et al. (2002) in BXD mice. Three of the genes had been identified as candidate genes in the original study, and all eight contained sequence polymorphisms. Chesler et al. (2005) correlated the expression levels of the Drd2 gene with published phenotypes from the BXD inbred mouse panel and identified significant correlations for a number of phenotypes including ethanol preference and locomotor activity.
Identification of candidate regulator genes within eQTLs
The size of eQTL linkage peaks has meant that there are few reports that identify the causative variation within the eQTL: eQTLs defined in RI strains, for example, commonly contain 10–100’s of genes. Exceptions are the works reported by Zhu et al. (2004), Schadt et al. (2005), and Mehrabian et al. (2005), who combined sequence data with expression mapping and phenotypic measurements in a sophisticated analysis using conditional independence modeling that infers causal relationships between mRNA expression levels and phenotypes. These approaches enabled Mehrabian et al. (2005), for example, to identify 5-lipoxygenase as the susceptibility gene for obesity and bone traits within an eQTL previously identified by Schadt et al. (2003) in an F2 cross of C57BL/6J and DBA/2J.
Identification and validation of regulated genes, or regulons
Other studies have attempted to focus on groups of genes (“regulons”) that are likely to be influenced by genetic variation: a key concept here is the notion of identifying genes whose correlated pattern of expression across different backgrounds implies the existence of common regulators. Lan et al. (2006) further demonstrated the utility of this approach on expression data from the livers of an F2 mouse panel segregating for obesity and diabetes; initially they identified genes whose mRNA levels were likely to be cis- or trans-regulated, and they then treated these genes as “seeds” and expanded the composition of these sets by identifying those genes most closely correlated with them. Analysis using Gene Ontology showed that many of the sets of genes defined by the “seed” were functionally related and/or function in the same pathways involved in lipid metabolism. Using the linked gene, Scd1, known to be involved in lipid metabolism and insulin sensitivity, as a seed, the authors identified and experimentally demonstrated that the gene 3110032G18Rik is reciprocally regulated with known lipogenic genes in a variety of contexts.
A similar approach was taken by Ghazalpour et al. (2006) who generated networks based upon correlated mRNA levels of genes expressed in the liver of a panel of female mice from an F2 intercross of C3H/HeJ and C57BL/6J. By defining groups of potentially coregulated genes (or “modules”) using correlation, and then identifying eQTLs multiply linked to genes in a module, they identified modules that were likely to be under genetic influence: an approach they describe as “module-QTL,” or mQTL. Their analysis identified a set of coexpressed genes that collectively demonstrated linkage to four eQTLs, and explained 70% of the variance for body weight in the F2 population.
Identifying genes with correlated expression across different genetic backgrounds even in the absence of identifiable eQTLs can potentially uncover a broader range of influences than that found by linkage/association analysis, albeit with some difficulty in estimating the overall reliability through false positive and false negative rates (for further discussion, see Lan et al. 2006). Lee et al. (2006) distinguished two mechanistically distinct genetic influences of regulators, those mediated via changes in abundance (trans-expression regulators) and those mediated by structural variants (trans-genotype regulators). To build upon these concepts, Lee et al. (2006) developed and used Geronemo, which computes the probability, based upon correlations, that any group of genes’ variability can be explained by combinations of trans-expression and trans-genotype regulators; these included signaling molecules, chromatin-modifying factors, transcription factors, and proteins involved in mRNA processing, export, and post-transcriptional modification. The application of this method was demonstrated in the 112 progeny of a wild and laboratory strain of Saccharomyces cerevisiae (data from Brem and Kruglyak 2005), and highlighted the likely role of chromatin-remodeling factors, particularly the SWI/SNF complex, in explaining a significant proportion of the observed expression variance. Although the methods developed by Lee et al. (2006) are, in principle, applicable to higher-eukaryotic regulation, the approach is presently limited by the lack of specific functional annotation of many genes in higher organisms.
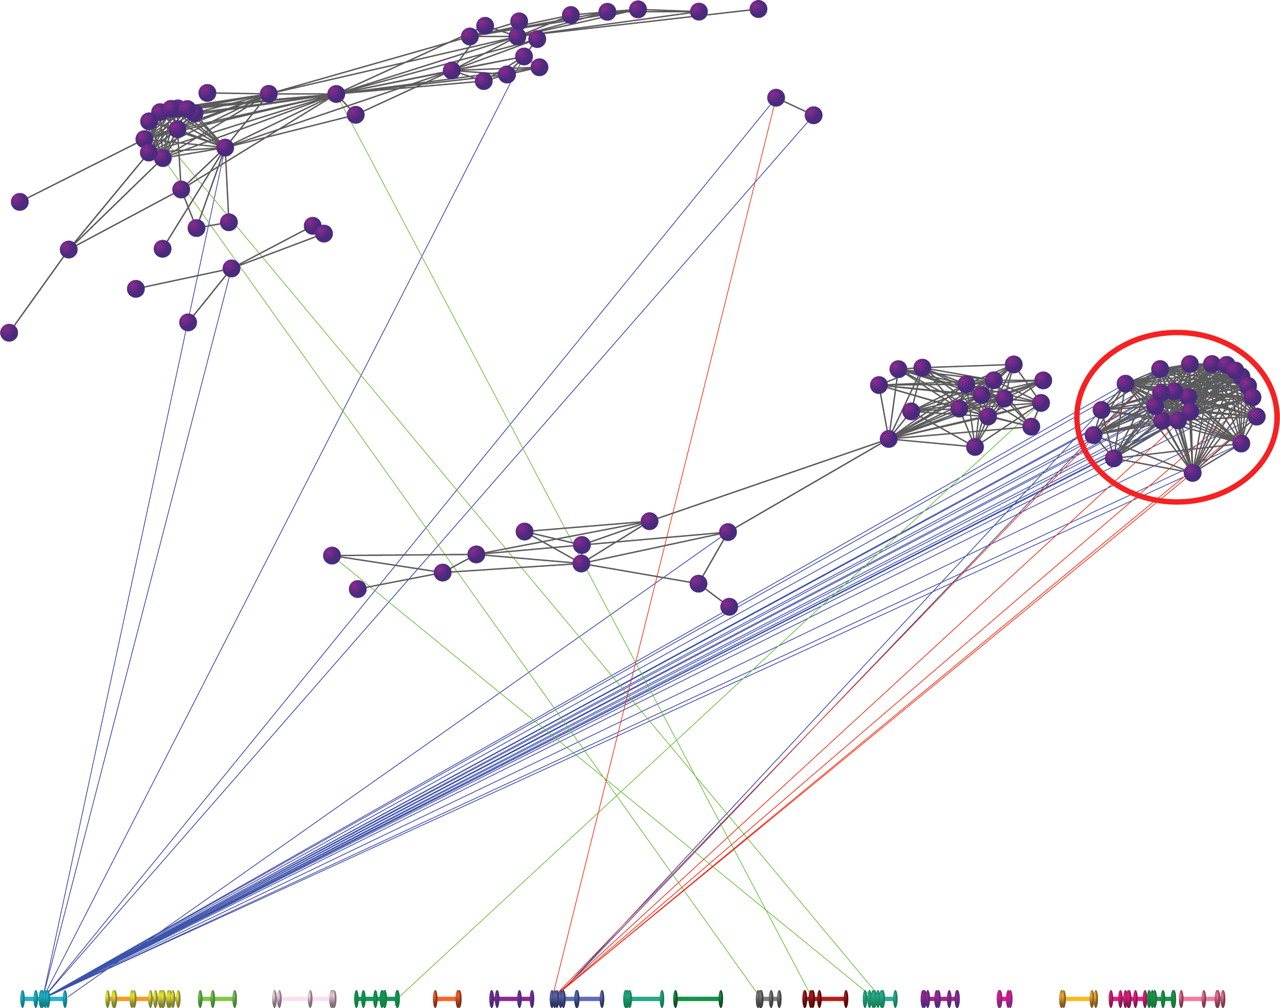
In Figure 2, we highlight another possible approach to uncovering putative regulatory architecture using expression genetics data from brain, liver, and kidney in a BXD mouse panel (Cotsapas 2007). Using a statistical approach called sparse latent factor modeling to identify a group of 24 genes that demonstrate evidence for coregulation through correlated changes in mRNA levels in the brain, liver, and kidney of 31 RI mice; genetic mapping identified trans-eQTLs on chromosome (chr) 1 in brain and chr 8 in liver: interestingly, analysis using a transcription-factor binding database (JASPAR) demonstrated that 11/24 genes were enriched for the IRF2 motif and the Irf2 gene is located within the chr 8 eQTL and was expressed in all three tissues (M. Cowley, C. Cotsapas, R. Williams, E. Chan, J. Pulvers, M. Liu, O. Luo, D. Nott, and P. Little, in prep.).
Regulon analysis of genes. Following sparse latent factor analysis, each gene is represented as a purple vertex connected to other genes by a gray line if the posterior probability of being correlated across the three tissues is ≥0.90. Linkage is drawn to the chromosomes below (1–19, X, left to right) if P < 10−4: line color indicates the relevant tissue (blue, brain; green, kidney; red, liver). Note the cluster of genes on the right (circled), influenced by chromosome 1 in the brain, but chromosome 8 in the liver. In this cluster of genes, there is enrichment for the Irf2-binding motif; which is also located within the linkage region on chr 8; and is expressed in all three tissues.
Studies on known pathways and gene-environment interactions
The final group of studies attempts to examine the genetic influences on transcription for genes in known metabolic or signaling pathways. Although these studies by necessity focus upon relatively small sets of genes that have known pathway involvement, they have the distinct advantage that the underlying cellular machinery is at least clearly identifiable, a considerable advantage when considering downstream functional validation. Using this approach, Ghazalpour et al. (2005) studied 4670 genes in the livers of mice from the F2 BXD-intercross previously reported in Schadt et al. (2003), analyzing 378 sets of functionally related genes defined by KEGG, Biocarta, and other sources of annotation using an early version of the Gene Set Enrichment Analysis (GSEA) procedure (Subramanian et al. 2005) to identify genes that were differentially regulated within any given set. They identified 170 genes contained in 13 pathways, of which nine related to the tricarboxcylic acid cycle and three to cholesterol metabolism.
One appealing aspect of this approach, from the point of view of understanding genotype–phenotype functional relationship, is the possibility of manipulating phenotypes directly, for example, by directly activating or inhibiting a biochemical pathway and studying the influences of genetic variation on the response (e.g., Montooth et al. 2003; Passador-Gurgel et al. 2007). Li et al. (2006b) examined the interaction of eQTLs and changes in temperature in an RI cross of two Caenorhabditis elegans strains: interestingly, nearly 60% of genes that were trans-regulated showed evidence of an eQTL-by-temperature interaction, but only 8% of genes demonstrated cis-regulation, suggesting that pathway control in this case is predominantly controlled through trans interactions.
Tissue specificity of genetic influence
Currently, the extent to which genetic influence on mRNA levels is tissue dependent or independent remains unclear (Chesler et al. 2005; Cotsapas et al. 2006; Petretto et al. 2006; Yang et al. 2006). Microarray data in brain regions from different strains of inbred mice clearly indicate the possibility of region-specific genetic influence of expression (Nadler et al. 2006; Hovatta et al. 2007). Our own analysis of expression variation in inbred mice strains supports the notion that the influence of genetic variation on mRNA is essentially tissue specific (Cotsapas 2007; (M. Cowley, C. Cotsapas, R. Williams, E. Chan, J. Pulvers, M. Liu, O. Luo, D. Nott, and P. Little, in prep.), and using a RI mouse panel, we performed eQTL-mapping analyses using mRNAs extracted from three tissues: brain, kidney, and liver. Of the 6075 transcripts that are expressed in all three tissues, only two are mapped to the same eQTL in all three tissues. The extent to which genetic influences are indeed tissue specific could have important impact upon studies upon humans, where access to different tissues of the same human is necessarily limited.
Conclusions
Perhaps the most striking observation we can make in drawing this review to conclusion is the extent to which there is ambiguity in positioning the results of expression genetics in a biological context. We have argued above that data interpretation is focused upon five areas; identifying direct phenotypic consequences of variations, studies of the regulator genes within eQTLs, studies focused on the regulated genes, and finally studies focused on known pathways and tissues. Clearly, these are logical developments of any genetic analysis; the question that is not addressed is the extent to which genetic analysis is, or is not, the appropriate method of analysis. In part, the answer depends on which of the areas is being considered. For example, can studies on promoter polymorphisms be easily integrated into the ENCODE project (ENCODE Project Consortium 2007)? If so, do we need the explicit linkage/association information from the expression genetic analysis or would inclusion of the common DNA sequence haplotypes in the appropriate experimental analyses be sufficient to define cis regulatory variants? In general, the functional consequences of sequence variations in a single gene can be studied efficiently and sensitively by molecular biology-based approaches such as transgenesis and promoter protein/DNA-binding analysis. By this argument, identifying cis-acting influences is perhaps experimentally the least attractive use of expression genetics. In contrast, trans-acting regulators that may influence multiple genes are far more difficult to identify by molecular biological approaches, and the use of genetic approaches is therefore attractive because, even though they are technically harder to detect, the genetic analysis may lead to identification of regulons of genes influenced by the same trans-acting regulators. The description of the regulatory architecture controlling gene expression at a large scale is opening up substantial new insight, and it will be a great challenge to interpret the phenotypic consequences, particularly with respect to human health, of such coordinate change in mRNA levels.
Are we any closer to understanding how this class of variation impacts upon our understanding of evolutionary processes? Regretfully, the answer must be a clear negative, and this is in part because we still have extraordinarily limited experimental data on whether mRNA level variation equates to protein level variation, and whether this, in turn, has phenotypic consequences. The proteomic literature is not strong in this area; in yeast, Ghaemmaghami et al. (2003) found a strong correlation between protein levels and mRNA and Lu et al. (2007) show that 73% of variance in protein levels was explained by mRNA abundance. We are not aware of similar studies on humans, but for plasma proteins Anderson and Anderson (2002) concluded, based upon a review of published twin studies, that an average of 62% of the quantitative variation in levels of specific plasma protein levels between individuals is genetic in origin. The clear challenge is how to create the field of proteomic genetics?
Acknowledgments
We thank current and former colleagues, Chris Cotsapas, David Nott, Marc Wilkins, Florian Breitweiser, Junhong (Oscar) Luo, Michael Liu, and Jeremy Pulvers, for their contributions and insight. This work was supported by an ARC Discovery Grant award (P.F.R.L), an NHMRC Peter Doherty Fellowship (R.B.H.W), Australian Postgraduate Awards (E.K.F.C and M.J.C), and a grant-in-aid from the Australian Centre for Advanced Computing and Communications (P.F.R.L).
Note added in proof
We read with delight the new article “The genetic basis of proteome variation in yeast” (Foss et al. 2007), which is the first study that applies the methodology of expression genetics to genetic influences on protein levels—surely a step in the right direction.
References
- ↵R. Alberts,P. Terpstra,L.V. Bystrykh,G. de Haan,R.C. Jansen,(2005) A statistical multiprobe model for analyzing cis and trans genes in genetical genomics experiments with short-oligonucleotide arrays. Genetics 171:1437–1439.
- ↵N.L. Anderson,N.G. Anderson,(2002) The human plasma proteome: History, character, and diagnostic prospects. Mol. Cell. Proteomics 1:845–867.
- ↵S.T. Bennett,A.M. Lucassen,S.C. Gough,E.E. Powell,D.E. Undlien,L.E. Pritchard,M.E. Merriman,Y. Kawaguchi,M.J. Dronsfield,F. Pociot,(1995) Susceptibility to human type 1 diabetes at IDDM2 is determined by tandem repeat variation at the insulin gene minisatellite locus. Nat. Genet. 9:284–292.
- ↵R.B. Brem,L. Kruglyak,(2005) The landscape of genetic complexity across 5,700 gene expression traits in yeast. Proc. Natl. Acad. Sci. 102:1572–1577.
- ↵R.B. Brem,G. Yvert,R. Clinton,L. Kruglyak,(2002) Genetic dissection of transcriptional regulation in budding yeast. Science 296:752–755.
- R.B. Brem,J.D. Storey,J. Whittle,L. Kruglyak,(2005) Genetic interactions between polymorphisms that affect gene expression in yeast. Nature 436:701–703.
- ↵L. Bystrykh,E. Weersing,B. Dontje,S. Sutton,M.T. Pletcher,T. Wiltshire,A.I. Su,E. Vellenga,J. Wang,K.F. Manly,(2005) Uncovering regulatory pathways that affect hematopoietic stem cell function using ‘genetical genomics.’. Nat. Genet. 37:225–232.
- ↵E.J. Chesler,L. Lu,S. Shou,Y. Qu,J. Gu,J. Wang,H.C. Hsu,J.D. Mountz,N.E. Baldwin,M.A. Langston,(2005) Complex trait analysis of gene expression uncovers polygenic and pleiotropic networks that modulate nervous system function. Nat. Genet. 37:233–242.
- ↵V.G. Cheung,R.S. Spielman,K.G. Ewens,T.M. Weber,M. Morley,J.T. Burdick,(2005) Mapping determinants of human gene expression by regional and genome-wide association. Nature 437:1365–1369.
- ↵C.J. Cotsapas,(2007) “The genetics of variation in gene expression.” Ph.D thesis (The University of New South Wales, Randwick NSW, Australia).
- ↵C.J. Cotsapas,R.B. Williams,J.N. Pulvers,D.J. Nott,E.K. Chan,M.J. Cowley,P.F. Little,(2006) Genetic dissection of gene regulation in multiple mouse tissues. Mamm. Genome 17:490–495.
- ↵C.R. Cowles,J.N. Hirschhorn,D. Altshuler,E.S. Lander,(2002) Detection of regulatory variation in mouse genes. Nat. Genet. 32:432–437.
- ↵G. de Haan,L.V. Bystrykh,E. Weersing,B. Dontje,H. Geiger,N. Ivanova,I.R. Lemischka,E. Vellenga,G.V. Zant,(2002) A genetic and genomic analysis identifies a cluster of genes associated with hematopoietic cell turnover. Blood 100:2056–2062.
- ↵S. Doss,E.E. Schadt,T.A. Drake,A.J. Lusis,(2005) Cis-acting expression quantitative trait loci in mice. Genome Res. 15:681–691.
- ↵ENCODE Project Consortium (2007) Identification and analysis of functional elements in 1% of the human genome by the ENCODE pilot project. Nature 447:799–816.
- ↵E.J. Foss,D. Radulovic,S.A. Shaffer,D.M. Ruderfer,A. Bedalov,D.R. Goodlett,L. Kruglyak,(2007) Genetic basis of proteome variation in yeast. Nat. Genet. 10.1038/ng.2007.22.
- ↵S. Ghaemmaghami,W.K. Huh,K. Bower,R.W. Howson,A. Belle,N. Dephoure,E.K. O'Shea,J.S. Weissman,(2003) Global analysis of protein expression in yeast. Nature 425:737–741.
- ↵A. Ghazalpour,S. Doss,S.S. Sheth,L.A. Ingram-Drake,E.E. Schadt,A.J. Lusis,T.A. Drake,(2005) Genomic analysis of metabolic pathway gene expression in mice. Genome Biol. 6:R59, 10.1186/gb-2005-6-7-r59.
- ↵A. Ghazalpour,S. Doss,B. Zhang,S. Wang,C. Plaisier,R. Castellanos,A. Brozell,E.E. Schadt,T.A. Drake,A.J. Lusis,(2006) Integrating genetic and network analysis to characterize genes related to mouse weight. PLoS Genet. 2:e130, 10.1371/journal/pgen.0020130.
- ↵G. Gibson,B. Weir,(2005) The quantitative genetics of transcription. Trends Genet. 21:616–623.
- ↵I. Hovatta,M.A. Zapala,R.S. Broide,E.E. Schadt,O. Libiger,N.J. Schork,D.J. Lockhart,C. Barlow,(2007) DNA variation and brain region-specific expression profiles exhibit different relationships between inbred mouse strains: Implications for eQTL mapping studies. Genome Biol. 8:R25, 10.1186/gb-2007-8-2-r25.
- ↵N. Hubner,C.A. Wallace,H. Zimdahl,E. Petretto,H. Schulz,F. Maciver,M. Mueller,O. Hummel,J. Monti,V. Zidek,(2005) Integrated transcriptional profiling and linkage analysis for identification of genes underlying disease. Nat. Genet. 37:243–253.
- ↵J. Hull,S. Campino,K. Rowlands,M.S. Chan,R.R. Copley,M.S. Taylor,K. Rockett,G. Elvidge,B. Keating,J. Knight,(2007) Identification of common genetic variation that modulates alternative splicing. PLoS Genet. 3:e99, 10.1371/journal.pgen.0030099.
- ↵R.C. Jansen,J.P. Nap,(2001) Genetical genomics: The added value from segregation. Trends Genet. 17:388–391.
- ↵M.C. King,A.C. Wilson,(1975) Evolution at two levels in humans and chimpanzees. Science 188:107–116.
- ↵H. Lan,M. Chen,J.B. Flowers,B.S. Yandell,D.S. Stapleton,C.M. Mata,E.T. Mui,M.T. Flowers,K.L. Schueler,K.F. Manly,(2006) Combined expression trait correlations and expression quantitative trait locus mapping. PLoS Genet. 2:e6, 10.1371/journal.pgen.0020006.
- ↵S.I. Lee,D. Pe'er,A.M. Dudley,G.M. Church,D. Koller,(2006) Identifying regulatory mechanisms using individual variation reveals key role for chromatin modification. Proc. Natl. Acad. Sci. 103:14062–14067.
- ↵J. Li,M. Burmeister,(2005) Genetical genomics: Combining genetics with gene expression analysis. Hum. Mol. Genet. 14:R163–R169.
- ↵H. Li,H. Chen,L. Bao,K.F. Manly,E.J. Chesler,L. Lu,J. Wang,M. Zhou,R.W. Williams,Y. Cui,(2006a) Integrative genetic analysis of transcription modules: Towards filling the gap between genetic loci and inherited traits. Hum. Mol. Genet. 15:481–492.
- ↵Y. Li,O.A. Alvarez,E.W. Gutteling,M. Tijsterman,J. Fu,J.A. Riksen,E. Hazendonk,P. Prins,R.H. Plasterk,R.C. Jansen,(2006b) Mapping determinants of gene expression plasticity by genetical genomics in C. elegans. PLoS Genet. 2:e222, 10.1371/journal.pgen.0020222.
- ↵P. Lu,C. Vogel,R. Wang,X. Yao,E.M. Marcotte,(2007) Absolute protein expression profiling estimates the relative contributions of transcriptional and translational regulation. Nat. Biotechnol. 25:117–124.
- ↵K. Maciag,S.J. Altschuler,M.D. Slack,N.J. Krogan,A. Emili,J.F. Greenblatt,T. Maniatis,L.F. Wu,(2006) Systems-level analyses identify extensive coupling among gene expression machines. Mol. Syst. Biol. 2, 10.1038/msb4100045.
- ↵T. Maniatis,R. Reed,(2002) An extensive network of coupling among gene expression machines. Nature 416:499–506.
- ↵K.F. Manly,J. Wang,R.W. Williams,(2005) Weighting by heritability for detection of quantitative trait loci with microarray estimates of gene expression. Genome Biol. 6:R27, 10.1186/gb-2005-6-3-r27.
- ↵M. Mehrabian,H. Allayee,J. Stockton,P.Y. Lum,T.A. Drake,L.W. Castellani,M. Suh,C. Armour,S. Edwards,J. Lamb,(2005) Integrating genotypic and expression data in a segregating mouse population to identify 5-lipoxygenase as a susceptibility gene for obesity and bone traits. Nat. Genet. 37:1224–1233.
- ↵S.A. Monks,A. Leonardson,H. Zhu,P. Cundiff,P. Pietrusiak,S. Edwards,J.W. Phillips,A. Sachs,E.E. Schadt,(2004) Genetic inheritance of gene expression in human cell lines. Am. J. Hum. Genet. 75:1094–1105.
- ↵K.L. Montooth,J.H. Marden,A.G. Clark,(2003) Mapping determinants of variation in energy metabolism, respiration and flight in Drosophila. Genetics 165:623–635.
- ↵M. Morley,C.M. Molony,T.M. Weber,J.L. Devlin,K.G. Ewens,R.S. Spielman,V.G. Cheung,(2004) Genetic analysis of genome-wide variation in human gene expression. Nature 430:743–747.
- ↵Microarray Quality Control Consortium (2006) The MicroArray Quality Control (MAQC) project shows inter- and intraplatform reproducibility of gene expression measurements. Nat. Biotechnol. 24:1151–1161.
- ↵J.J. Nadler,F. Zou,H. Huang,S.S. Moy,J. Lauder,J.N. Crawley,D.W. Threadgill,F.A. Wright,T.R. Magnuson,(2006) Large-scale gene expression differences across brain regions and inbred strains correlate with a behavioral phenotype. Genetics 174:1229–1236.
- ↵G. Passador-Gurgel,W.P. Hsieh,P. Hunt,N. Deighton,G. Gibson,(2007) Quantitative trait transcripts for nicotine resistance in Drosophila melanogaster. Nat. Genet. 39:264–268.
- ↵E. Petretto,J. Mangion,N.J. Dickens,S.A. Cook,M.K. Kumaran,H. Lu,J. Fischer,H. Maatz,V. Kren,M. Pravenec,(2006) Heritability and tissue specificity of expression quantitative trait loci. PLoS Genet. 2:e172, 10.1371/journal.pgen.0020172.
- ↵D. Pfeifer,R. Kist,K. Dewar,K. Devon,E.S. Lander,B. Birren,L. Korniszewski,E. Back,G. Scherer,(1999) Campomelic dysplasia translocation breakpoints are scattered over 1 Mb proximal to SOX9: Evidence for an extended control region. Am. J. Hum. Genet. 65:111–124.
- ↵M.V. Rockman,L. Kruglyak,(2006) Genetics of global gene expression. Nat. Rev. Genet. 7:862–872.
- ↵J. Ronald,R.B. Brem,J. Whittle,L. Kruglyak,(2005) Local regulatory variation in Saccharomyces cerevisiae. PLoS Genet. 1:e25, 10.1371/journal.pgen.0010025.
- ↵E.E. Schadt,S.A. Monks,T.A. Drake,A.J. Lusis,N. Che,V. Colinayo,T.G. Ruff,S.B. Milligan,J.R. Lamb,G. Cavet,(2003) Genetics of gene expression surveyed in maize, mouse and man. Nature 422:297–302.
- ↵E.E. Schadt,J. Lamb,X. Yang,J. Zhu,S. Edwards,D. Guhathakurta,S.K. Sieberts,S. Monks,M. Reitman,C. Zhang,(2005) An integrative genomics approach to infer causal associations between gene expression and disease. Nat. Genet. 37:710–717.
- ↵J. Singer-Sam,J.M. LeBon,A. Dai,A.D. Riggs,(1992) A sensitive, quantitative assay for measurement of allele-specific transcripts differing by a single nucleotide. PCR Methods Appl. 1:160–163.
- ↵J.D. Storey,J.M. Akey,L. Kruglyak,(2005) Multiple locus linkage analysis of genomewide expression in yeast. PLoS Biol. 3:e267, 10.1371/journal.pbio.0030267.
- ↵B.E. Stranger, M.S. Forrest, A.G. Clark, M.J. Minichiello, S. Deutsch, R. Lyle, S. Hunt, B. Kahl, S.E. Antonarakis, S. Tavare, 2005 Genome-wide associations of gene expression variation in humans PLoS Genet. 1 e78 .10.1371/journal.pgen.0010078
- ↵A. Subramanian,P. Tamayo,V.K. Mootha,S. Mukherjee,B.L. Ebert,M.A. Gillette,A. Paulovich,S.L. Pomeroy,T.R. Golub,E.S. Lander,(2005) Gene set enrichment analysis: A knowledge-based approach for interpreting genome-wide expression profiles. Proc. Natl. Acad. Sci. 102:15545–15550.
- ↵J. Theuns,J. Del-Favero,B. Dermaut,C.M. van Duijn,H. Backhovens,M.V. Van den Broeck,S. Serneels,E. Corsmit,C.V. Van Broeckhoven,M. Cruts,(2000) Genetic variability in the regulatory region of presenilin 1 associated with risk for Alzheimer's disease and variable expression. Hum. Mol. Genet. 9:325–331.
- ↵A.M. Tsankov,C.R. Brown,M.C. Yu,M.Z. Win,P.A. Silver,J.M. Casolari,(2006) Communication between levels of transcriptional control improves robustness and adaptivity. Mol. Syst. Biol. 2:65.
- ↵R.B. Williams,C.J. Cotsapas,M.J. Cowley,E. Chan,D.J. Nott,P.F. Little,(2006) Normalization procedures and detection of linkage signal in genetical-genomics experiments. Nat. Genet. 38:855–856.
- ↵H. Yan,W. Yuan,V.E. Velculescu,B. Vogelstein,K.W. Kinzler,(2002) Allelic variation in human gene expression. Science 297:1143.
- ↵X. Yang,E.E. Schadt,S. Wang,H. Wang,A.P. Arnold,L. Ingram-Drake,T.A. Drake,A.J. Lusis,(2006) Tissue-specific expression and regulation of sexually dimorphic genes in mice. Genome Res. 16:995–1004.
- ↵G. Yvert,R.B. Brem,J. Whittle,J.M. Akey,E. Foss,E.N. Smith,R. Mackelprang,L. Kruglyak,(2003) Trans-acting regulatory variation in Saccharomyces cerevisiae and the role of transcription factors. Nat. Genet. 35:57–64.
- J. Zhu,P.Y. Lum,J. Lamb,D. GuhaThakurta,S.W. Edwards,R. Thieringer,J.P. Berger,M.S. Wu,J. Thompson,A.B. Sachs,(2005) An integrative genomics approach to the reconstruction of gene networks in segregating populations. Cytogenet. Genome Res. 105:363–374.
Notes
[1] Article is online at http://www.genome.org/cgi/doi/10.1101/gr.6981507