
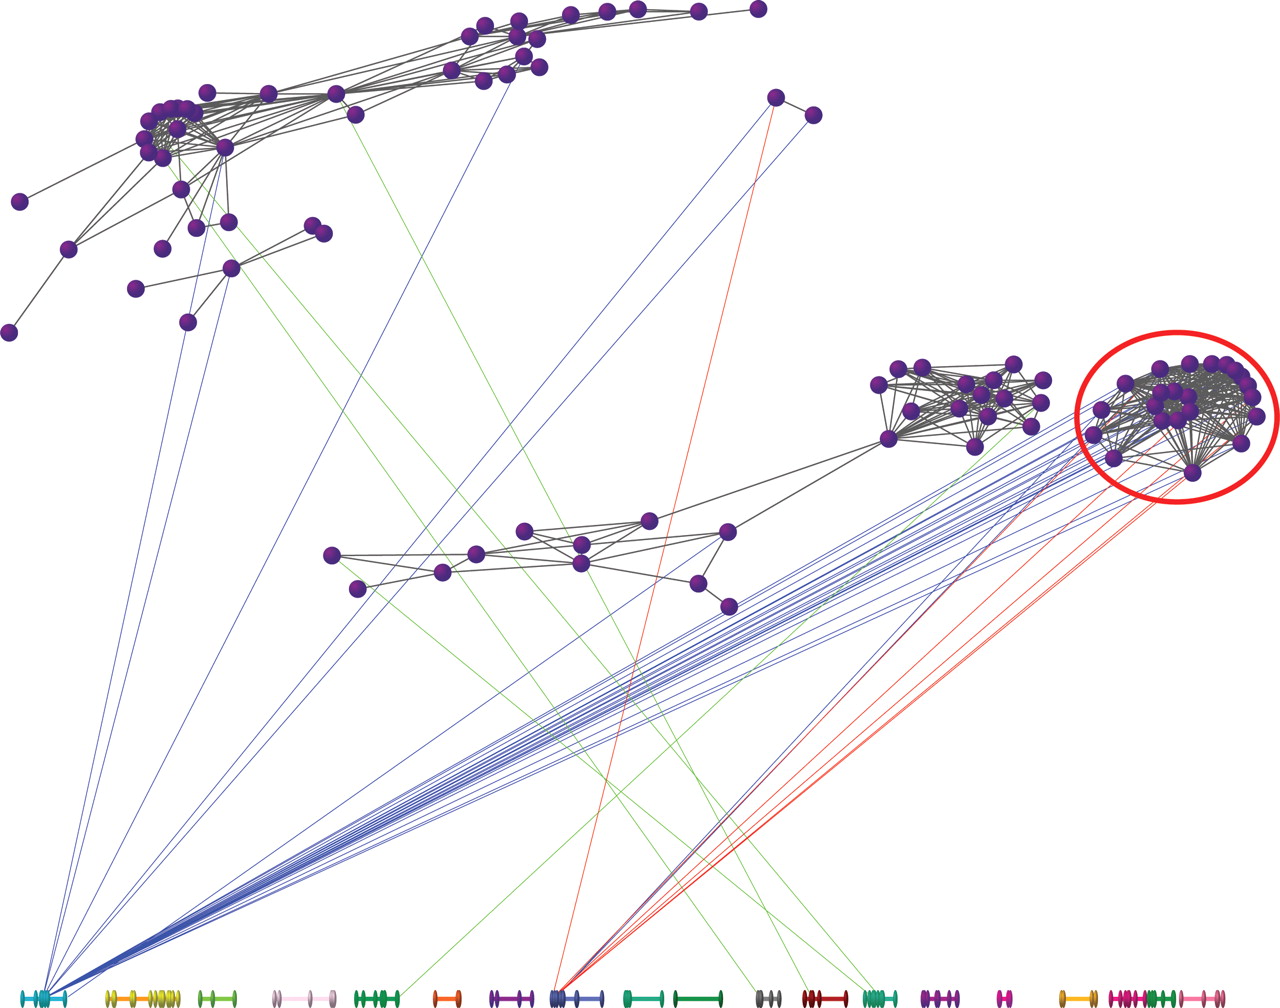
Regulon analysis of genes. Following sparse latent factor analysis, each gene is represented as a purple vertex connected to other genes by a gray line if the posterior probability of being correlated across the three tissues is ≥0.90. Linkage is drawn to the chromosomes below (1–19, X, left to right) if P < 10−4: line color indicates the relevant tissue (blue, brain; green, kidney; red, liver). Note the cluster of genes on the right (circled), influenced by chromosome 1 in the brain, but chromosome 8 in the liver. In this cluster of genes, there is enrichment for the Irf2-binding motif; which is also located within the linkage region on chr 8; and is expressed in all three tissues.


