
Probing genomic diversity and evolution of Escherichia coli O157 by single nucleotide polymorphisms
E. coli- Wei Zhang1,5,1,
- Weihong Qi2,
- Thomas J. Albert3,
- Alifiya S. Motiwala4,
- David Alland4,
- Eija K. Hyytia-Trees1,
- Efrain M. Ribot1,
- Patricia I. Fields1,
- Thomas S. Whittam2, and
- Bala Swaminathan1
- 1 Foodborne and Diarrheal Diseases Branch, National Center for Infectious Diseases, Centers for Disease Control and Prevention, Atlanta, Georgia 30333, USA;
- 2 Microbial Evolution Laboratory, National Food Safety and Toxicology Center, Michigan State University, East Lansing, Michigan 48824, USA;
- 3 NimbleGen Systems Inc., Madison, Wisconsin 53711, USA;
- 4 Division of Infectious Diseases, New Jersey Medical School, University of Medicine and Dentistry of New Jersey, Newark, New Jersey 07103, USA
- 5
↵5 Present address: National Center for Food Safety and Technology, Illinois Institute of Technology, Summit, IL 60501, USA.
Abstract
Infections by Shiga toxin-producing Escherichia coli O157:H7 (STEC O157) are the predominant cause of bloody diarrhea and hemolytic uremic syndrome in the United States. In silico comparison of the two complete STEC O157 genomes (Sakai and EDL933) revealed a strikingly high level of sequence identity in orthologous protein-coding genes, limiting the use of nucleotide sequences to study the evolution and epidemiology of this bacterial pathogen. To systematically examine single nucleotide polymorphisms (SNPs) at a genome scale, we designed comparative genome sequencing microarrays and analyzed 1199 chromosomal genes (a total of 1,167,948 bp) and 92,721 bp of the large virulence plasmid (pO157) of eleven outbreak-associated STEC O157 strains. We discovered 906 SNPs in 523 chromosomal genes and observed a high level of DNA polymorphisms among the pO157 plasmids. Based on a uniform rate of synonymous substitution for Escherichia coli and Salmonella enterica (4.7 × 10⁻⁹ per site per year), we estimate that the most recent common ancestor of the contemporary β-glucuronidase-negative, non-sorbitolfermenting STEC O157 strains existed ca. 40 thousand years ago. The phylogeny of the STEC O157 strains based on the informative synonymous SNPs was compared to the maximum parsimony trees inferred from pulsed-field gel electrophoresis and multilocus variable numbers of tandem repeats analysis. The topological discrepancies indicate that, in contrast to the synonymous mutations, parts of STEC O157 genomes have evolved through different mechanisms with highly variable divergence rates. The SNP loci reported here will provide useful genetic markers for developing high-throughput methods for fine-resolution genotyping of STEC O157. Functional characterization of nucleotide polymorphisms should shed new insights on the evolution, epidemiology, and pathogenesis of STEC O157 and related pathogens.
Shiga toxin-producing Escherichia coli O157:H7 (STEC O157) can cause severe enteric infections. Symptoms may include abdominal pain, bloody diarrhea, hemorrhagic colitis, and hemolytic uremic syndrome (HUS) (Griffin and Tauxe 1991; Feng 1995). Numerous sporadic infections and outbreaks caused by STEC O157 have been reported in the United States and worldwide (Griffin and Tauxe 1991; Mead and Griffin 1998). The majority of STEC O157 infections are foodborne; many are associated with bovine sources (Feng 1995; Kim et al. 1999). STEC O157 was first linked to outbreaks of severe bloody diarrhea in 1982, and is often referred to as a “recently emerged” human pathogen (Griffin and Tauxe 1991; Bitzan et al. 1993).
Strains of STEC O157 from clinical and bovine sources have been shown to be genotypically diverse by a variety of molecular subtyping methods, including pulsed-field gel electrophoresis (PFGE) (Noller et al. 2003b), octamer-based genome scanning (Kim et al. 1999), and multilocus variable number of tandem repeats analysis (MLVA) (Noller et al. 2003a). Studies of prophage and prophage remnants in STEC O157 strains have suggested that such genotypic diversity is largely attributable to bacteriophage-related insertions, deletions, and duplications of variable sizes of DNA fragments (Kudva et al. 2002; Ohnishi et al. 2002; Shaikh and Tarr 2003). In contrast to phageborne diversity, orthologous protein-coding genes in STEC O157 populations exhibit extremely low levels of polymorphism (overall nucleotide sequence identity >99.9%) as shown by in silico comparison of the two complete STEC O157 genomes (Hayashi et al. 2001; Perna et al. 2001) and multilocus sequence typing (MLST) analysis of diverse sets of STEC O157 strains (Noller et al. 2003b; Foley et al. 2004). Based on the limited sequence data available, it is not clear to what extent single nucleotide polymorphisms (SNPs) in protein-coding genes contribute to the overall genomic diversity of STEC O157 population.
Previous phylogenetic studies have inferred a stepwise evolutionary model that STEC O157 strains descended from an O55:H7-like enteropathogenic ancestor by acquisition of bacteriophage-derived Shiga toxins (Stx1 and/or Stx2), a large virulence plasmid (pO157), and the transition of somatic antigen O55 to O157 (Feng et al. 1998; Reid et al. 2000; Wick et al. 2005). Loss of ability to ferment sorbitol (SOR) and produce β-glucuronidase (GUD) are two key landmarks in the stepwise evolution of STEC O157, which led to emergence of the contemporary GUD−, SOR− phenotype (Karch et al. 1993; Hayes et al. 1995; Feng et al. 1998; Monday et al. 2001, 2004). However, the time frame behind the stepwise evolution of STEC O157 remains unknown yet intriguing.
To further study the intragenic nucleotide polymorphism and the evolution of STEC O157, we used comparative genome sequencing (CGS) microarrays to analyze 1199 chromosomal genes and the large virulence plasmid (pO157) of 11 representative STEC O157 strains associated with human outbreaks. We tested the molecular clock hypothesis using the identified SNPs from this study to provide an estimated evolutionary time frame for the emergence of STEC O157. Also, we compared SNP-based genotyping with PFGE and MLVA to evaluate their suitability for studying the evolution and epidemiology of STEC O157.
Results
Selection of STEC O157 strains and chromosomal genes for CGS analysis
Eleven STEC O157 strains were selected to represent the phenotypic, genetic and epidemiologic diversity of STEC O157 populations (Table 1). Sakai, a fully sequenced Japanese outbreak strain (Hayashi et al. 2001), was used as the reference in this study. G5101 (Hayes et al. 1995) and 493/89 (Karch et al. 1993) were included to represent atypical phenotypes of STEC O157 (Feng et al. 1998; Monday et al. 2001, 2004). G5289, F8768, F5733, and F6141 were included to represent four major STEC O157 outbreaks in the United States. 01-577, N0303, N0436, and N0587 were selected to represent four frequently identified PFGE genotypes of STEC O157 by The Centers for Disease Control and Prevention. Collectively, the 11 strains analyzed in this study represent STEC O157 isolated from major outbreaks on three continents over a time span of 13 yr.
STEC O157 strains used in this study
We chose chromosomal genes for CGS analysis based on two criteria. First, the selected genes should be common (or functionally conserved) to all STEC O157 strains. Second, the selected genes should exist as a single copy in the STEC O157 genome to avoid ambiguous calls during resequencing analysis. To identify conserved, single-copy genes in STEC O157 genomes, we compared the two complete STEC O157 genomes (Sakai and EDL933) and selected ∼4000 orthologous genes that are common to both genomes (Hayashi et al. 2001; Perna et al. 2001). From this list, we selected 850 backbone genes (genes that are conserved between E. coli K-12 and Sakai) from various chromosomal locations and 400 S-loop genes from 95 “Sakai-specific” segments that are conserved among O157:H7 strains (Ohnishi et al. 2002). In addition, we incorporated known virulence-related genes in the analysis (Fig. 1), including 14 fimbrial biosynthesis loci, 16 adhesion and invasion loci, four Shiga toxin loci, and the complete locus of enterocyte effacement (LEE) encoding the type III secretion system (Hayashi et al. 2001). To identify genes with paralogs in the STEC O157 genome, all selected genes were subjected to a preliminary BLAST search in ColiBASE (http://colibase.bham.ac.uk/). Twenty-seven backbone and 24 S-loop genes with potential paralogs in Sakai and EDL933 genomes were excluded from CGS analysis. The resulting 823 backbone and 376 S-loop genes (total of 1,167,948 bp), which cover approximately one-fourth of the chromosomal protein-coding regions in the STEC O157 genomes, were selected for CGS analysis for each representative strain (see Supplemental Table 1).
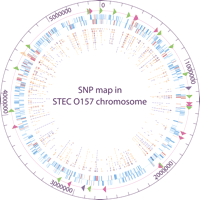
Circular map of 1199 protein-coding genes and newly identified 906 SNPs relative to Sakai chromosome. The outer circle shows the genome scale. Triangles on the second circle show locations of virulence-related loci analyzed, including fimbrial biosynthesis loci (green), adhesin and invasin loci (rose), Shiga toxin loci (purple), and locus of enterocyte effacement (yellow). The third circle shows all chromosomal genes analyzed, including 823 backbone genes (blue) and 376 S-loop genes (red). Genes on the forward strand are shown outside the baseline; genes on the reverse strand are shown inside the baseline. Inner circles show all synonymous SNPs (dark blue) and nonsynonymous SNPs (orange) identified in 10 test STEC O157 strains—493/89, G5101, F8768, 01-577, F6141, N0587, F5733, N0303, G5289, and N0436, respectively. The figure was created by GenVision from DNASTAR.
Single nucleotide polymorphisms in chromosomal genes
We designed 340,000 oligonucleotide probes to tile the complete sequence of 1199 selected genes for mutation mapping and 392,000 probes for resequencing analysis (see Methods). A total of 597 SNPs in 355 backbone genes and 309 SNPs in 168 S-loop genes were identified in STEC O157 test strains with Sakai used as the reference strain (see Supplemental Table 2). The identified SNPs were then mapped on the Sakai chromosome (Fig. 1). The average number of SNPs is 174 per 1,167,948 bp of coding sequences per strain; therefore, the average percentage of polymorphic nucleotide sites between a test STEC O157 strain and Sakai is 0.0149%. It is noteworthy that 507 (56%) of 906 total SNP loci are found only in the two atypical O157 strains 493/89 (GUD+, SOR+) and G5101 (GUD+, SOR−), consistent with previous findings that GUD+ or SOR+ strains are genetically distant to the typical GUD−, SOR− O157:H7 strains (Feng et al. 1998; Wick et al. 2005). There are 399 (44%) SNPs among the typical GUD−, SOR− strains with an average of 0.0102% of polymorphic nucleotide site differences from the Sakai genome.
All newly identified SNPs were categorized as “strain-specific” SNPs (unique in a particular strain), “backbone” SNPs (present in backbone genes), “synonymous” SNPs (not causing amino acid change), and “transversion” (nucleotide replacement between pyrimidine and purine). Figure 2 shows the total numbers of SNPs and percentage of different categories of SNPs found in each strain. Overall, 308 SNPs were found parsimoniously informative (common to at least two strains) or “non-strain-specific.” The numbers of “strain-specific” SNPs varied from 13 (9% of 147 SNPs) in F5733 to 81 (55% of 151 SNPs) in N0587. Seventeen SNPs were unique in Sakai and absent in other strains. Backbone genes accounted for 69% of all genes analyzed in this study. Most strains showed a percentage of “backbone” SNPs close to 69%, indicating similar rates of point mutations in backbone and S-loop genes. Interestingly, the majority of SNPs (57%∼66%) found in both backbone and S-loop genes were nonsynonymous. The percentage of SNP transversion ranged between 31% and 40% in most strains, except for N0303 (46%) and F5733 (45%), indicating a possible transversion/transition substitution bias.
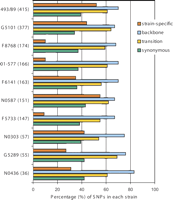
Summary of single nucleotide polymorphisms in STEC O157 strains. The total number of SNPs in each strain is given in parentheses. The bars show the percentage of strain-specific SNPs, backbone SNPs, synonymous SNPs, and transversions of all SNPs identified in each strain.
On average, each chromosomal gene harbored one to three SNPs among all strains analyzed. Higher numbers of SNPs (n > 3) were observed in certain genes associated with flagellar biosynthesis (e.g., fhiA), fimbrial biosynthesis (e.g., fimA and fimI), adhesion and invasion (e.g., ECs0336 encoding putative invasin), cell division (e.g., ECs0975 encoding a cell division protein), amino acid metabolism (e.g., ECs2521 encoding p-aminobenzoate synthetase component I), and the cell membrane (e.g., ECs4022 encoding a putative outer membrane structural protein). To examine whether certain functional classes of genes were under positive selection, we compared values of synonymous differences per synonymous site (pS) and nonsynonymous differences per nonsynonymous site (pN) according to the Clusters of Orthologous Group (COG) classification (see Supplemental Fig. 1) and divided the genes analyzed in this study into two groups. Group A included genes with negative (pN − pS) values, indicating possible selection against amino acid change; group B included genes with positive (pN − pS) values, indicating possible selection for amino acid change. We found that all COG classes of STEC O157 genes were representative in both groups, with no significant overrepresentation of the surface proteins in group B. Twelve genes were identified with significantly different pN or pS values (above the mean ±3 standard deviations), which may be under strong selection, including ECs0550 encoding an adhesion/invasion-like protein, ECs1205 encoding Shiga toxin 2 subunit A, ECs4023 and ECs5273 encoding fimbrial proteins, and ECs4586 and ECs4589 encoding hypothetical proteins related to enterocyte effacement (see Supplemental Table 3).
DNA polymorphisms in pO157s
Plasmids in STEC strains have been shown to be highly heterogeneous, which vary by size (75–100 kb) and gene content (Ostroff et al. 1989; Paros et al. 1993). However, the 92-kb virulence plasmid (pO157) is relatively conserved in Sakai and EDL933 (Burland et al. 1998; Makino et al. 1998). The pO157 encodes many putative virulence factors, including hemolysin (HlyA) and its secretion system (HlyC, B, D) (Schmidt et al. 1995), a functional type II secretion apparatus (etpC–etpO) (Schmidt et al. 1997), an extracellular serine protease (EspP) (Brunder et al. 1997), a periplasmic catalase-peroxidase (KatP) (Brunder et al. 1996), a ToxB homolog from Clostridium difficile (Tatsuno et al. 2001), and a metalloprotease (StcE) (Lathem et al. 2002). In this study, we used the complete Sakai pO157 (92,721 bp) as the reference to resequence and map the nucleotide differences in pO157s from the test strains. Mutation mapping results showed that pO157s of G5289, 01-577, N0436 and N0303 shared identical or nearly identical sequences with Sakai pO157 and differed only by a small number of SNPs. In contrast, pO157s of F8768, F6141, F5733, 493/89, G5101, and N0587 were more polymorphic by both a higher number of SNPs and multiple DNA segment deletions (ranging from 2 to 26 kb) (see Supplemental Fig. 2). Absence of two putative genes of unknown function located between 38 kb and 39.2 kb was common to all five pO157s with deletions. In Sakai pO157, this region is flanked by two highly conserved genes that encode a hypothetical reverse transcriptase (upstream) and a hemagglutinin-associated protein similar to that of Vibrio cholerae (downstream). An 11-kb deletion between the 75-kb and 86-kb positions resulted in loss of katP, espP, one putative gene, and three insertion sequences (IS91, IS600, and IS629) in pO157s of 493/89 and G5101. This observation is consistent with a previous study using PCR methods (Lathem et al. 2003). Another deletion common to 493/89 and G5101 was between the 53-kb and 55-kb positions that led to loss of genes encoding one unknown protein and two IS elements (IS3 and IS21). Interestingly, an adjacent downstream 9.5-kb toxB gene complex was absent only in 493/89 but present in G5101, which distinguished pO157s of these two atypical strains. Absence of toxB in 493/89 apparently did not alter its infectivity because 493/89 had been implicated in several outbreaks of HUS in both Germany and central Europe (Gunzer et al. 1992; Bitzan et al.1993). However, deletion of the toxB gene combined with mutations in other virulence-associated genes (e.g., 12-bp deletion in the flagellar master control gene, flhC) probably led to an altered epithelial cell adherence capability of this nonmotile STEC O157 strain (Tatsuno et al. 2001; Monday et al. 2004).
Premature stop codons
We identified 570 nonsynonymous SNPs in 1199 chromosomal genes; 17 caused premature stop codons in 15 protein-coding genes (Table 2). The majority of premature stop codons were found in the two atypical strains. Some of the premature stop codons were associated with genes encoding hypothetical membrane proteins. A premature stop codon was found between residues 156 and 157 in fimA (encoding the major subunit of type 1 fimbriae), which predicted a truncation of 27 amino acids in a wild-type FimA protein (183 amino acids in length) and thus possible loss of fully functional type 1 fimbrial adhesin.
Premature stop codons caused by single nucleotide replacement in STEC O157 genes
Recombination in chromosomal genes
In silico comparison of the two complete STEC O157 genomes (Sakai and EDL933) with the E. coli K-12 genome revealed a highly mosaic structure in STEC O157 genomes that consisted of a clonal backbone frame (relic of the ancestral chromosome) interrupted by numerous recombined segments, mainly due to insertions and deletions associated with phage elements (Hayashi et al. 2001; Perna et al. 2001). To evaluate the phylogenetic relatedness of the STEC O157 strains used in this study, we first identified a set of 109 synonymous SNPs that were parsimoniously informative (PI) (see Supplemental Fig. 3). Based on these PI sites, we constructed a compatibility matrix that detects the effects of recombination on sequence divergence among the genes harboring these SNPs. Compatibility matrices were first used by Jakobsen and Easteal (1996) to study reticulate evolution. In this plot, two nucleotide sites are considered either compatible if all nucleotide changes at the sites can be inferred to have occurred only once in a phylogeny, or incompatible if nucleotide changes at the sites are inferred to have occurred multiple times possibly owing to recombination or repeated mutation. Figure 3 plots the compatibility matrix between all pairs of 76 synonymous PI sites in backbone genes and 33 synonymous PI sites in S-loop genes. The overall compatibility of all 109 PI sites (5886 pairs) was 86.7%, similar to the mean neighborhood score 83.9% obtained from 1000 randomized matrices, suggesting that recombination among these STEC O157 genes has been rare.
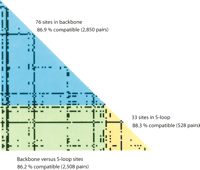
Compatibility matrix of 109 PI synonymous SNPs. The upper triangle (blue) is a plot of pairwise comparison of the phylogenetic compatibility of 76 PI sites in backbone loci. The lower triangle (yellow) is a plot of pairwise comparison of 33 PI sites in S-loop loci. The left corner rectangle (green) is a plot of pairwise comparison of 109 PI sites between backbone and S-loop loci. Highly incompatible sites are indicated by black squares.
We further separated the overall compatibility into three components: a “backbone” component based on the comparison of 2850 pairs of PI sites in backbone genes, an “S-loop” component based on the comparison of 528 pairs of PI sites in S-loop genes, and a “backbone versus S-loop” component based on the comparison of 2508 pairs of PI sites between backbone and S-loop genes (Fig. 3). Interestingly, backbone PI sites (86.9%) and S-loop PI sites (88.3%) showed similar scores of compatibility, indicating that recombination in both regions, if any, has been maintained at a similar rate. The plot of the compatibility matrix revealed several highly incompatible sites that are possibly the hallmarks of past recombination events or mutational hotspots. Five of these incompatible sites were found in backbone genes, including the flagellar biosynthesis gene ECs0257 (T141C and T201C), the putative kinase gene ECs1496 (T717C), ECs3578 (T523C) encoding a membrane-spanning protein of hydrogenase III, and ECs4779 (T195C) encoding molybdopterin-guanine dinucleotide biosynthesis protein B. Two highly incompatible sites found in S-loop loci included ECs1288 (A828C) encoding a putative amino-methyltransferase and ECs1360 (T1470C) encoding an Iha-like adhesin. In sum, the high level of compatibility between synonymous SNPs indicates that recombination and recurrent mutation have not obscured the phylogenetic history of divergence of the O157 genomes.
Synonymous SNP-based strain phylogeny
We used the split decomposition method to detect possible conflicting phylogenetic signals where a high rate of inter-strain gene transfers may be present (Bandelt and Dress 1992). Split decomposition analysis of the 109 PI sites showed a tree-like network for all STEC O157 strains analyzed (Fig. 4), suggesting that a bifurcating tree is an appropriate model for constructing strain phylogeny. Using the same set of PI sites, we constructed a maximum parsimony tree for the 11 STEC O157 strains (Fig. 5A). The maximum parsimony tree had a total length of 134 and showed that 493/89 (GUD+, SOR+) and G5101 (GUD+, SOR−) were phylogenetically distant from the main clusters of typical STEC O157 strains (GUD−, SOR−). Bootstrap analysis showed that all main branches were supported by bootstrap confidence values of >95%. Sakai, G5289, N0436, and N0303 differed by Shiga toxins or epidemiologic background but appeared to be phylogenetically closely related and clustered on a main branch in the maximum parsimony tree (Fig. 5A). N0587, 01-577, F8768, F5733, and F6141 were relatively more distant from the above strains because of higher numbers of synonymous SNPs.
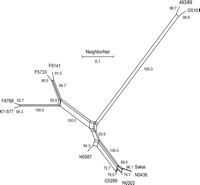
Split decomposition graph of the relationship of STEC O157 strains based on 109 PI synonymous SNPs.
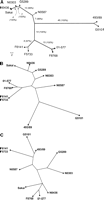
(A) Maximum parsimony tree based on 109 PI synonymous SNPs. Branch lengths are measured in terms of the number of synonymous changes per 100 synonymous sites (dS × 100). Bootstrap values are based on 1000 bootstrap replicates for the consensus tree. (B) Maximum parsimony tree based on XbaI PFGE macrorestriction patterns. (C) Maximum parsimony tree based on variable copy numbers at nine VNTR loci by MLVA.
Comparison to PFGE and MLVA
PFGE is a well-established method for subtyping STEC O157 and other bacterial pathogens (Swaminathan et al. 2001). Recently, MLVA has been shown to be useful for studying the epidemiology of STEC O157 (Noller et al. 2003a; Keys et al. 2005). In this study, we analyzed all strains by using both PFGE and MLVA and constructed maximum parsimony trees based on XbaI restriction patterns (Fig. 5B) and copy numbers at nine tandem repeats loci (Fig. 5C), respectively. Interestingly, two epidemiologically unrelated strains (F5733 and F6141) were indistinguishable by both PFGE and MLVA. However, they differed by 58 SNPs in 53 protein-coding genes. Compared to the SNP-based tree, the PFGE tree showed very similar topology for STEC O157 strains that closely clustered typical (GUD−, SOR−) strains and outlaid two atypical strains (493/89 and G5101). However, both SNP and PFGE trees indicated that G5101 was slightly more distant than 493/89 to typical STEC O157 strains on a bifurcating branch, which conflicted with the stepwise evolutionary model. In contrast, the MLVA tree showed mixed topology for all strains and differed from the SNP tree and the PFGE tree. For example, four typical STEC O157 strains (Sakai, G5289, N0303, N0436) that were closely related in both SNP- and PFGE-based trees were located on distant branches in the MLVA tree. In addition, the two atypical strains G5101 and 493/89 clustered closely to the typical strains in the MLVA tree.
Estimation of time scale in the stepwise evolution of STEC O157
To estimate the divergence time in the stepwise evolutionary model, we first inferred a phylogeny for the STEC O157 strains based on concatenated sequences of the 1199 genes (a combined total of 389,316 codons in 1168 kb of coding sequences) that could be rooted with homologous genes (>90% nucleotide sequence identity over a minimum alignment length of 90% of both genes) from E. coli K-12 (Blattner et al. 1997) or E. coli CFT073 (Welch et al. 2002). We compared both rooted phylogenies with the molecular clock hypothesis by the two-cluster method (Takezaki et al. 1995; Reid et al. 2000). The two-cluster method statistically examines the equality of the average substitution rate for two clusters created by a branch point in a given bifurcating tree to detect heterogeneous gene pairs with significantly faster or slower rates than the average evolutionary rate (Takezaki et al. 1995). Nucleotide data from all STEC O157 strains fit the molecular clock. Estimated divergence times between Sakai (GUD+, SOR−, Stx2+, Stx1+) and 493/89 (GUD+, SOR+, Stx2+) or G5101 (GUD+, SOR−, Stx2+, Stx1+) are shown in Table 3. The calculations were based on the numbers of synonymous substitutions per synonymous site (dS) in each strain and the estimated rate of synonymous substitution between E. coli and S. enterica of 4.7 × 10⁻⁹ per site per year (Doolittle et al. 1996; Lawrence and Ochman 1998). Our results showed that Sakai and 493/89 diverged from a common ancestor between 51.1 and 58.3 thousand years ago, whereas Sakai and G5101 diverged between 39.5 and 39.7 thousand years ago (Table 3). It appears that the loss of sorbitol-fermenting ability preceded the loss of GUD activity by 11–18 thousand years. Figure 6 shows a minimum evolution tree of STEC O157 strains analyzed in this study based on comparison of numbers of synonymous substitutions per nucleotide site in 389,316 allelic codons. The minimum evolution tree showed that 493/89 was more distant to typical STEC O157 strains than G5101. This observation is concordant with the stepwise evolutionary model and the results of previous studies based on multilocus enzyme electrophoresis (MLEE) and MLST methods, which suggested that the GUD+, SOR− STEC O157 clone was a transitional step between an immediate O55:H7 descendent (GUD+, SOR+) and the contemporary STEC O157 (GUD−, SOR−) (Feng et al. 1998; Reid et al. 2000; Wick et al. 2005). In addition, the linearized tree indicated very short divergence times (<1 thousand years) among typical STEC O157 strains.
Estimation of time of divergence between Sakai and two atypical E. coli O157 strains
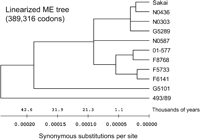
Linearized minimum evolution tree based on 389,316 allelic codons of the STEC O157 strains. The bottom scale shows the divergence time frame (thousands of years) and the number of synonymous substitutions per nucleotide site.
Discussion
Studies of codon usage bias and atypical base composition in both backbone and S-loop genes have suggested that many virulence factors were acquired by STEC O157 through horizontal gene transfers in which bacteriophages have played a predominant role in formation of this pathogen (Lawrence and Ochman 1998; Kim et al. 1999; Hayashi et al. 2001; Ohnishi et al. 2001, 2002; Perna et al. 2001). We found that genes encoding essential virulence factors, such as type III secretion system and Shiga toxins, shared nearly identical nucleotide sequences among diverse STEC O157 strains. This suggested that either the virulence factors were acquired through recent horizontal gene transfers and therefore have not undergone substantial diversification; or defective point mutations in these virulence factors leading to attenuated virulence and infectivity have been purged by natural selection in STEC O157 evolution.
Compared to many foodborne pathogens, such as Listeria monocytogenes (Zhang et al. 2004), nucleotide sequences in STEC O157 protein-coding genes were highly conserved. The average percentage of intragenic polymorphism was ∼0.0102% among typical STEC O157 strains. This polymorphism is also lower than those of many highly clonal bacterial pathogens, for example, Bacillus anthracis (Read et al. 2002; Zwick et al. 2004) and Mycobacterium tuberculosis (Hughes et al. 2002). Synonymous and nonsynonymous substitutions arise from random nucleotide mutation, sometimes followed by selection, and from horizontal gene transfer and intragenic recombination events (Reid et al. 2000). In this study, however, we did not detect evident balancing selection in STEC O157 genes as observed in M. tuberculosis and other haploid organisms (Hughes et al. 2002). We found that the majority of SNPs (62.8%) were nonsynonymous; 17 nonsynonymous SNPs caused premature stop codons in protein-coding genes. These nonsynonymous SNPs could possibly lead to “pathoadaptive” niche expansion and provide a selective advantage in both sporadic infection and epidemic spread (Sokurenko et al. 1998; Weissman et al. 2003). For example, nonsynonymous SNPs in the fimH gene can alter the affinity of type 1 frimbriae of uropathogenic E. coli for monomannose receptors (Sokurenko et al. 1998; Pouttu et al. 1999). Changes in affinity to monomannose receptors are directly correlated with increased or decreased bacterial tropism for uroepithelium and thus bladder colonization. In addition, some nonsynonymous SNPs may also be associated with host specificity and geographical origins (Kim et al. 1999, 2001; Wong et al. 2004).
Synonymous SNPs exhibit extremely low mutation rates and are expected to be evolutionarily neutral or near so, therefore providing useful markers for studying population genetics and the epidemiology of bacterial pathogens (Maiden et al. 1998). Analysis of a higher number of informative synonymous SNPs identified in this study will improve the discriminatory ability of DNA sequence-based subtyping approaches for highly clonal STEC O157 strains. Topological discrepancies between the SNP phylogenetic tree and the PFGE or MLVA trees indicated that portions of STEC O157 genomes harboring these genetic variations have diversified through different mechanisms at variable rates. To examine whether SNPs contribute to variation in the PFGE pattern, we analyzed 19 of 40 XbaI restriction sites that were located in protein-coding genes in the Sakai genome. None of the 906 SNPs was located in XbaI restriction sites. This finding is consistent with those of Kudva et al. (2002), who found that variation in PFGE patterns among STEC O157 strains is primarily a result of insertions, deletions, or duplications of discrete genomic segments containing XbaI restriction sites. Wick et al. (2005) used genomic microarrays to examine changes in gene content in the stepwise model of O157 evolution and estimated that genomic divergence due to insertions and deletions accumulated ∼140 times more frequently than point mutations in STEC O157 genomes. This explains why PFGE often provides better strain differentiation than MLST-based methods for STEC O157 (Noller et al. 2003b; Foley et al. 2004). Higher mutation rates of insertion or deletion or duplication in STEC O157 genomes may also explain unpredictable PFGE restriction pattern changes during repeated subculturing and prolonged storage at room temperature (Iguchi et al. 2002). Similar to PFGE, MLVA targets highly variable loci of tandem repeats with unpredictable mutation rates and, therefore, is not suitable for long-term epidemiological and evolutionary studies (Noller et al. 2003a; Keys et al. 2005). In contrast, intragenic SNP analysis provides better strain differentiation and concordant results with the stepwise evolution model and, consequently, can be more useful than PFGE or MLVA to subtype and infer genetic relatedness of STEC O157 strains.
Genome-wide SNP data allow a more comprehensive and precise estimation of the time frame involved in STEC O157 evolution than previous MLST data based on six to 10 loci (Noller et al. 2003b; Foley et al. 2004). Molecular clock tests in our study suggested that the contemporary STEC O157 lineage diverged from a GUD+, SOR+ ancestral clone ∼51–58 thousand years ago. Although ∼50 thousand years seem short compared to the evolutionary history of the E. coli species (e.g., millions of years), it is noteworthy that the existence of STEC O157 has possibly spanned one-fourth of the entire history of the modern human species, Homo sapiens (∼200 thousand years). In contrast to its possible existence for thousands of years, STEC O157 seemed to diversify in the past few hundred years (Fig. 6) and was not identified as a human pathogen until the 1980s. The recent emergence of STEC O157 as a human pathogen could have resulted from changes in its ecology (e.g., host shift from isolated wild ruminants to cattle), virulence (e.g., acquisition of new virulence factors or recently enhanced expression of toxin genes or spread of ancillary virulence elements), human susceptibility (e.g., reduced exposure to enteropathogenic E. coli infections as children in developed countries may have led to increased susceptibility to attaching-effacing infections), and bacterial adaptation (e.g., enhanced acid resistance has allowed STEC O157 to compete with commensal E. coli and achieve higher densities in the reservoir). More in-depth phylogenetic and functional analyses should create new insights into the virulence acquisition and geographical dissemination after the ancestry divergence of STEC O157.
High-density sequencing microarrays have been previously used to identify novel genetic variations in populations of viral genomes (Wong et al. 2004) and relatively small regions of bacterial genomes (Read et al. 2002; Zwick et al. 2004). In this study, we chose to use the comparative genome sequencing (CGS) microarray because it allowed high-throughput resequencing of ∼1.2 Mb of nucleotides (equivalent to 1200–1500 bacterial genes) on a single microscope slide, providing a cost-effective alternative to traditional capillary sequencing or standard resequencing arrays for genome-wide SNP discovery (Albert et al. 2005). To evaluate the accuracy of this CGS strategy, we validated 100 SNPs identified by CGS microarrays using both “hairpin” primer PCR assays (Hazbon and Alland 2004) and traditional capillary sequencing. The false-positive rate for CGS-called bases was close to zero, but the false-negative rate was ∼3% compared to PCR and capillary sequencing results. Unlike whole-genome shotgun sequencing, CGS is a “sequencing by hybridization” approach based on available reference genomes, and therefore cannot be used to discover genomic variations (e.g., new genes) that are present in test genomes but absent in reference genomes. In addition, CGS has limited capacity to resolve repetitive elements, and therefore is not suitable for analyzing gene duplications or tandem repeats, which are often the predominant forms of genetic variation among highly clonal bacterial genomes. A variety of high-throughput SNP genotyping platforms are now available, such as multiplex PCR assays (Zhou et al. 2005), single-base extension mass spectrometry assays (Stanssens et al. 2004), and pyrosequencing assays (Alderborn et al. 2000). Careful selection of informative SNPs and combination of high-throughput platforms will allow SNP genotyping to be a highly discriminatory and cost-effective tool to study bacterial evolution and epidemiology at a population scale.
Methods
Bacterial strains
STEC O157 strains were selected from the reference collection at the Centers for Disease Control and Prevention (Table 1). Shiga toxin genes (stx1 and stx2) were detected by using a multiplex PCR assay (Olsvik et al. 1991). Bacterial cells were grown in 30 mL of brain heart infusion broth at 37°C to stationary phase and harvested. Genomic DNA was extracted using the phenol-chloroform method (Brenner et al. 1982) and stored at −20°C before use.
Microarray design and probe synthesis
A list of selected chromosomal genes is provided in Supplemental Table 1. Oligonucleotide tiling probes were designed for each gene using the ArrayScribe software (NimbleGen System) based on Sakai gene sequences (http://genome.gen-info.osaka-u.ac.jp/bacteria/o157). Details of the probe design algorithm are provided as Supplemental material with this article. The oligonucleotide probes were synthesized using the Maskless Array Synthesis (MAS) technology as previously described (Singh-Gasson et al. 1999; Nuwaysir et al. 2002) and printed in a random layout.
Fragmentation and labeling of genomic DNA
For each sample, an aliquot of 5 μg of genomic DNA was digested with 0.005 U of DNase I (Amersham Biosciences) in 1× One-Phor-All buffer (Amersham Biosciences) for 5 min at 37°C. DNase I was then inactivated by incubation for 15 min at 97°C. Digested genomic DNA was end-labeled in 4 μL of 5× Terminal Transferase buffer (Promega) with 1 nmol Biotin-N6-ddATP (Perkin Elmer) and 25 U of Terminal Deoxynucleotidyl Transferase for 90 min at 37°C. Terminal transferase was inactivated by incubation for 15 min at 95°C before hybridization.
Mutation mapping
Mutation mapping arrays were used to locate potential SNPs in genes of a test strain by tiling 29-mer probes with 7-base spacing for both strands (Albert et al. 2005). We designed a mutation mapping array containing ∼340,000 probes to tile complete nucleotide sequences (∼1.2 Mb) of the selected chromosomal genes and pO157. Each labeled genomic DNA sample was hybridized with a separate mutation mapping array in 1× NimbleGen hybridization buffer [100 mM MES, 2.5 M tetramethylammonium chloride, 0.01% (v/v) Tween 20] with a Hybriwheel apparatus for 16 h at 45°C. After hybridization, arrays were washed with nonstringent buffer (6× SSPE, 0.01% Tween 20) for 5 min followed by two 5-min washes with stringent buffer (100 mM MES, 0.1 M NaCl, 0.01% Tween 20) at 47.5°C. The arrays were then strained with Cy3-streptavidin conjugation solution (Amersham Bioscience) followed by a secondary labeling with biotinylated goat anti-streptavidin (Vector Laboratories). The arrays were washed with nonstringent buffer and re-stained with Cy3-streptavidin. After two 30-sec washes in 0.5× SSC and one 15-sec wash in 70% ethanol, arrays were spun dry and scanned at 5 μm resolution using the Genepix 4000b scanner (Axon Instruments). Pixel intensities were extracted using NimbleScan software (NimbleGen Systems). Probe intensity ratios between the test and reference genes were calculated and plotted against the genome position, providing a high-resolution map of mutation sites across the genome and localizing each mutation to a window of 29 bases (the length of the reporting probe). Probe intensity ratios significantly above the background were designated as putative SNP sites, and the corresponding probe sequences were selected for resequencing (see Supplemental material for algorithm).
Resequencing
Resequencing microarrays were used to identify the exact nucleotide at each potential SNP site by detecting the differential hybridization signals of sample DNA to short perfect-match (PM) and mismatch (MM) probes (Wong et al. 2004; Albert et al. 2005). Each potential SNP to be queried was located near the central position of a PM oligonucleotide probe. Three additional MM probes representing the three possible mismatch nucleotides at the same position are also synthesized to query each base position on the array. Probe length and mismatch positions are varied based on probe melting temperature (see Supplemental material). The differences in hybridization signal intensities between sequences that bond strongly to the PM probes and those that bond poorly to the corresponding MM probes were used to determine the matched base at a given SNP position (Albert et al. 2003; Wong et al. 2004). We designed resequencing microarrays containing ∼392,000 probes with four probes per base position for each strand. A total of 48,600 bases were resequenced for each strain. Resequencing microarrays were hybridized with labeled genomic DNA samples and scanned following the same protocol as described in the mutation mapping step. Mutation mapping and resequencing steps were repeated twice on separate days. Results were shown to be reproducible and consistent in both runs. A list of 906 newly identified SNPs is provided in Supplemental Table 2.
SNP validation
One hundred SNPs identified by CGS microarrays were validated by using both hairpin primer (HP) PCR assays (Hazbon and Alland 2004) and capillary sequencing with an ABI 3100 Genetic Analyzer.
The false-positive rate and false-negative rate of CGS were calculated based on the HP PCR and capillary sequencing results. PCR primers and experimental protocols for hairpin primer PCR assays are available upon request.
PFGE and MLVA
PFGE was performed using XbaI enzymatic digestion (Roche Applied Science) following the PulseNet standard protocol for subtyping STEC O157 (Swaminathan et al. 2001). PFGE patterns were saved as TIFF files for analysis. Nine VNTR loci (nos. 3, 9, 10, 17, 19, 25, 34, 36, 37) were selected from a previous study (Keys et al. 2005) and analyzed for all STEC O157 strains in this study. Briefly, bacterial cells were grown on trypticase soy agar overnight at 37°C. Two colonies were suspended in 100 μL of distilled water, boiled for 20 min, and directly used for PCR amplification. An aliquot of 1 μL of diluted (1:60) PCR products was then mixed with 20 μL of GenomeLab Sample Loading solution and 0.08 μL of 600-bp DNA size standard (Beckman Coulter) and loaded in a CEQ 8000 capillary electrophoresis system (Beckman Coulter). The sizes of PCR products were imported to BioNumerics software version 4.0 (Applied Maths) for analysis.
Phylogenetic analysis
For SNP data, the Reticulate program was used to identify putative regions of recombination or gene conversion through the construction of a compatibility matrix (Jakobsen and Easteal 1996). Split decomposition analysis was performed using the SplitsTree program to detect conflicting phylogenetic information and determine if a bifurcating tree is an appropriate model to construct strain phylogeny (Huson 1998). A maximum parsimony tree for STEC O157 strains was constructed by using MEGA software version 3.0 (http://www.megasoftware.net) based on the numbers of parsimoniously informative sites and the results of a bootstrapping test of strain phylogeny (Kumar et al. 2004). Tests of the molecular clock hypothesis were performed by using the LinTree programs with the two-cluster method (Takezaki et al. 1995) based on concatenated gene sequences. Perl scripts were developed to generate the allelic gene sequences for the 10 STEC O157 strains. For each of the resequenced genes, homologous genes in E. coli K-12 (Blattner et al. 1997) and E. coli CFT073 (Welch et al. 2002) genomes were identified by standalone BLAST search (http://www.ncbi.nlm.nih.gov/BLAST/download.shtml). Using the threshold of 90% nucleotide sequence identity over a minimum alignment length of 90% of both genes, 764 and 729 homologous genes were identified in K-12 and CFT073 genomes. Protein sequences of the homologous genes were aligned using the CLUSTALW program (Thompson et al. 1994). Homologous genes were then aligned using the EMBOSS (Rice et al. 2000) Tranalign program, and the corresponding amino acid sequence alignment was imposed on the DNA sequence alignment. Allelic genes and homologous genes with alignment gaps were then concatenated. The numbers of synonymous substitutions per synonymous site were calculated from the concatenated nucleotide sequences using the modified Nei-Gojobori Jukes Cantor method (Kumar et al. 2004). Both pairwise deletion (total of 388,066 sites) and complete deletion (total of 223,939 sites) methods were used for handling alignment gaps. A minimum evolution tree was constructed by using the MEGA software based on the numbers of synonymous substitutions per nucleotide site in 1199 chromosomal genes in STEC O157 strains. For PFGE and MLVA data, maximum parsimony trees were constructed by using the BioNumerics software version 4.0 (Applied Maths) based on a binary table of XbaI restriction profiles for PFGE and a category table of variable copy numbers at the nine VNTR loci for MLVA, respectively.
Acknowledgments
We thank Kara Cooper and Silvia Herrera-Leon for helpful discussion on the experimental design and Arnold Steigerwalt for technical assistance on genomic DNA preparation. We also thank Andrew Benson and Cheryl Tarr for insightful comments on the manuscript. This work is supported by appropriations under the National Food Safety Initiative to the Centers for Disease Control and Prevention. W.Z. is a recipient of an American Society for Microbiology postdoctoral research fellowship. The work was also supported in part with Federal funds from NIH Research Grant #R01-Al-49352 (D.A.) and NIH Research Contract #N01-Al-30058 (T.S.W.).
Footnotes
- 6
↵6 Corresponding author.
↵6 E-mail zhangw{at}iit.edu; fax (708) 563-1873.
-
[Supplemental material is available online at www.genome.org.]
-
Article published online ahead of print. Article and publication date are at http://www.genome.org/cgi/doi/10.1101/gr.4759706
-
- Received October 4, 2005.
- Accepted February 15, 2006.
- Cold Spring Harbor Laboratory Press


