
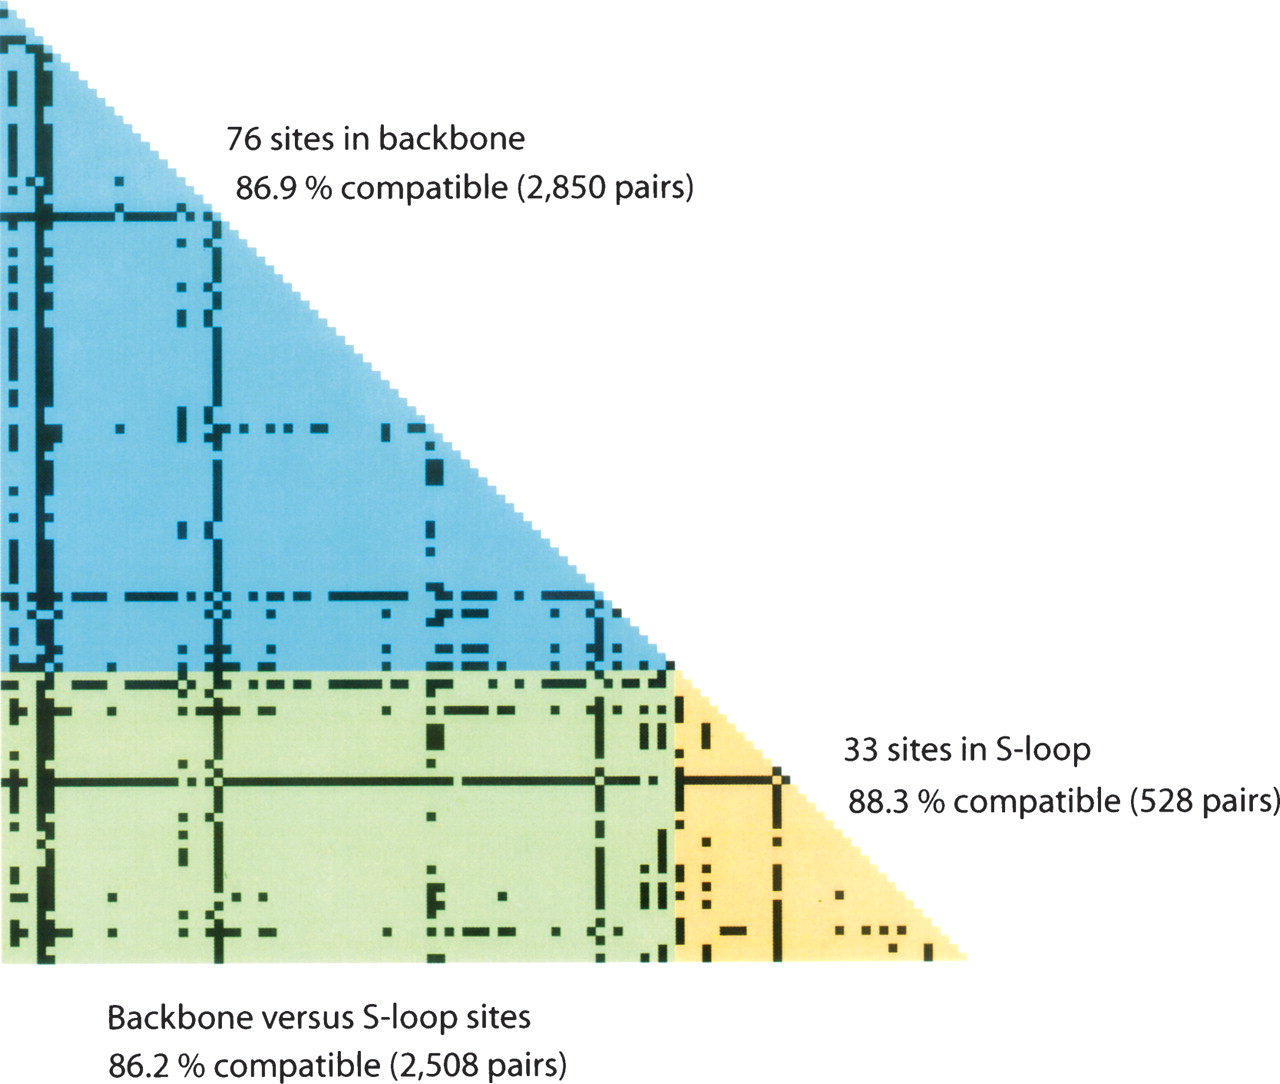
Figure 3.
Compatibility matrix of 109 PI synonymous SNPs. The upper triangle (blue) is a plot of pairwise comparison of the phylogenetic compatibility of 76 PI sites in backbone loci. The lower triangle (yellow) is a plot of pairwise comparison of 33 PI sites in S-loop loci. The left corner rectangle (green) is a plot of pairwise comparison of 109 PI sites between backbone and S-loop loci. Highly incompatible sites are indicated by black squares.


