
Mapping RIKEN full-length cDNAs (The FANTOM Consortium and the RIKEN Genome Exploration Research Group Phase I and II Team 2002) to the genome assemblies enables a variety of analyses to be performed. First, exon structure can be determined, and coding and noncoding regions can be inferred, due to different average exon length. In some cases, the alternative exon structures may be identified at this stage. Second, chromosome position can be used to identify the correct ortholog in human, for which functional data may be available. Third, intronless genes can be identified and examined carefully to determine whether they are retransposition events, pseudogenes, or genomic contamination. Finally, high-quality sequence discrepancies can be identified as potential SNPs by use of the fact that RIKEN and Mouse Genome Sequencing Consortium sequenced the C57BL/6J mouse strain, whereas the four mouse strains sequenced by Celera included 129X1/SvJ, 129S1/SvImJ, DBA/2J, and A/J.
We have mapped 60,770 RIKEN clones by BLAT (Kent 2002) to the MGSC (Mouse Genome Sequencing Consortium 2002) genome assembly versions 1 and 3, Ensembl human genome assembly v.28 and the Celera mouse genome assembly releases R12 and R13, and human assembly Release R26i (http://cds.celera.com/; Table 1).
The Counts of Unambiguously Mapped RIKEN Clones
Assembly | Total at 90% length | Total at 80% L | Total at 70% L | Single-exon | Single-exon longer 1 Kb | 2 ex | 3 ex | 4 ex | 5 ex | 5+ exons |
|---|---|---|---|---|---|---|---|---|---|---|
| MGSC v.1 | 44091 | 49289 | 51952 | 14857 | 11229 | 8443 | 5205 | 4051 | 3277 | 16148 |
| Celera R12 | 51795 | 55397 | 57108 | 15190 | 11509 | 8474 | 5947 | 4664 | 3771 | 19082 |
| Celera R13 | 57694 | 58866 | 59422 | 17433 | 13436 | 8024 | 5710 | 4631 | 3775 | 19867 |
|
MGSC v.3 |
58001 |
59335 |
59858 |
20060 |
15844 |
7072 |
5167 |
4312 |
3685 |
19582 |
The single-exon clones longer than 1 Kb are candidates for further investigation as bona fide intronless genes, retransposition events, or possible genomic DNA contamination. For this investigation, the expression profile of an intronless clone can be very informative (Su et al. 2002).
This analysis also allows us to roughly compare the completeness of the assemblies. Of 60,172 RIKEN cDNAs containing >100 non-masked bases, >99% were mapped at >70% length to both latest assemblies, much more complete than the earlier assemblies.
Figure 1 illustrates the comparison of the mapping to four assemblies. MGSC v.3 in green as left bars, Celera R13 in blue as right bars for each chromosome. Where RIKEN clones mapped to both assemblies, a cyan line connects the mapping positions, whereas triangles mark clones mapped exclusively to one assembly. The large-scale discrepancies are marked in red. One can observe a 10-Mb contig inversion on chromosome X (later detected and corrected by MGSC) and smaller ones on chr.5, 17, 18, 19, etc. The up-to-date scalable version of the mapping comparison is available at http://www.gnf.org/RIKEN/.
Mapping of RIKEN Clones. (Green) MGSC v.3; (blue) CMGD R13.
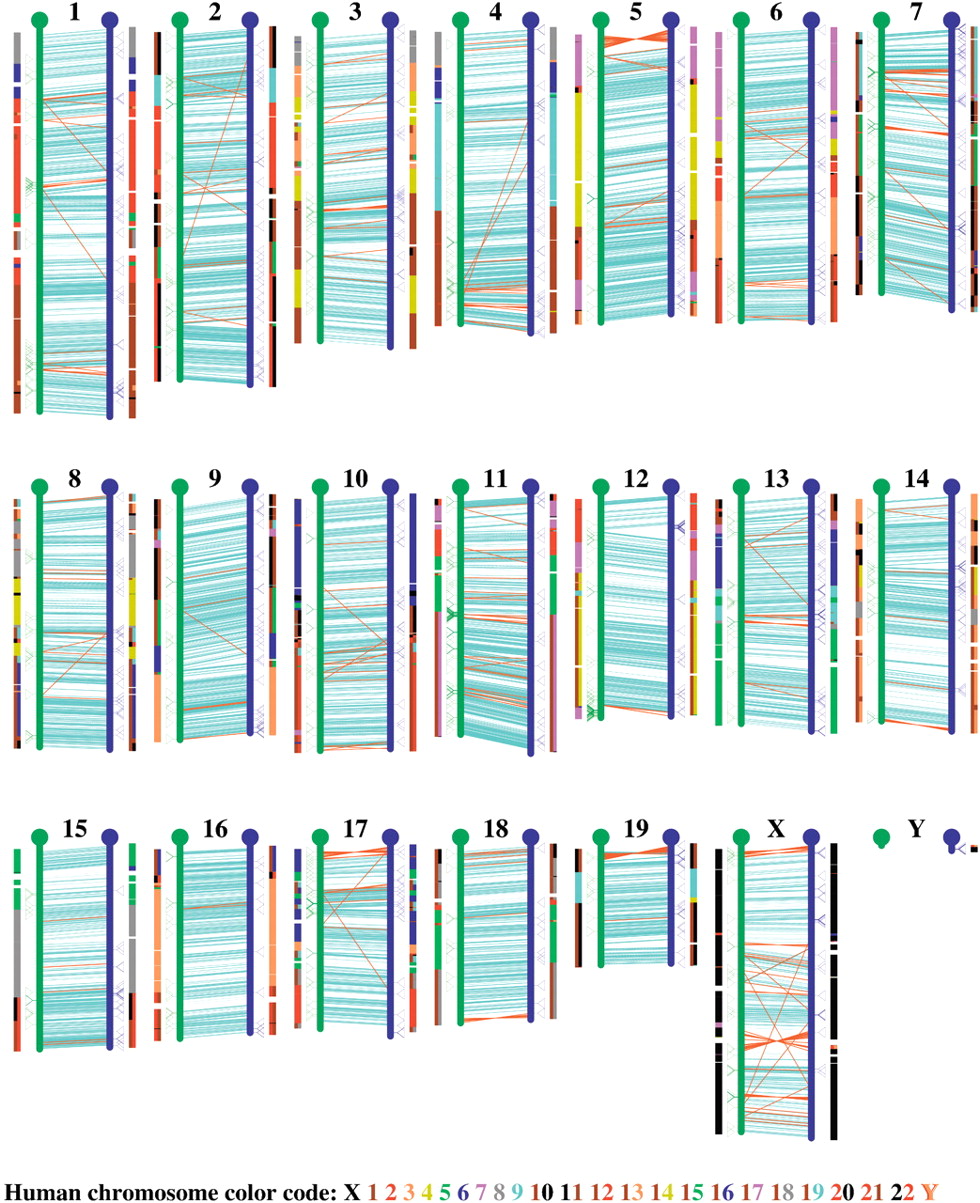
The extra bars represent superimposed syntenic regions identified by mapping to human assemblies, NCBI v.28 left from MGSC v.3, Celera R26h right from the mouse Celera R13. The two-digit electric color code for human chromosomes is shown at the bottom. Several cases of different syntenic assignment deserve further investigation.
Notes
[1] Article and publication are at http://www.genome.org/cgi/doi/10.1101/gr.1458903.
[2] Corresponding author. E-MAIL [email protected]; FAX (858) 812-1570.
References
- ↵The FANTOM Consortium and the RIKEN Genome Exploration Research Group Phase I and Phase II Team. 2002. Analysis of the mouse transcriptome based on functional annotation of 60,770 full-length cDNAs. Nature 420: 563 -573.
- ↵Kent, W.J. 2002. BLAT—The BLAST-Like Alignment Tool. Genome Res. 12: 656 -664.
- ↵Mouse Genome Sequencing Consortium. 2002. Initial sequencing and comparative analysis of the mouse genome. Nature 420: 520 -562.
- ↵Su, A.I., Cooke, M.P., Ching, K.A., Hakak, Y., Walker, J.R., Wiltshire, T., Orth, A.P., Vega, R.G., Sapinoso, L.M., Moqrich, A., et al. 2002. Large-scale analysis of the human and mouse transcriptomes. Proc. Natl. Acad. Sci. 99: 4465 -4470.