
Abstract
We have developed a new method for high-throughput genotyping of single nucleotide polymorphisms (SNPs). The technique involves PCR amplification of genomic DNA with two tailed allele-specific primers that introduce priming sites for universal energy-transfer-labeled primers. The output of red and green light is conveniently scored using a fluorescence plate reader. The new method, which was validated on nine model SNPs, is well suited for high-throughput, automated genotyping because it requires only one reaction per SNP, it is performed in a single tube with no post-PCR handling, the same energy-transfer-labeled primers are used for all analyses, and the instrumentation is inexpensive. Possible applications include multiple-candidate gene analysis, genomewide scans, and medical diagnostics.
Single nucleotide polymorphisms (SNPs) are the most common source of human genetic variation. The potential use of SNPs for genetic mapping of complex traits, pharmacogenetics, and medical diagnostics has been much discussed (Kruglyak 1997; Gu et al. 1998; Nebert 1999; McCarthy and Hilfiker 2000). Such applications require reliable and economical methods for high-throughput SNP genotyping.
The original SNP genotyping methods—DNA sequencing and PCR-RFLP—are laborious and expensive because they require multiple steps including size separation. Subsequently, several other methods for discriminating SNPs have been described including hybridization with allele-specific probes (Tyagi et al. 1998; Marras et al. 1999), allele-specific PCR (Newton et al. 1989; Okayama et al. 1989), primer-guided nucleotide or dye-terminator incorporation (Syvanen et al. 1990; Pastinen et al. 1996; Chen and Kwok 1997; Chen et al. 1997, 1999; Hoogendoorn et al. 1999), oligonucleotide ligation (Baron et al. 1996), and Flap Endonuclease digestion (Lyamichev et al. 1999; Mein et al. 2000). Although these methods improve SNP genotyping, they involve multistep sample processing, which is a disadvantage in high-throughput tasks. More recently a number of techniques have been developed that reduce sample processing to a single step by using nick-translation PCR (Lee et al. 1993), hybridization with FRET probes (Kostrikis et al. 1998), recording the melting curves (Blomeke et al. 1999; Germer and Higuchi 1999; Mangasser-Stephan et al. 1999; Nauck et al. 1999), fluorogenic allele-specific PCR (Matsubara et al. 1999), or a thermostable ligase reaction (Chen et al. 1998). The drawbacks of these methods are that the reactions must be monitored in real time, which requires expensive instrumentation, and/or it is necessary to design and size a costly new FRET probe for each SNP. Recently Whitcombe et al. (1998) described a single-tube SNP genotyping method using universal TaqMan probes, andKwiatkowski et al. (1999) used universal FRET reagents in a single-step Invader assay (Third Wave Technologies) with endpoint measurement.
Here we present a new SNP genotyping method that is performed in a single step, uses the same reporting reagent for each polymorphism, and does not require real-time monitoring equipment. The reactions are run in a single tube in a generic PCR machine and read in a standard fluorescent plate reader. Our method combines allele-specific PCR (Newton et al. 1989; Okayama et al. 1989) with the use of Amplifluor TM universal energy-transfer (ET) labeled primers (Nazarenko et al. 1997;Nuovo et al. 1999).
RESULTS
Principle of the Method and Primer Design
Genomic DNA is submitted to PCR in the presence of five primers: Two tailed allele-specific primers, a reverse primer, and two universal ET-labeled primers of which one is labeled with a green dye (fluorescein) and the other a red dye (sulforhodamine). Following amplification, the products are analyzed for green and red fluorescence in a plate reader. The aim is for one homozygous genotype to yield green fluorescence only, the other homozygous genotype to give red fluorescence only, and the heterozygous genotype to give mixed red and green fluorescence.
Two different tailed allele-specific primers are used to analyze each SNP. These primers contain a single allele-specific nucleotide at the 3′ terminus preceded by 16 to 21 bases complementary to the gene of interest (Table 1). The length of the gene-complementary portion of the primer is selected to give aTm of 69°–75°C as calculated by the %GC method of Oligo 5.0 software. There is a different 21-base tail at the 5′ end of each of the two primers.
SNP-Specific Primers
| SNP name | GenBank ID dbSNP ID | Type | Allele-specific tailed forward primers[i] | Reverse primer |
| CCK | L29399 | A/G | [tail 1] -GGCTGTCTCTTAAATAGCCCCG | GTTACTGCCAGTCTGCGTCA |
| [tail 2] -GGCTGTCTCTTAAATAGCCCCA | ||||
| CYP17 | M19489 | C/T | [tail 1] -GCCACAGCTCTTCTACTCCACT | GGCACCAGGCCACCTTCTCTT |
| [tail 2] -GCCACAGCTCTTCTACTCCACC | ||||
| DRD1 | X55758 | A/G | [tail 1] -GACCCCTATTCCCTGCTTA | ACAGGCAGTGAGGATACGAACA |
| rs4532 | [tail 2] -GACCCCTATTCCCTGCTTG | |||
| DRD2 | X51645 | C/T | [tail 1] -CCGACCCGTCCCACCAC | CTTGGGGTGGTCTTTGGCAT |
| rs6275 | [tail 2] -CCGACCCGTCCCACCAT | |||
| HTR1B | M81590 | C/G | [tail 1] -CCGGATCTCCTGTGTATGTG | GCGGCCATGAGTTTCTTCTTT |
| rs6296 | [tail 2] -CCGGATCTCCTGTGTATGTC | |||
| HTR2A | S71229 | C/T | [tail 1] -CTACAGTAATGACTTTAACTCC | CACAGGAAAGGTTGGTTCGATT |
| [tail 2] -CTACAGTAATGACTTTAACTCT | ||||
| HTR2C | X80763 | G/C | [tail 1] -GGGCTCACAGAAATATCAG | TGCACCTAATTGGCCTATTGGTTT |
| rs6318 | [tail 2] -GGGCTCACAGAAATATATCAC | |||
| MAOA | M68840 | G/T | [tail 1] -GACAGCTCCCATTGGAAGT | GCGATCCCTCCGACCTTGACT |
| rs6323 | [tail 2] -GACAGCTCCCATTGGAAGG | |||
| rs363 | AC002525 | A/T | [tail 1] -GGGTTTTGAGGCTTCCTTGTT | ACCCGTTGTCGGCTGTGGATTT |
| rs363 | [tail 2] -GGGTTTTGAGGCTTCCTTGTA |
[i] [tail 1] = GAAGGTGACCAAGTTCATGCT
[ii] [tail 2] = GAAGGTCGGAGTCAACGGATT
The sequences for the reverse primers were chosen so as to avoid inverted repeats and overlaps with the allele-specific and ET-labeled primers, which could result in mispriming. The distance between the allele-specific and reverse primers was not critical and varied from 7 to 157 bp in our experiments.
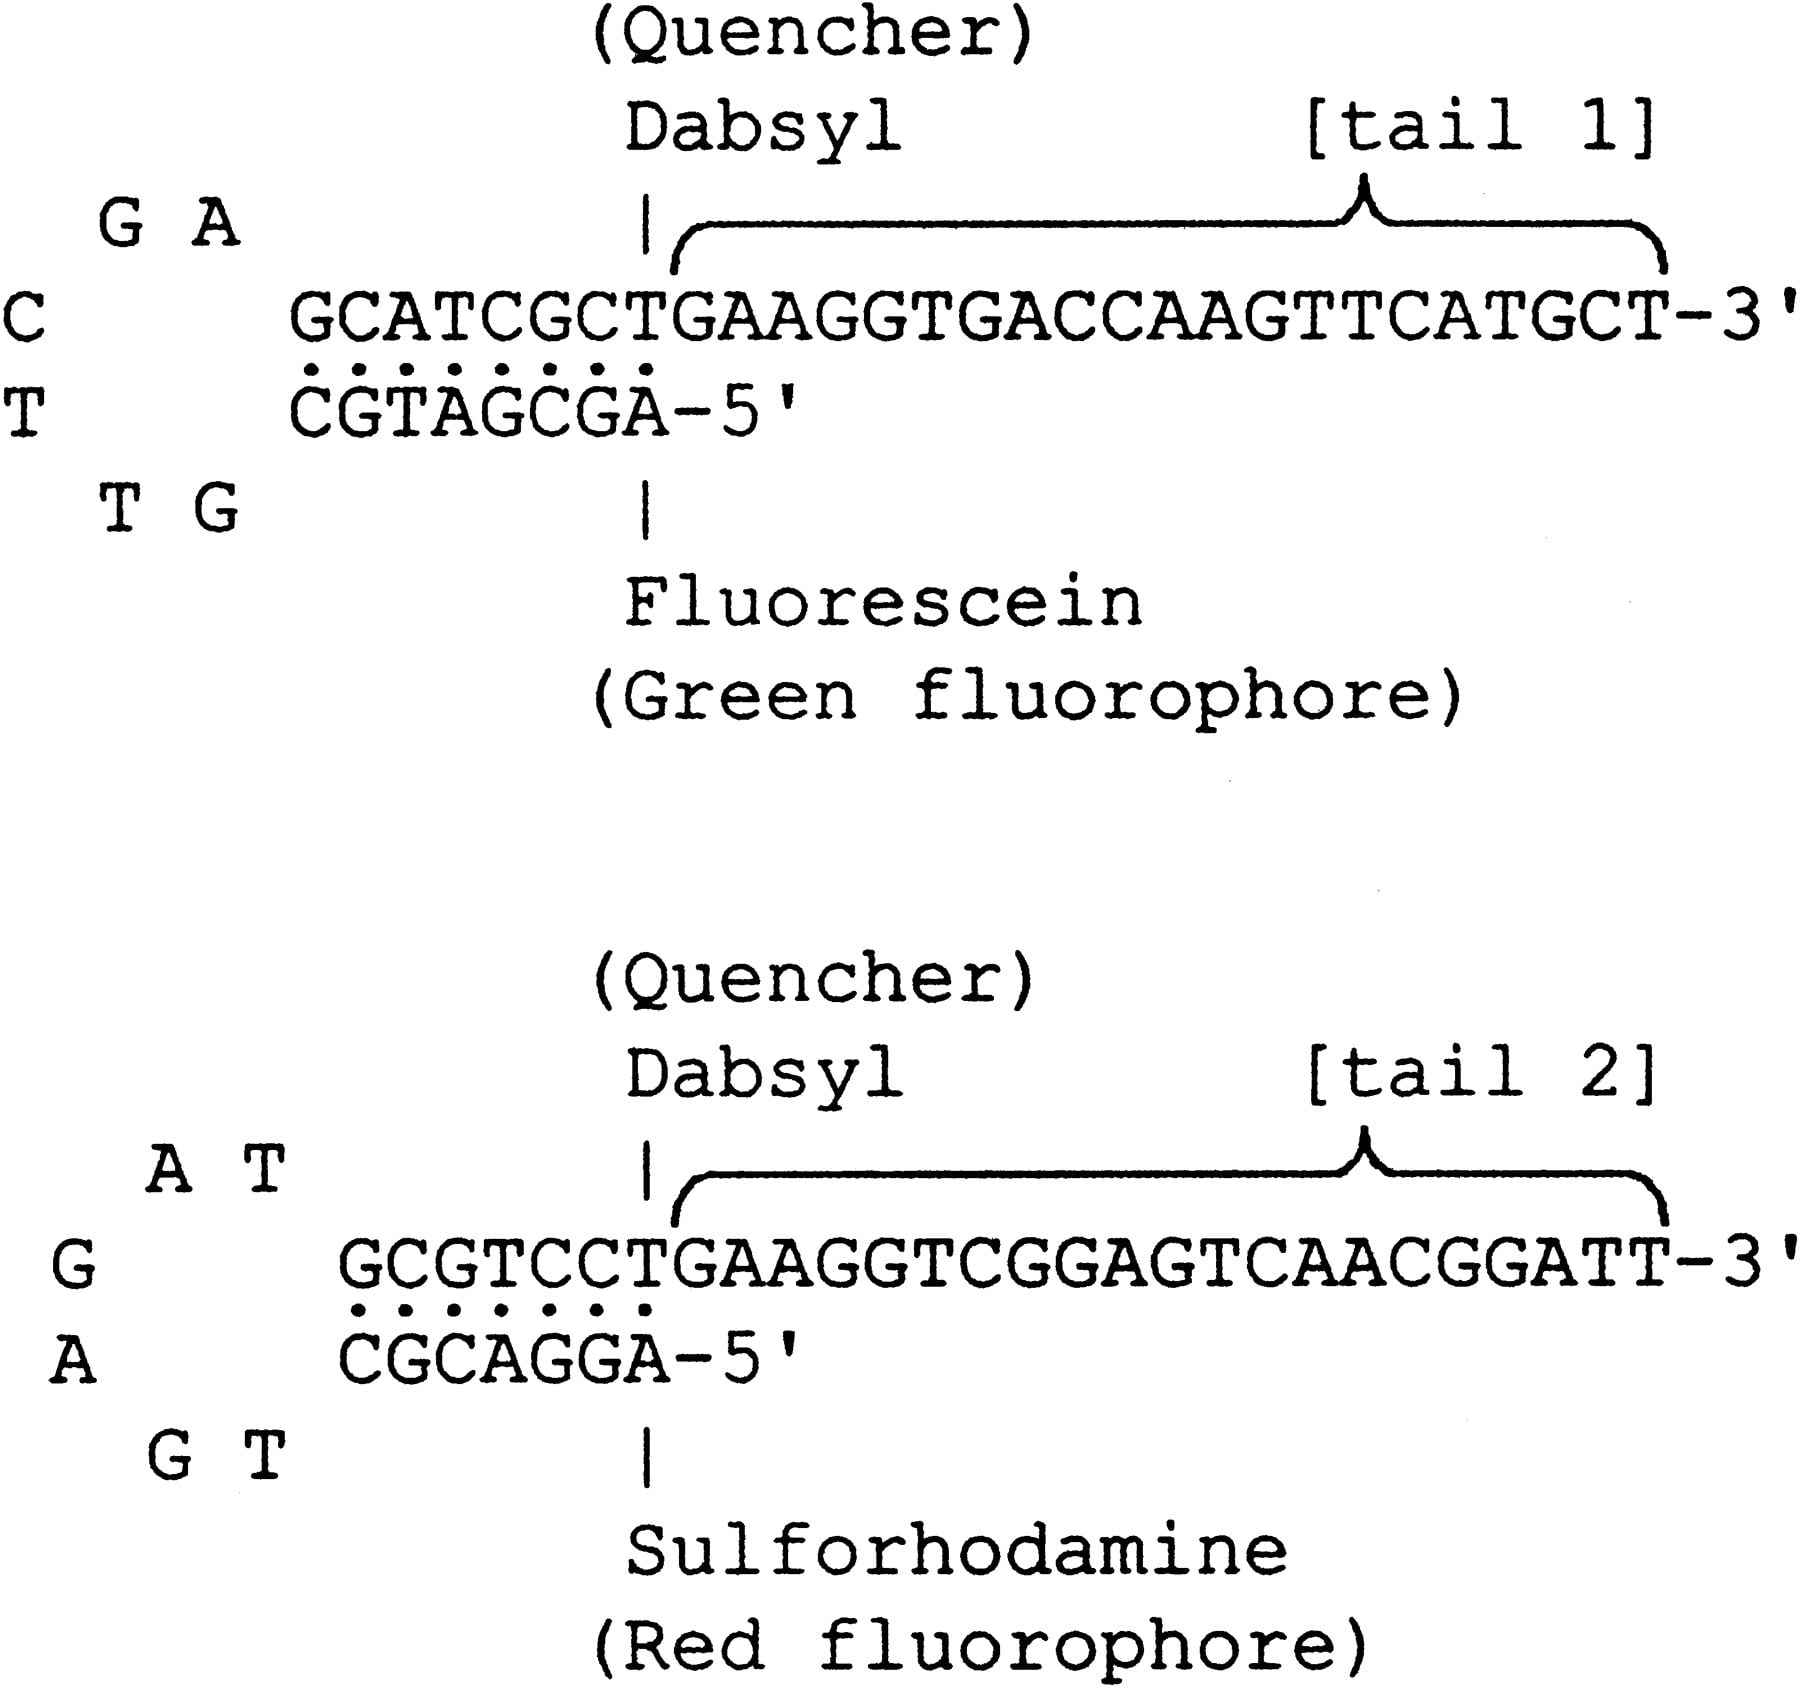
The structure of the universal ET-labeled primers (Amplifluor TM, Intergen; Nazarenko et al. 1997) is shown in Figure1. The 3′-priming domain of these primers is identical to the tail on one of the allele-specific primers. The 5′ hairpin structure contains both a fluorophore (fluorescein or sulforhodamine) and a quencher (Dabsyl). Prior to incorporation, the primers are in a hairpin configuration that emits fluorescence at only a low background level because the energy from the fluorophore is transferred to the nearby Dabsyl moiety and dissipated as heat. However, after incorporation into the PCR product, the primer is linearized, which leads to the separation of the fluorophore and the quencher and a marked enhancement of fluorescence.
Structure of universal energy-transfer-labeled primers.
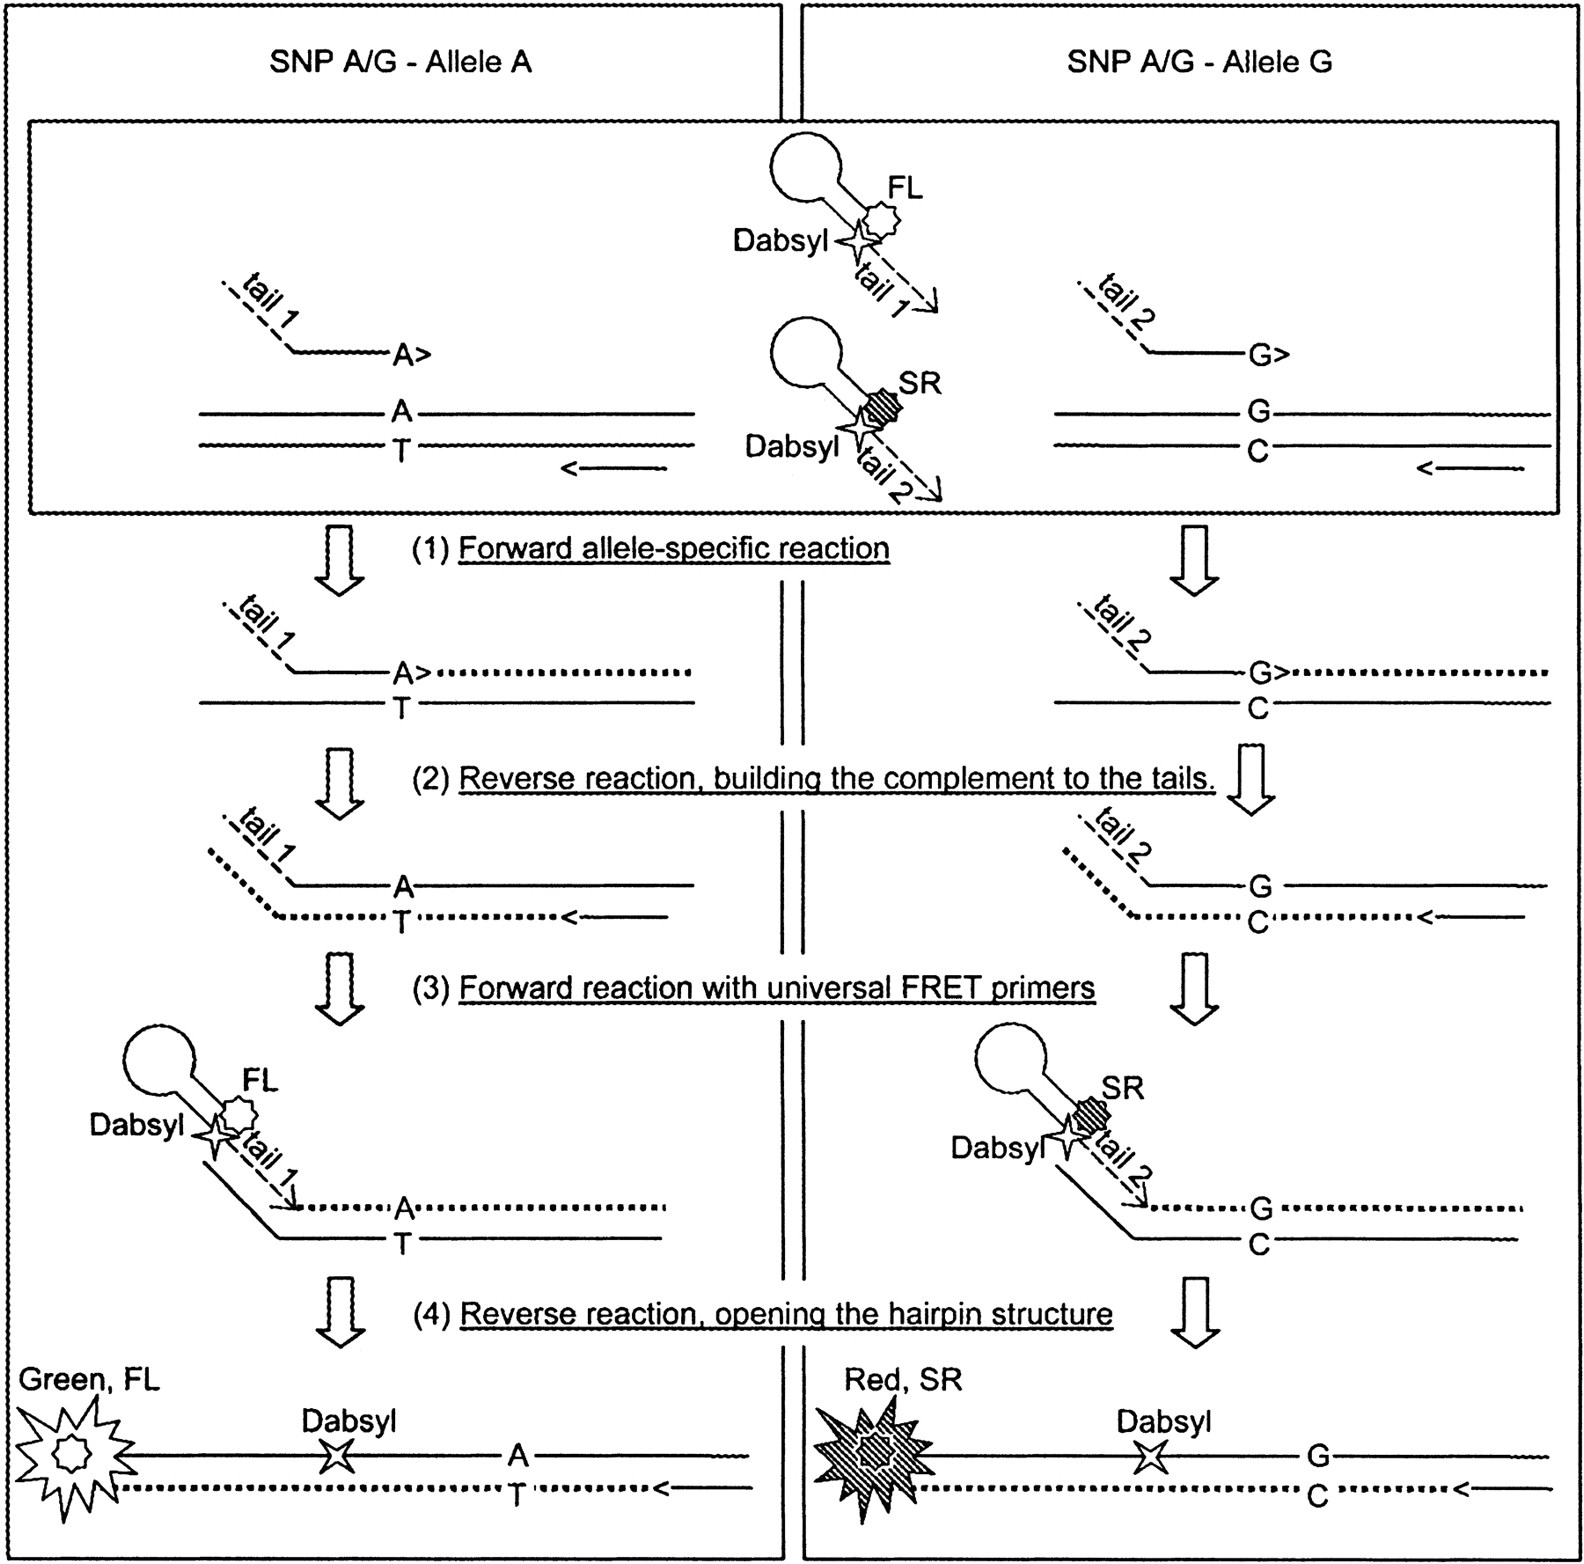
The step-by-step reaction scheme for an A/G SNP is shown in Figure2. During the first cycle, either the 3′-A or 3′-G allele-specific primer initiates the polymerase reaction, leading to the synthesis of a fragment with either tail 1 or tail 2 at the 5′ end (or both products for heterozygous DNA samples). Cycle 2 leads to the synthesis of the complement of tail 1 or tail 2. Starting from cycle 3, the fluorescein-labeled ET primer primes synthesis on the A/tail 1 fragment, whereas the sulforhodamine-labeled ET primer primes synthesis from the G/tail 2 product. Finally, starting from cycle 4, the complementary strands are synthesized using the products of the previous reaction as template. This leads to the opening of the hairpin structure of the ET-labeled primers as they become a part of the double-stranded PCR product, which in turn gives the desired increase in green or red fluorescence.
Assay scheme. The reaction steps for an A/G SNP are shown. (FL) Fluorescein, (SR) Sulforhodamine.
Validation of the Assay
The new method was tested on nine different SNPs under optimal assay conditions (see below and Methods). These SNPs were selected because they have minor allele frequencies greater than 7% (average 32%), they create restriction sites that can be analyzed in parallel by a conventional PCR-RFLP assay, and they represent five out of the six possible types of single nucleotide substitutions, namely, A/G, A/T, C/G, C/T, and G/T. We have also used the method for an A/C substitution in an unpublished SNP in the CHRNB2 gene (results not shown). We blindly analyzed 21 genomic DNA samples for each SNP using both the new and conventional methods.
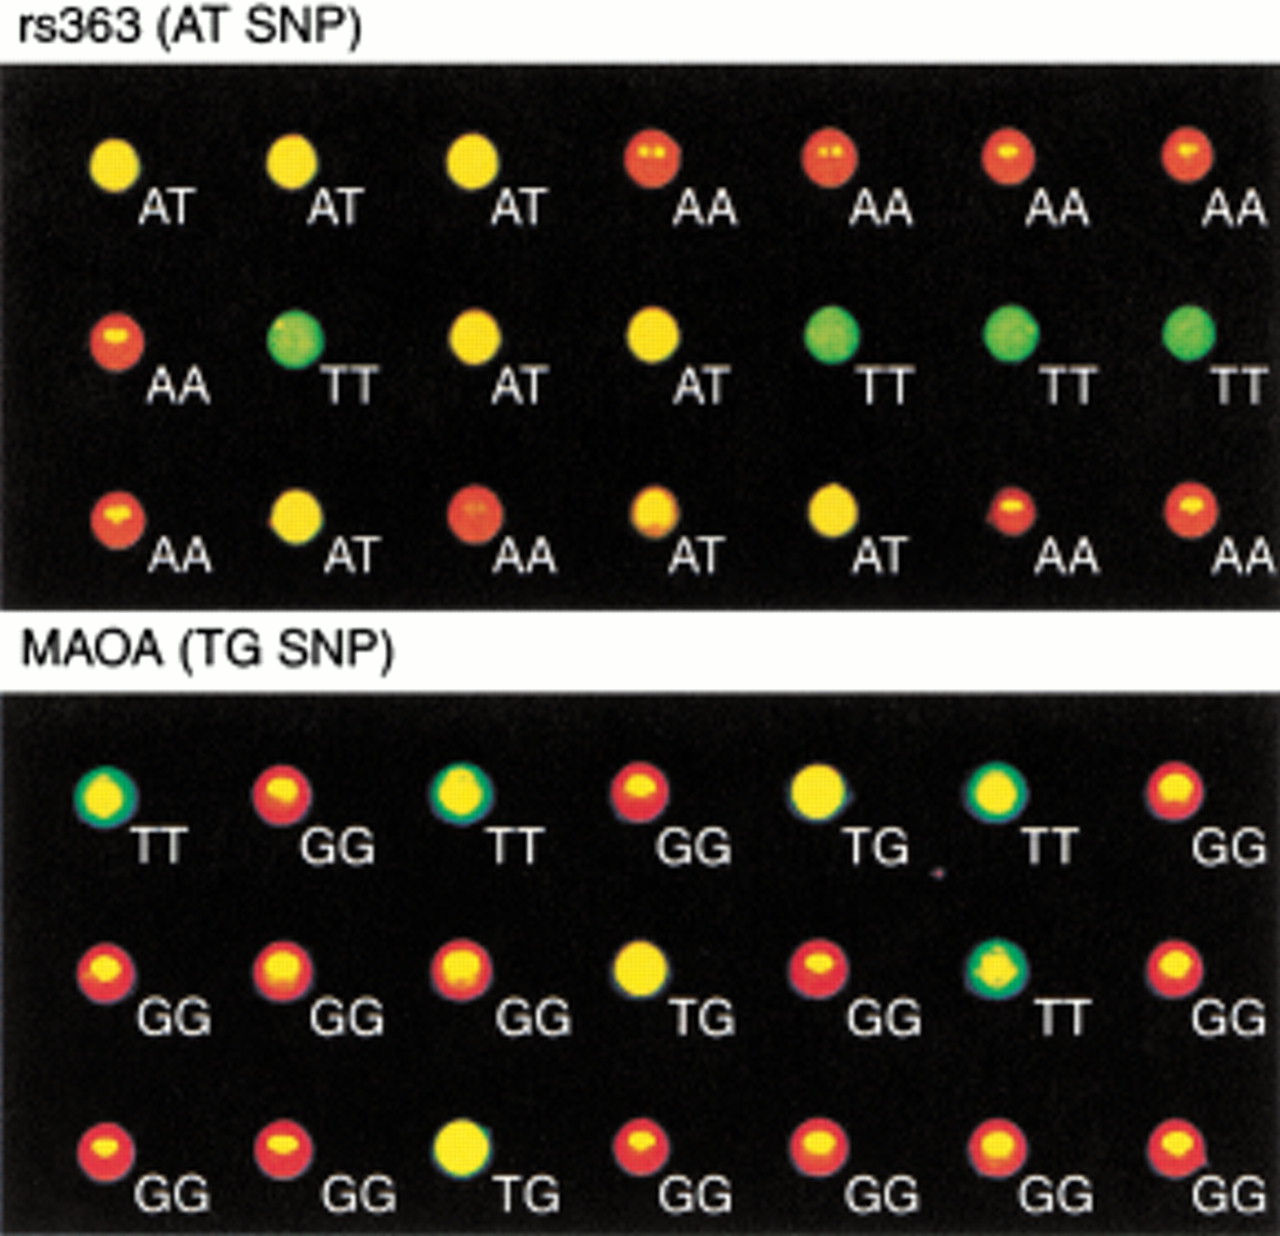
Typical data for two of the SNPs as determined by color photography of the PCR reaction plates using a Hitachi FMBIO II fluorescence imager are shown in Figure 3. Visual inspection reveals an obvious distinction between the two homozygous genotypes (red and green) and the heterozygous genotype (yellow). The results were clear-cut for both an A/T polymorphism (rs363, upper panel) and a T/G polymorphism (MAOA, lower panel).
Fluorescence images of two SNP assays. A total of 21 samples of genomic DNA were analyzed for an A/T-SNP (rs363) and a T/G-SNP (MAOA). The multiwell PCR plate was photographed with an FMBIO II imager (Hitachi) equipped with red and green filters.
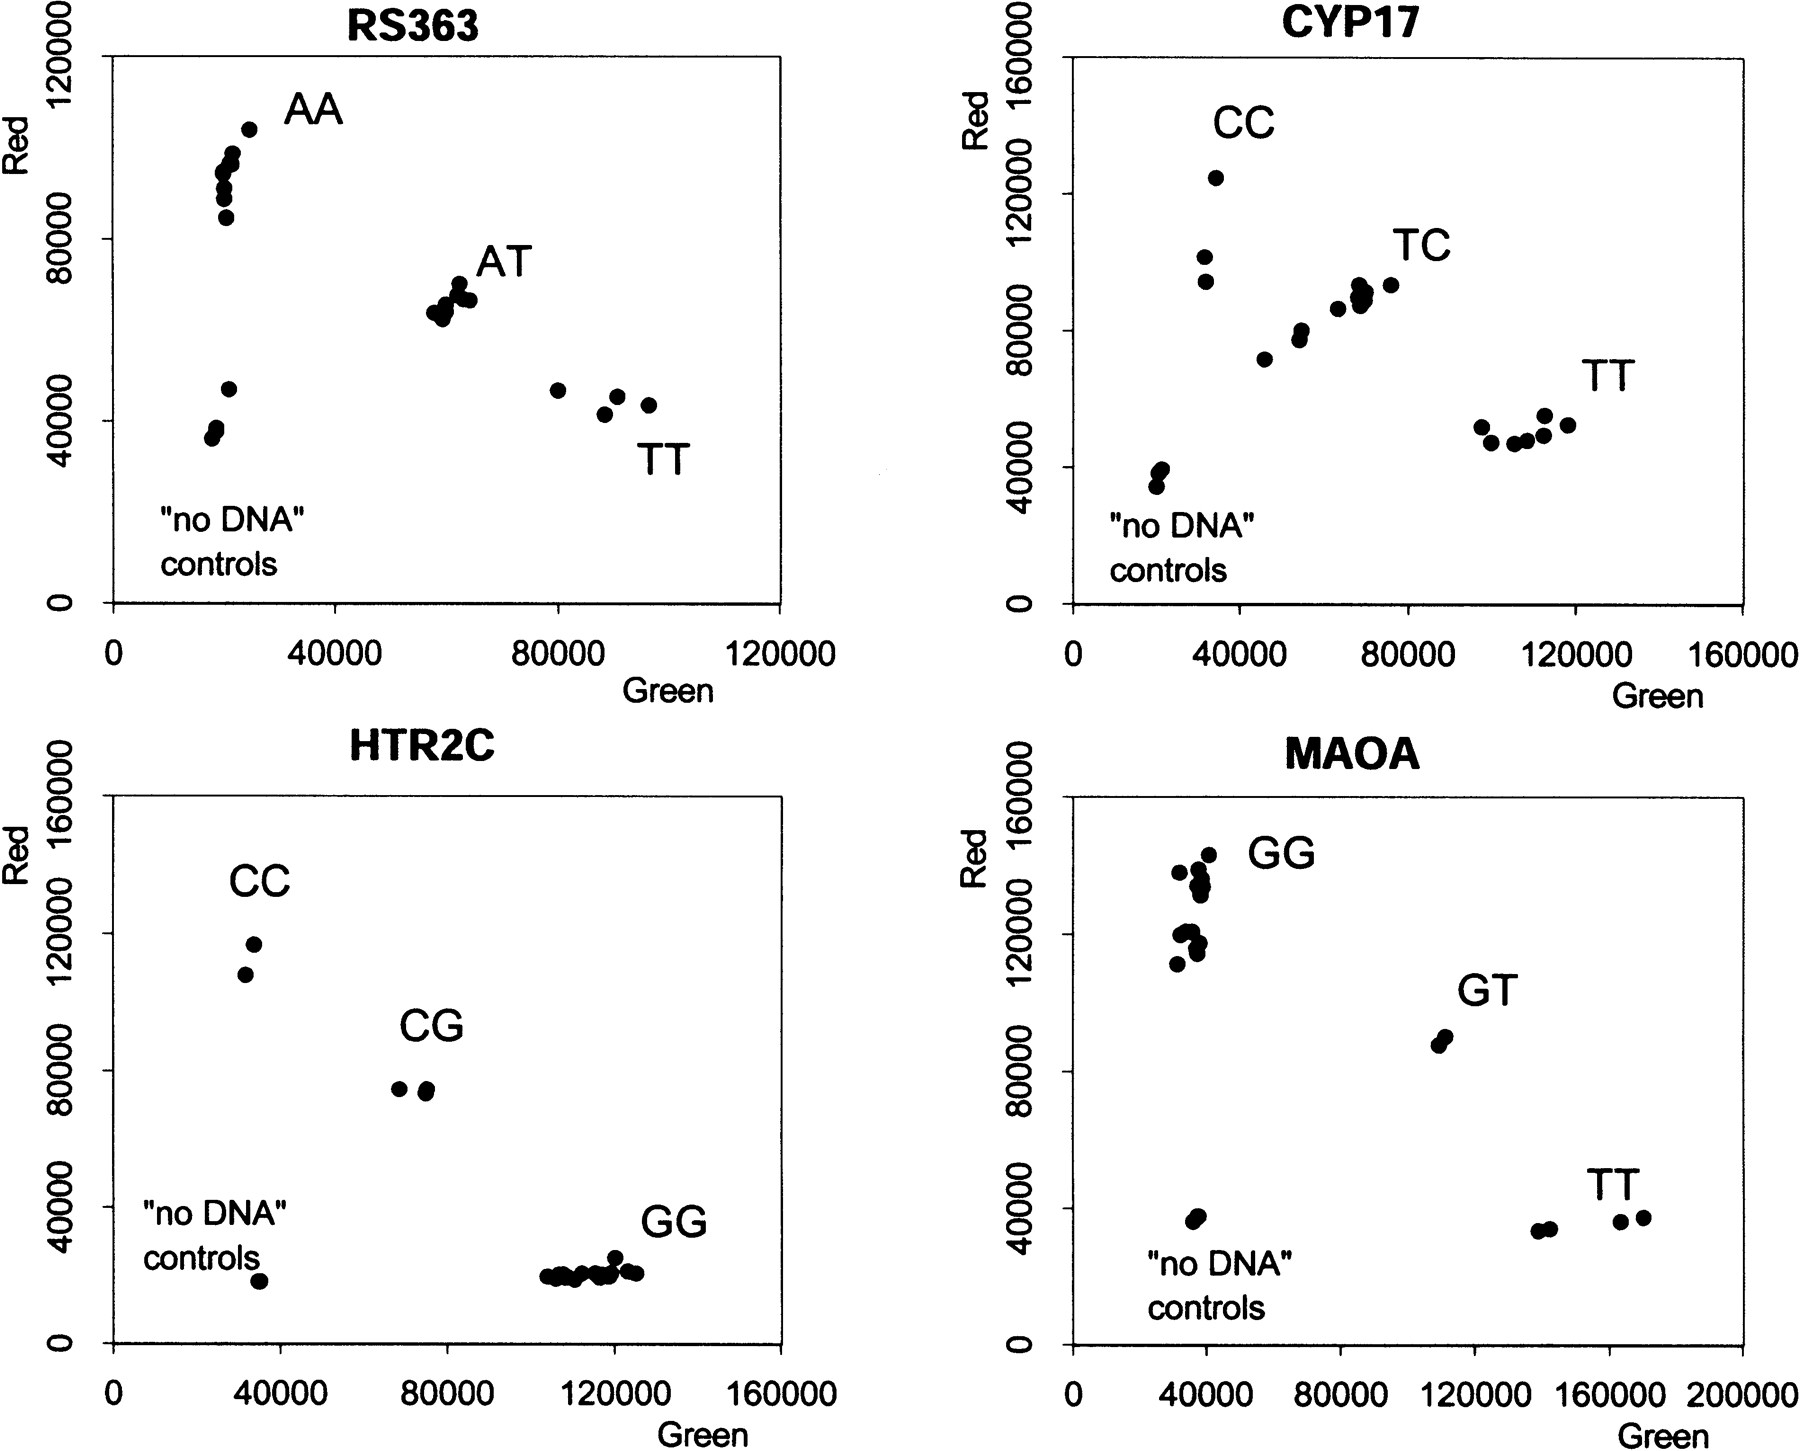
This distinction was confirmed for the other types of SNPs by quantitative analysis using the Victor II fluorescence plate reader (Fig. 4). In each case there is a complete quantitative separation between samples with no DNA (background fluorescence), one homozygote (enhanced red fluorescence with background green fluorescence), the other homozygote (enhanced green fluorescence with background red fluorescence), and the heterozygote (enhanced green and red fluorescence). The slight sample-to-sample variation represents differences in DNA quality.
Fluorescence intensity measurements for four SNP assays. The 21 samples of genomic DNA (40 ng per reaction) were analyzed for an A/T SNP (RS363), a C/T SNP (CYP17), a C/G SNP (HTR2C), and a G/T SNP (MAOA). Each plate also contained three controls without DNA. The red and green fluorescence intensity was determined in a Victor II plate reader (Wallac).
The results for the nine different SNPs that were tested are summarized in Table 2 (the complete genotype data can be accessed at http://virtual.nci.nih.gov/lb/up/000710.xls). In each case, there was complete correspondence between the genotypes obtained by the new fluorescence assay and the conventional PCR-RFLP assay. Some of the SNPs amplified more readily than others, but this could be rectified simply by increasing the PCR by two to three cycles.
Results of the Allele-Specific PCR Method for Nine SNPs
| SNP | Sample | Count | % rare allele |
| CCK | AA | 0 | |
| AG | 3 | 7% | |
| GG | 18 | ||
| CYP17 | CC | 3 | |
| CT | 11 | 40% | |
| TT | 7 | ||
| DRD1 | AA | 6 | |
| AG | 13 | 40% | |
| GG | 2 | ||
| DRD2 | CC | 5 | |
| CT | 13 | 45% | |
| TT | 3 | ||
| HTR1B | CC | 1 | |
| CG | 12 | 33% | |
| GG | 8 | ||
| HTR2A | CC | 9 | |
| CT | 9 | 36% | |
| TT | 3 | ||
| HTR2C | CC | 2 | |
| CG | 3 | 17% | |
| GG | 16 | ||
| MAOA | TT | 4 | |
| TG | 3 | 26% | |
| GG | 14 | ||
| RS363 | TT | 4 | |
| AT | 8 | 40% | |
| AA | 9 |
Optimization of Assay Conditions and Sensitivity
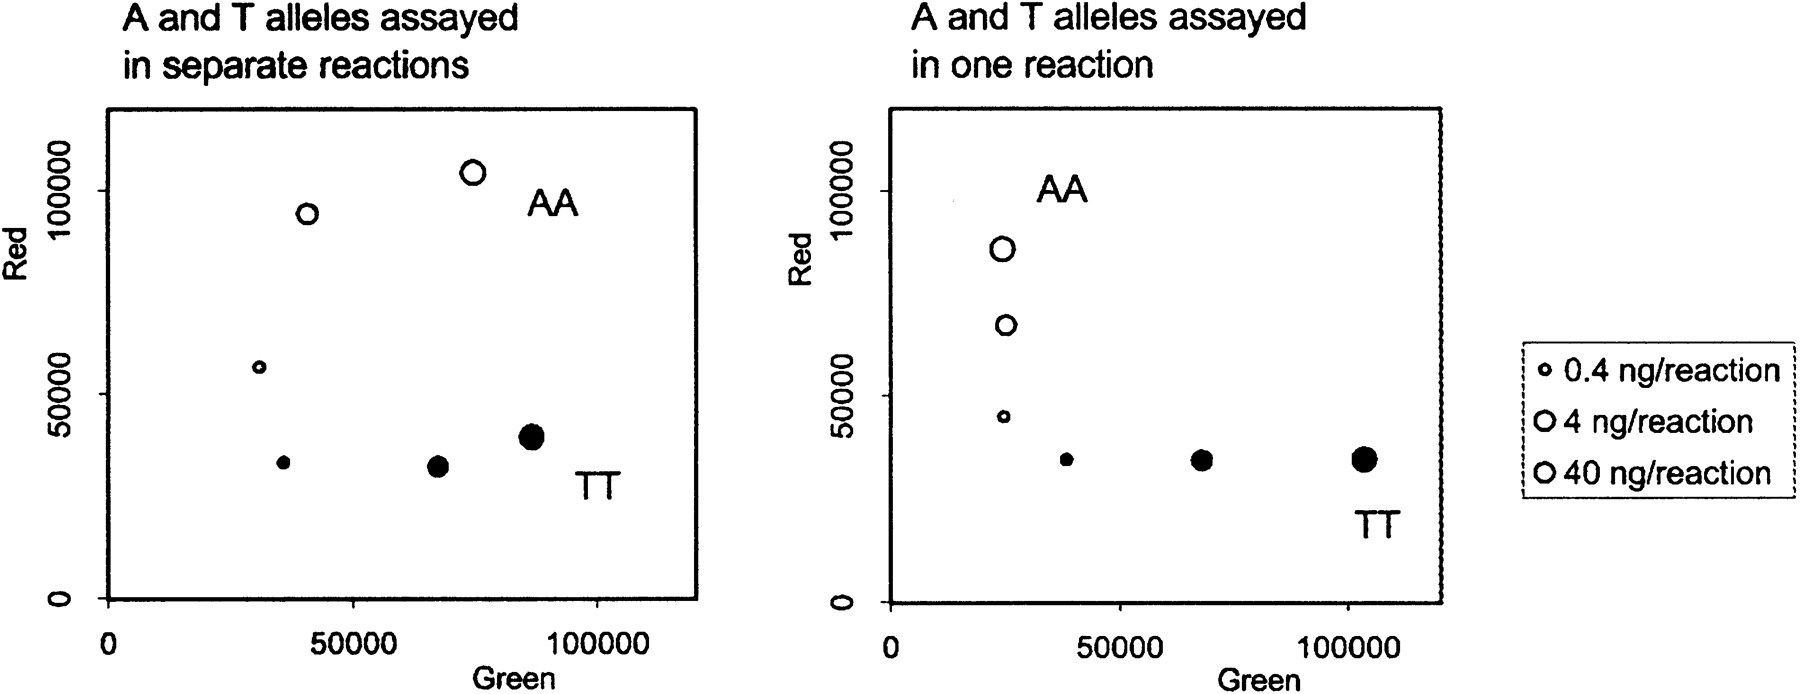
A variety of experiments were performed to establish optimal assay conditions and to determine the range of acceptable variations to the standard protocol. One important finding was that it is both more economical and more accurate to perform both allele-specific amplifications in a single tube rather than in separate tubes. Figure5 shows an experiment in which DNA from an A/A homozygote and from a T/T homozygote for an A/T SNP were assayed either by testing each DNA in two separate tubes—one containing the allele-specific and ET primer for A and the other containing the allele-specific and ET primer for T (left panel)—or in a single tube with both sets of primers (right panel). When the A/A homozygote was assayed in separate tubes, the two higher concentrations of DNA tested gave significant levels of nonspecific green fluorescence with the T-specific primers as well as specific red fluorescence with the A-specific primers. Similarly, the highest concentration of T/T DNA tested gave some nonspecific red as well as specific green fluorescence (Fig. 5, left panel). Therefore, these samples might have been erroneously called heterozygotes. By contrast, when the DNAs were simultaneously tested with both A- and T-specific sets of primers in the same tube, no nonspecific fluorescence enhancement was observed (Fig. 5, right panel). Presumably this is because competition between the two allele-specific primers, which are present in limiting quantities (see below), reduces the nonspecific priming by the mismatched primer that occurs at high DNA concentrations.
Combination of two allele-specific reactions in a single tube increases specificity. Two genomic DNA samples with known homozygous genotypes (AA and TT) were analyzed at different dilutions for an A/T SNP (rs363). (Left) Each DNA sample was assayed twice: First, in a tube containing the allele-specific and ET-labeled primer for A, then in a tube containing an allele-specific and ET-primer for T. (Right) Each DNA sample was assayed in a single tube containing both A and T sets of primers. The red and green fluorescence intensity was determined in a Victor II plate reader (Wallac).
Several different concentrations and ratios of the different types of primers were tested to establish the conditions that gave both the greatest specificity and signal-to-noise ratio. These experiments established that it was optimal to perform the reactions with a 10:1 ratio of ET-labeled to tailed allele-specific primers to maximize fluorescence yield (Nazarenko et al. 1997). The concentration of the reverse primer was equal to that of each of the ET-labeled primers (not their sum), which ensured that the yield of each fluorescent signal for heterozygote DNA samples was about half of the maximum value reached for homozygote DNAs. Finally, the variation in the efficiency of PCR for different SNPs was most readily equalized by adding two or three cycles to the PCR amplification rather than by changing primer concentrations or other reaction conditions.
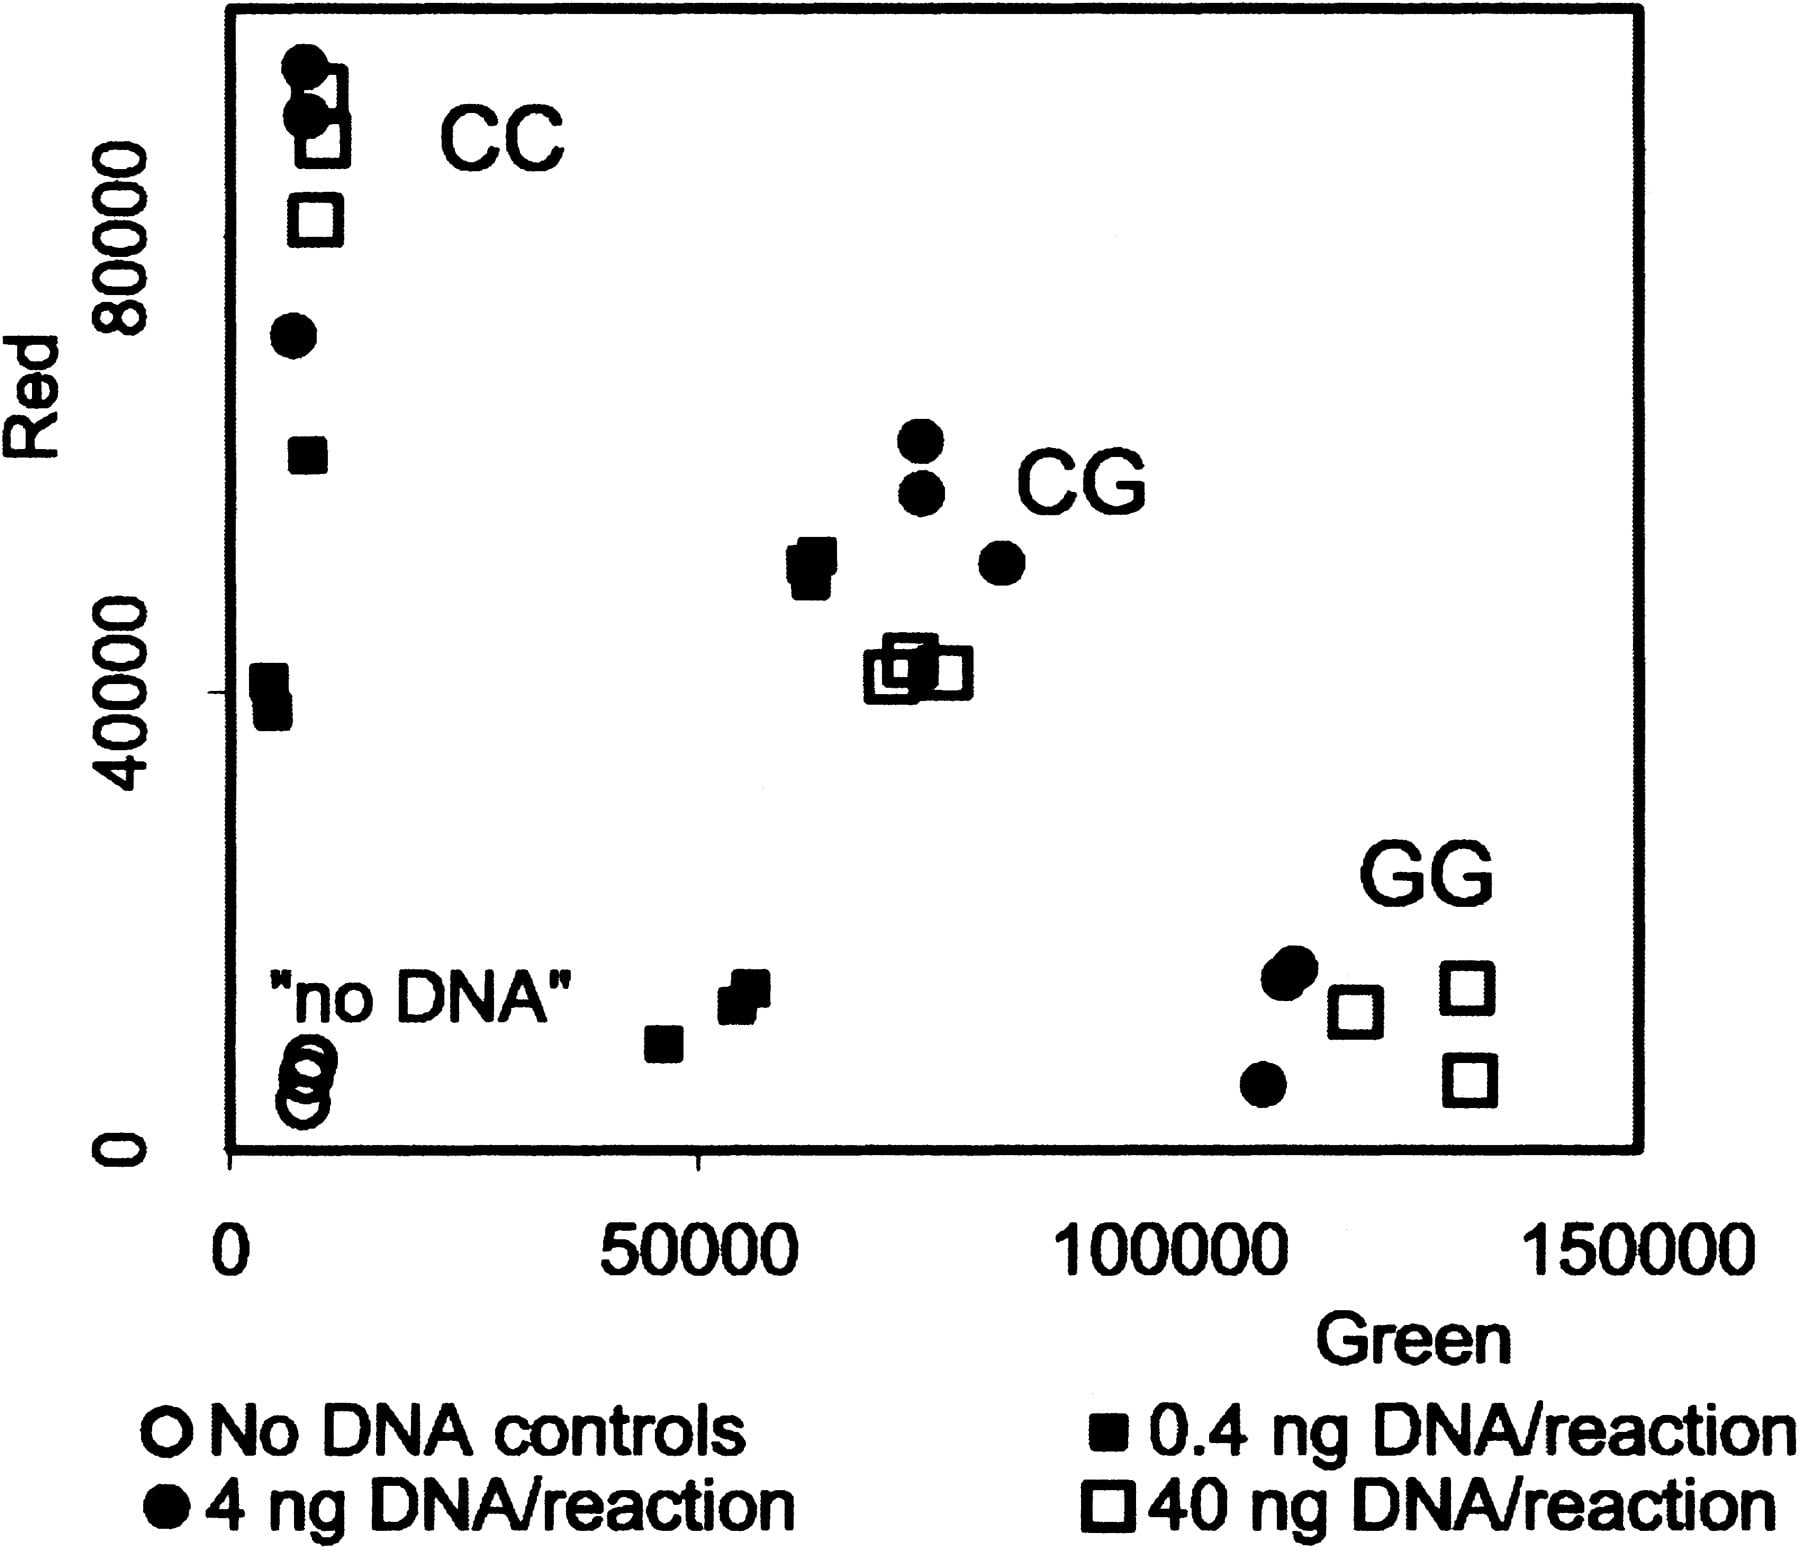
The sensitivity of the method was tested by analyzing three concentrations of three different genomic DNA samples for a G/C SNP. Figure 6 shows that as little as 0.4 ng of DNA gave signals that were clearly above the control reactions without DNA. For routine genotyping, 40 ng of DNA per reaction was found to be optimal.
Genomic DNA dilution experiment. Three DNA samples of known genotypes (CC, GC, and GG) were assayed for a G/C SNP (HTR2C) at various concentrations (40-, 4-, 0.4-, and 0-ng/reaction). The red and green fluorescence intensity was determined in a Victor II plate reader (Wallac).
DISCUSSION
We report a new method of SNP genotyping based on allele-specific PCR amplification combined with the use of universal energy-transfer-labeled Amplifluor primers. Our method has several useful features.
First, it is highly accurate. Blinded analysis of nine different SNPs gave complete concordance between genotypes assayed by the new method and conventional PCR-RFLP (Table 2), and as long as both allele-specific primers were used in a single tube, there was little if any nonspecific signal (Figs. 4 F5 F6). Similar specificity using primers with single 3′ allele-specific nucleotides has been reported byOkayama et al. (1989) and Howard et al. (1999), but others have had to introduce additional mismatches into the primers (Newton et al. 1989,1991; Picard 1993; Lubin et al. 1999; Matsubara et al. 1999; Tremmel et al. 1999). Our ability to obtain specific amplification appears to be caused by competition between the allele-specific reactions and the use of a low concentration of the allele-specific primers accompanied by an excess of ET-labeled primer; the latter somewhat reduces PCR efficiency but makes the annealing more selective.
A second feature of the method is its sensitivity. The limit of sensitivity of the method is 0.4 ng of genomic DNA per reaction (Fig.6), which corresponds to 150 copies of the target gene, whereas the optimal DNA amount is 40 ng per reaction. This is comparable with the sensitivity of most end-point methods and makes the approach feasible for multiple-marker scans in which the amount of genomic DNA available becomes a limiting factor.
A third feature of the method is that it requires just two universal ET primers rather than a new set of ET primers for each SNP. This is important because the ET primers are the most expensive reagents used in the method.
A final advantage of the method is the small number of operations that are involved. DNA and reagents are mixed in multiwell PCR plates, the amplification reactions are run in multiple standard thermocyclers, the plates are transferred and read in a fluorescence plate reader, and the data are converted into genotypes by a computer program. The whole process takes less than 3 hours for 96 samples with hands-on time of less than 30 minutes, and multiple plates can be processed in parallel and fed into one reader. The procedure would be well suited for automation by using liquid handling robotics and transfer devices. Throughput could also be increased by using a 384-well format, which is compatible with most currently available fluorescence plate readers.
There are two limitations to the method. First, because the 3′ end of the allele-specific primer is fixed, it is not always possible to choose optimal PCR primers for genomic DNA amplification. For the nine model SNPs described here, we were able to design primers that gave reasonable PCR efficiency, but this may not always be the case. For example, there were two SNPs that didn't amplify under our standard conditions (data not shown). It may be possible to overcome this limitation by designing primers to amplify the fragment in the opposite direction along the chromosome. A second constraint, common to all SNP genotyping methods, is the quality of the genomic DNA samples. In our experiments, 0.4 ng of pure DNA gave a detectable signal (Fig. 6), but some cruder DNA preparations did not work as well (data not shown).
In summary, we have developed a new method for SNP genotyping that is accurate, sensitive, reasonably priced, and requires minimal operator time. It should be useful for a number of applications that require high throughput such as multiple-candidate gene screens, genomewide linkage and association scans, and medical diagnostics.
METHODS
Amplification reactions were performed in 96-well polypropylene PCR plates (Sorenson BioSciences). The 20-μL reactions contained 1.8 mM MgCl2, 50 mM KCl, 10 mM Tris-HCl at pH 8.3, 0.2 mM dNTPs, 25 nM each of two tailed allele-specific primers, 250 nM reverse primer, 250 nM each of the green and red universal ET-labeled Amplifluor primers (Intergen), 40 ng of genomic DNA, and 1 unit of Taq Polymerase (Takara Shuzo, Japan; Platinum Taq Polymerase from BRL can also be used and may be beneficial if nonspecific PCR products or primer dimers are observed). The plates were covered with a Cycleseal sealer (Robbins Scientific) and placed into a Perkin-Elmer 9700 or MJ Research PTC-100 thermocycler block preheated to 94°C. After 5 min at 94°C, amplification was carried out for 35 cycles of 10 sec at 94°C, 20 sec at 55°C, 40 sec at 72°C, followed by incubation at 72°C for 3 min.
Fluorescence intensity measurements were routinely performed on a Victor II fluorescence plate reader (Wallac) as previously described (Nazarenko et al. 1997), using additional emission and excitation filters for the sulforhodamine channel. The data were exported into Excel format and analyzed using an MS Excel-based template (available from http://virtual.nci.nih.gov/lb/up). Plates could also be read with the Analyst AD fluorescence plate reader (LJL BioSystems). The continuous lamp was used with 50% splitter. Red fluorescence was measured from the top of the plate for 0.1 sec per sample with a 580-nm excitation and 620-nm emission filter; green fluorescence was similarly measured with a 485-nm excitation and 530-nm emission filter. The data were analyzed using MS Excel as above.
To obtain color photographs, the PCR reaction plates were placed on an UV transilluminator and observed through the FMBIO II imager (Hitachi) equipped with red and green filters provided by the manufacturer. Alternatively, The Imager (Appligene, France) was used with a 520–560-nm filter for green fluorescence and a 590–640-nm filter for red fluorescence.
The primers and restriction enzymes used for PCR-RFLP genotyping were as follows: CCK: 5′-AATACATGACTGGCC GACGCCACCG, 5′-CCGCTGACGAACCGAGGGACCTACC, PflMI; CYP17: 5′-CAAGGTGAAGATCAGGGTA, 5′-CAAATA AGCTAGGGTAAGCAG,MspA1I; DRD1: 5′-GGATTGCCACT CAAGCGGTCCTCTCAT, 5′-TCCCTCTCCACCACCAGC CCAGTC, DdeI; DRD2: 5′-GAGCTGGAGATGGAGATGCT, 5′-CAATCTTGGGGTGGTCTTTG,NcoI; HTR1B: 5′-TCCC GGATTTTGAAACAGAC, 5′-TAGCGGCCATGAGTTTCTTC, HincII; HTR2A: 5′-CTGCAGCTTTTTCTCTAGGG, 5′-CCG TCTGCTACAAGTTCTGGCTT,MspI; HTR2C; 5′-GGCC TATTGGTTTGGCAAT, 5′-CCAGTTTTGTACCCCGTCTG, BsrDI; MAOA: 5′-ATCCCTCCGACCTTGACTG, 5′-GCC TACCCTTCTTCTTCCAGA,MspA1I; rs363: 5′-GCTCTCA AATCAGATAGTTC, 5′-ACTCCAAGCAATAAATCTCC, RsaI.
We thank Kira Lueders, Bruce Paterson, Barry Trachtenberg, and Leo Sirota for their invaluable help. We thank Doug Boyd of LJL BioSystems, Inc. for providing us with the demonstration unit of the Analyst fluorescent plate reader and Brett Light of Hitachi for providing the FMBIO II Imager. We thank Alan Doty of Wallac for technical advice and support.
The publication costs of this article were defrayed in part by payment of page charges. This article must therefore be hereby marked “advertisement” in accordance with 18 USC section 1734 solely to indicate this fact.
Notes
[3] Corresponding author.
Notes
[4] E-MAIL [email protected]; FAX (301) 402-3095.
[5] Article and publication are atwww.genome.org/cgi/doi/10.1101/gr.157901.
REFERENCES
- ↵H. BaronS. FungA. AydinS. BahringF.C. LuftH. Schuster(1996) Oligonucleotide ligation assay (OLA) for the diagnosis of familial hypercholesterolemia. Nat. Biotechnol. 14:1279–1282.
- ↵B. BlomekeS. SiebenD. SpotterO. LandtH.F. Merk(1999) Identification of N-acetyltransferase 2 genotypes by continuous monitoring of fluorogenic hybridization probes. Anal. Biochem. 275:93–97.
- ↵X. ChenP.Y. Kwok(1997) Template-directed dye-terminator incorporation (TDI) assay: A homogeneous DNA diagnostic method based on fluorescence resonance energy transfer. Nucleic Acids Res. 25:347–353.
- ↵X. ChenB. ZehnbauerA. GnirkeP.Y. Kwok(1997) Fluorescence energy transfer detection as a homogeneous DNA diagnostic method. Proc. Natl. Acad. Sci. 94:10756–10761.
- ↵X. ChenK.J. LivakP.Y. Kwok(1998) A homogeneous, ligase-mediated DNA diagnostic test. Genome Res. 8:549–556.
- ↵X. ChenL. LevineP.Y. Kwok(1999) Fluorescence polarization in homogeneous nucleic acid analysis. Genome Res. 9:492–498.
- ↵S. GermerR. Higuchi(1999) Single-tube genotyping without oligonucleotide probes. Genome Res. 9:72–78.
- ↵Z. GuL. HillierP.Y. Kwok(1998) Single nucleotide polymorphism hunting in cyberspace. Hum. Mutat. 12:221–225.
- ↵B. HoogendoornM.J. OwenP.J. OefnerN. WilliamsJ. AustinM.C. O'Donovan(1999) Genotyping single nucleotide polymorphisms by primer extension and high performance liquid chromatography. Hum. Genet. 104:89–93.
- ↵T.D. HowardE.R. BleeckerO.C. Stine(1999) Fluorescent allele-specific PCR (FAS-PCR) improves the reliability of single nucleotide polymorphism screening. Biotechniques 26:380–381.
- ↵L.G. KostrikisS. TyagiM.M. MhlangaD.D. HoF.R. Kramer(1998) Spectral genotyping of human alleles. Science 279:1228–1229.
- ↵L. Kruglyak(1997) The use of a genetic map of biallelic markers in linkage studies. Nat. Genet. 17:21–24.
- ↵R.W. KwiatkowskiV. LyamichevM. de ArrudaB. Neri(1999) Clinical, genetic, and pharmacogenetic applications of the Invader assay. Review. Mol. Diagn. 4:353–364.
- ↵L.G. LeeC.R. ConnellW. Bloch(1993) Allelic discrimination by nick-translation PCR with fluorogenic probes. Nucleic Acids Res. 21:3761–3766.
- ↵I.M. LubinN.A. YamadaR.M. StanselR.G. PaceE.M. RohlfsL.M. Silverman(1999) HFE genotyping using multiplex allele-specific polymerase chain reaction and capillary electrophoresis. Arch. Pathol. Lab Med. 123:1177–1181.
- ↵V. LyamichevA.L. MastJ.G. HallJ.R. PrudentM.W. KaiserT. TakovaR.W. KwiatkowskiT.J. SanderM. de ArrudaD.A. Arco(1999) Polymorphism identification and quantitative detection of genomic DNA by invasive cleavage of oligonucleotide probes. Nat. Biotechnol. 17:292–296.
- ↵K. Mangasser-StephanC. TagA. ReiserA.M. Gressner(1999) Rapid genotyping of hemochromatosis gene mutations on the LightCycler with fluorescent hybridization probes. Clin. Chem. 45:1875–1878.
- ↵S.A. MarrasF.R. KramerS. Tyagi(1999) Multiplex detection of single-nucleotide variations using molecular beacons. Genet. Anal. 14:151–156.
- ↵Y. MatsubaraK. FujiiP. RinaldoK. Narisawa(1999) A fluorogenic allele-specific amplification method for DNA-based screening for inherited metabolic disorders. Acta Paediatr. Suppl. 88:65–68.
- ↵J.J. McCarthyR. Hilfiker(2000) The use of single-nucleotide polymorphism maps in pharmacogenomics. Nat. Biotechnol. 18:505–508.
- ↵C.A. MeinB.J. BarrattM.G. DunnT. SiegmundA.N. SmithL. EspositoS. NutlandH.E. StevensA.J. WilsonM.S. Phillips(2000) Evaluation of single nucleotide polymorphism typing with Invader on PCR amplicons and its automation. Genome Res. 10:330–343.
- ↵M. NauckH. WielandW. Marz(1999) Rapid, homogeneous genotyping of the 4G/5G polymorphism in the promoter region of the PAII gene by fluorescence resonance energy transfer and probe melting curves. Clin. Chem. 45:1141–1147.
- ↵I.A. NazarenkoS.K. BhatnagarR.J. Hohman(1997) A closed tube format for amplification and detection of DNA based on energy transfer. Nucleic Acids Res. 25:2516–2521.
- ↵D.W. Nebert(1999) Pharmacogenetics and pharmacogenomics: Why is this relevant to the clinical geneticist? Clin. Genet. 56:247–258.
- ↵C.R. NewtonA. GrahamL.E. HeptinstallS.J. PowellC. SummersN. KalshekerJ.C. SmithA.F. Markham(1989) Analysis of any point mutation in DNA. The amplification refractory mutation system (ARMS). Nucleic Acids Res. 17:2503–2516.
- ↵C.R. NewtonC. SummersL.E. HeptinstallJ.R. LynchR.S. FinniearD. OgilvieJ.C. SmithA.F. Markham(1991) Genetic analysis in cystic fibrosis using the amplification refractory mutation system (ARMS): The J3.11 MspI polymorphism. J. Med. Genet. 28:248–251.
- ↵G.J. NuovoR.J. HohmanG.A. NardoneI.A. Nazarenko(1999) In situ amplification using universal energy transfer-labeled primers. J. Histochem. Cytochem. 47:273–280.
- ↵H. OkayamaD.T. CurielM.L. BrantlyM.D. HolmesR.G. Crystal(1989) Rapid, nonradioactive detection of mutations in the human genome by allele-specific amplification. J. Lab Clin. Med. 114:105–113.
- ↵T. PastinenJ. PartanenA.C. Syvanen(1996) Multiplex, fluorescent, solid-phase minisequencing for efficient screening of DNA sequence variation. Clin. Chem. 42:1391–1397.
- ↵J.K. Picard(1993) Single-step allele-specific polymerase chain reaction HLA-DQ genotyping using ARMS primers. Hum. Immunol. 38:115–122.
- ↵A.C. SyvanenK. Aalto-SetalaL. HarjuK. KontulaH. Soderlund(1990) A primer-guided nucleotide incorporation assay in the genotyping of apolipoprotein E. Genomics 8:684–692.
- ↵M. TremmelG. OpelzJ. Mytilineos(1999) High-resolution typing for HLA-DRB1*15 and -DRB1*16 by fluorescence-marked sequence-specific priming (TaqMan assay). Tissue Antigens 54:508–516.
- ↵S. TyagiD.P. BratuF.R. Kramer(1998) Multicolor molecular beacons for allele discrimination. Nat. Biotechnol. 16:49–53.
- ↵D. WhitcombeJ. BrownieH.L. GillardD. McKechnieJ. TheakerC.R. NewtonS. Little(1998) A homogeneous fluorescence assay for PCR amplicons: Its application to real-time, single-tube genotyping. Clin. Chem. 44:918–923.