

Computational analysis of polymerase II (Pol II) promoters may contribute to improved gene identification and to prediction of the expression context of genes. Before assessing the state of computational promoter recognition per se in the main body of this review, we will provide a context by giving a brief overview of these two problems.
Partitioning a Genome into Genes
Only recently has it become common to determine eukaryotic genomic sequences large enough to contain several genes. With these data comes a new problem for gene finding programs: to partition a set of exons correctly among several genes.
One line of development in eukaryotic gene identification begins with coding region identification by statistical means and adds pattern recognition for sites of transcriptional, splicing, and translational control to produce algorithms capable of suggesting overall gene structure (for review, see Gelfand 1995; Fickett 1996a). To date, most development effort has focused on integration of the various kinds of pattern information in the relatively simple case where a single complete gene is present in the input sequence. In this case, current algorithms usually suggest a putative protein translation similar to that in the literature, though there is still significant room for improvement (Burset and Guigo 1996). The extension of these algorithms to deal with a sequence containing multiple or partial genes is just beginning (Burge and Karlin 1997;http://gnomic.stanford.edu/~chris/GENSCANW.html). Because the signals that control the start and stop of transcription and translation, and the location of splicing, are still not very well understood, it is not uncommon for a gene-finding algorithm to confuse internal with initial and terminal exons, thus wrongly partitioning the exons. The problem is compounded by our incomplete understanding of alternative splicing control elements.
Another line of development in gene identification is based on homology (e.g., Gish and States 1993; Gelfand et al. 1996). If there is a close homolog in the databases to one of the genes in the sequence under analysis, sequence similarity will usually group the exons for this gene correctly. Still, in many cases there is no close homolog and no guarantee when there is some homolog that the encoded protein lacks insertions/deletions.
Clearly, some means of recognizing the beginnings of genes, probably via the promoter, or the ends, probably by means of the polyadenylation signal or translation termination signal (e.g., Kondrakhin et al. 1994;Wahle and Keller 1996; Dalphin et al. 1997; Solovyev and Salamov 1997), would enable a major advance. The promoter seems to be a much richer signal than the 3′ processing signals, though, as we shall see below, it is not easy to take advantage of the information in the promoter.
Determining the Correct Protein Translation
Of course, the single most important goal in gene identification is to correctly deduce the protein product(s) of the gene. After partitioning the genome into genes, the greatest difficulty in eukaryotes is correctly determining the splicing structure. Locating the correct initiation codon is also a difficult and important step in this case. If the transcription start site (TSS) is known, and there is no intron interrupting the 5′-untranslated region, Kozak’s (1996) rules can probably locate the correct initiation codon in most cases.
In prokaryotes the problem is of a different nature. Because splicing is normally absent, dividing the genome into gene units is ordinarily straightforward. This does not make the correct deduction of protein product trivial, however, for finding the correct initiation codon within an open reading frame (ORF) is difficult. In this case, promoter location, though useful, does not provide the key information that it does for eukaryotes because of the existence of multicistronic operons. Rather, for prokaryotes, the key need is reliable localization of the ribosome binding site (Shine and Dalgarno 1974).
Determination of Expression Context
Many experimental techniques are being developed for cataloging the expression context of genes (e.g., Prashar and Weismann 1996 and references therein). Development of computer algorithms to predict expression context from genomic sequence has received much less attention but may represent an important opportunity.
Gene expression is regulated at many levels, including chromatin packing (for review, see Kingston et al. 1996), transcription initiation (see below), polyadenylation (for review, see Wahle and Keller 1996), splicing (for review, see McKeown 1992), mRNA stability (e.g., Decker and Parker 1994), translation initiation (for review, seeKozak 1992), and others. But it is generally thought that the single most important point of regulation is at transcription initiation. The initiation of transcription seems to be regulated in large part by coordinate binding of many proteins to the promoter and, for some genes, to one or more enhancers. Specific combinations of binding sites, then, may provide the information necessary to suggest a particular expression context, and it is here that computational work to date has focused.
In most cases, researchers in this area have taken the locations of transcriptional regulatory regions (promoters and enhancers) as given and, in attempting to define those patterns in the DNA (combinations of binding sites) that determine expression context, have only attempted to give patterns with sufficient information content to sort regulatory regions into those that are active in a particular context and those that are not (e.g., Claverie and Sauvaget 1985; Fondrat and Kalogeropoulos 1994; Pedersen et al. 1996; Rosenblueth et al. 1996). For this approach to be successful in the long run, reliable algorithms must be developed for the recognition of promoters and enhancers in general. Another approach to the problem is to attempt to define patterns with very high information content, capable of distinguishing regulatory regions active in a specific context from all the other DNA in the genome (e.g., Fickett 1996b; Tronche et al. 1997). With this approach, one can imagine that general promoter recognition would eventually consist of separately recognizing a large number of specific cases. It is too early to clearly define the benefits of either strategy, and in any case, techniques developed with one approach will almost certainly transfer in part to the other.
Eukaryotic Promoter Recognition
In the rest of the paper we concentrate on the key problem of general eukaryotic promoter recognition. First, we review a few salient points from recent advances in biochemical understanding of transcription initiation, next, the core computational resources and techniques are discussed, and then currently available tools are described. To give some feeling for the current state of the art, the application of these tools to some recently determined promoter sequences is also described. Finally, we discuss prospects for the future.
Eukaryotic Transcription Initiation
The biochemical mechanisms controlling transcription initiation in eukaryotes are currently under intense investigation. Recent advances are reviewed in, for example, Burley and Roeder (1996); Chao and Young (1996); Kaiser and Meisterernst (1996); Kornberg (1996); Novina and Roy (1996); Roeder (1996); Stargell and Struhl (1996); Verrijzer and Tjian (1996); Ptashne and Gann (1997); Smale (1997). Here we will attempt to summarize the conclusions most relevant to sequence analysis.
The so-called preinitiation complex (PIC) recognizes the core promoter and initiates transcription. The PIC includes, besides Pol II, the general initiation factors (or general transcription factors, GTFs) TFIIA, TFIIB, TFIID, TFIIE, TFIIF, and TFIIH. Each of these may itself be a multiprotein complex. TFIID, which consists of TATA-binding protein [TBP; the so-called TATA box is ∼25 bp upstream of the transcription start site (TSS) in metazoans] and several TBP-associated factors (TAFs), is the only one of these known to have site-specific DNA-binding ability (though several other GTFs are known to be in close contact with the DNA; cf. Coulombe et al. 1994). TBP is one of the major determinants of this DNA-binding specificity, and the consensus sequence or position weight matrix (PWM) often used to recognize the TATA box (Bucher 1990) is probably characterizing the DNA-binding specificity of TBP (see Singer et al. 1990; Wiley et al. 1992).
Around the TSS there is a loosely conserved initiator region (abbreviated Inr; for review, see Kaufmann et al. 1996; Smale 1997) that is one determinant of promoter strength and, in the absence of a TATA box, can determine the location of the TSS. To some extent, the TATA box and the Inr are interchangeable. For example, TFIID containing a mutated TBP defective in DNA binding cannot function on TATA-only promoters, but supports transcription from Inr-containing promoters (Martinez et al. 1995). There is evidence that several different proteins can bind to the Inr. Some of these seem to be capable of directing the initiation of transcription even in the absence of TBP (e.g., YY1; cf. Usheva and Schenk 1994). Javahery et al. (1994) (see also Purnell et al. 1994; Kraus et al. 1996) compare the sequence requirements for Inr activity in mammals to those for DNA binding of several proteins and to the initiation site characterization derived byBucher (1990) and conclude that in most cases basic Inr activity is probably mediated by a single protein within the TFIID complex, though possibly modulated by others. On the other hand, TFIID (via TAFII150 or TAFII250), TFII-I, and Pol II all seem to have Inr-specific binding capacity and possible involvement in mediating Inr specificity of transcription initiation (for review, seeSmale 1997).
Drosophila TAFII150 contacts the DNA as far as 35 bp 3′ of the transcription start site (Verrijzer et al. 1994) and could perhaps also be involved in functionally important patterns downstream of the Inr. Ince and Scotto (1995) identified a conserved region 20–45 bp downstream of the 3′-most TSS in a set of 14 promoters lacking both a TATA box and an Inr, and having a similar pattern of multiple start sites. This site, with consensus GCTCCS, was found to bind two proteins in a sequence-specific manner and, by mutation, was found to be essential for the pattern of TSS in at least one of the genes. Larsen et al. (1995) found a conserved motif, CTNCNG, at about +8 in a large-scale alignment of mammalian promoters. Burke and Kadonaga (1996) found an RGWCGTG motif at about +30 in a number of TATA-less Drosophila promoters. Mutation analysis demonstrated function, and footprinting showed TFIID binding. At present, the generality of these patterns is unknown.
To a first approximation, it seems that gene expression is controlled by a proximal promoter, which with the PIC determines the location of transcription initiation, together with a number of specific regulatory regions (often, but not always, 5′ to the proximal promoter), that specify the tissue, developmental stage, or biochemical context of gene expression (for an overview, see Tjian 1995). Usually each such regulatory region contains binding sites for a number of specific transcription factors, sometimes called activators or repressors, that seem to act synergistically. There may be many such regions, and they may either enhance or repress expression of the gene in particular circumstances (see Yuh and Davidson 1996 for an elegant example). Often these specific regulatory regions are active even if their location of orientation is changed, in which case they are termed enhancers. Enhancers may be located up to tens of thousands of base pairs from the TSS.
Transcription factor binding sites are typically 5–15 bp long. The nucleotide specificity at different positions within the site varies. For a site n long, the information content of the binding specificity is typical much less than the maximal 2n bits. Note that if a protein is to be sufficiently discriminatory to have a binding site only once every N bases, its binding specificity must have information content at least log2 N bits (cf. Schneider et al. 1986).
Protein–protein interactions mediating synergistic action of multiple transcription factors may impose spacing constraints on the protein–DNA-binding sites. To take one example from among many, insertion of 5 bp (CCAAC) between a MyoD site and the TATA box in the desmin promoter was found to reduce myotube expression to 45% of normal, whereas insertion of 10 bp (CGGAGTGTCG) gave 85% of normal expression (Li and Capetanaki 1994).
There is also dependence between the DNA sequence at the binding site of one transcription factor and the ability of that factor to interact with another. For example, there has been evidence for over a decade that activator inducibility probably depends on the sequence of the core promoter (e.g., Struhl 1986). Emami et al. (1995) reviewed the field and tested various chimeric transcription factors with synthetic promoters containing a TATA box, an Inr, both, or neither. Among a number of interesting conclusions, they found that Sp1 contains multiple activation domains, one of which preferentially interacts with a core promoter containing an Inr. Another example of Inr/TATA differences is found in the FcγR1b gene, which contains a canonical Inr but not a TATA box. FcγR1b is normally expressed only in myeloid cells, and is γ-interferon (IFN-γ)- but not IFN-α-inducible. When a 3-bp mutation introduced a TATA box 30 bp upstream of the transcription initiation site, the altered gene responded to IFN-α as well as IFN-γ, and cell type specificity was lost (Eichbaum et al. 1994). In a few cases, detailed studies have shown that point mutations in the TATA box destroy the ability of an upstream enhancer binding transcription factor to up-regulate expression (e.g., Harbury and Struhl 1989; Diagana et al. 1997).
The mechanism by which core promoter sequence differences are translated into different receptivity to specific transcription factors remains unclear. In some cases, a conformational change may be involved. Diagana et al. (1997) showed that when base changes in the TATA box destroy muscle-specific activation of MyHC, the contacts between TBP and the TATA box also change. In some cases, the mechanism may be differing composition of the PIC. Human TAFII30 was found by Jacq et al. (1994) to be present in only some TFIID complexes and to be required for activation by the AF-2 containing region E of the human estrogen receptor. Similarly, some TAFs are almost certainly subject to alternative splicing (e.g., Weinzierl et al. 1993). It would be surprising if the core promoter sequence did not influence the makeup of the PIC and, hence, the possibility of activation by specific transcription factors.
There are transcription factors not part of, but very frequently acting in concert with, the PIC. For example, on the order of half of all vertebrate promoters contain a somewhat conserved sequence element with a core sequence similar to CCAAT (Benoist et al. 1980; Efstratiadis et al. 1980). There seem to be a large number of factors that interact with CCAAT-like sequences, not all of which are known to actually influence transcription initiation (see Tsutsumi et al. 1993 for a list). CCAAT box-binding factor (CBF, also called NFY and CP1) is a trimeric transcription factor that is known to be involved in the activity of a number of promoters (see Sinha et al. 1996 for an overview). CBF may recruit other common factors to many promoters as well (Wright et al. 1994). Consensus sequences for the DNA-binding sites of CBF match well a mathematical derivation (PWM) of CCAAT commonality between many promoters, so that CBF may be the major factor involved in CCAAT-box function (Bucher 1990). The heavily studied CCAAT/enhancer-binding protein (C/EBP) family (for overviews, see Zhao et al. 1993; Osada et al. 1996) contains at least six members with very similar DNA-binding specificity (Osada et al. 1996) and is known to activate transcription through the CCAAT box of at least some promoters (Cao et al. 1991). There are also repressors known to act through the CCAAT box (e.g., Pattison et al. 1997).
CpG islands (also known as HTF islands and MFIs) are regions of vertebrate genomes defined primarily by the lack of methylation at CpG doublets (for an overview, see Bird 1987). CpG islands are strongly associated with TSS, a fact that gives rise to experimental procedures for isolating promoters (e.g., Shago and Giguere 1996). 5-Methyl-C often mutates to T, so that in most vertebrate DNA CpG occurs at less than one-fourth the frequency expected from the C + G content. However, in CpG islands CpG is much less under-represented. This, together with a somewhat higher than average C + G-content, may allow discrimination of CpG islands in typical DNA sequence data, where the methylation pattern is unknown (e.g., Gardiner-Garden and Frommer 1987).
Any model fully describing determinants of the transcription initiation site (and rate) will include not only discriminatory patterns in DNA sequence but also three-dimensional structure. Compare, for example, the partial explanation of sequence specificity in the TATA box based on the structure of the DNA–TBP complex (Juo et al. 1996); the competition between histones and transcription factors in gene activation/repression (for review, see Kingston et al. 1996); and the existence of transcription factors whose function seems to be reshaping the DNA to bring distant sites into proximity (see, e.g., Wolffe 1994). Unfortunately, the data available on the structural aspects of transcription initiation, particularly the data of general predictive value, remains minuscule compared to relevant data on sequence specificity of protein–DNA contacts, so that transcription factor binding sites will probably remain the focus of promoter recognition algorithms for some time.
Techniques and Resources
Because transcription initiation seems to be brought about by the cooperative binding of a number of proteins to the DNA, the primary computational approach to promoter recognition has been to combine modules recognizing individual binding sites, using some overall description of how these sites should be spatially arranged.
Sometimes binding specificity is characterized using consensus sequences, that is, by giving the most preferred base at each position within a site. But this approach loses much of the information and is of marginal utility. For example, the DNA-binding specificity of the (very large) family of basic helix–loop–helix family of transcription factors (e.g., Kadesch 1993) is often specified as CAnnTG. However, this pattern occurs about once every 256 bp. If all the factors of this family really bound so frequently and without differing specificity, they could certainly not accomplish their role of controlling terminal differentiation of many different tissue types. In fact, their binding is more specific and differs from factor to factor (e.g., cf. Hsu et al. 1994 and Wright et al. 1991).
A PWM assigns a weight to each possible nucleotide at each position of a putative binding site and gives as a site score the sum of these weights. It has been shown that in at least some cases this score approximates the energy of protein binding (Berg and von Hippel 1988and references therein; cf. also Barrick et al. 1994). It is widely recognized that a PWM is a more informative description of a protein’s DNA-binding specificity than is a consensus sequence, and PWMs are often used where enough information is available to build them. Frech et al.(1997a,b) have reviewed both tools for building the PWM (specialized multiple local alignment algorithms) and tools used to search for putative transcription factor binding sites. The statistical significance of PWM match scores has been treated by Hofmann and Bucher (1995) and Claverie and Audic (1996).
The PWM methodology is predicated on the hypothesis that different positions within the site make independent contributions to binding. Although a number of cases are known where this approximation seems to be a reasonable one (e.g., Berg and von Hippel 1988 and references therein; Fickett 1996c), most who have used PWMs know of cases where the method gave poor results. This could be attributable to many reasons, for example, the existence of multiple isoforms of the protein, leading to different classes of sites (e.g., Andres et al. 1995), or alternative protein conformations induced by the DNA structure (e.g., Bonven et al. 1995), leading to correlated preferences at different positions. It will probably be important to apply nonlinear methods of separation (and perhaps develop new ones) for this problem. Nonlinear methods have been successfully applied in the recognition of splicing junctions. Brunak et al. (1991) used multilayer neural nets; Burge and Karlin (1997) used decision trees; and a number of investigators have used position-specific oligonucleotide counts (e.g., Solovyev and Salamov 1997 and references therein).
To build any model of the DNA-binding specificity of a protein, one needs a number of known sites (it would be valuable to have the strength of the sites as well, but this information is rarely available). For core promoter elements the best data source may be the Eukaryotic Promoter Database (EPD; Bucher and Trifonov 1986), a collection of experimentally mapped TSSs and surrounding sequences. For other transcription factors, one traditional data source has been the Transcription Factor Database (TFD; Ghosh 1990), but this database is no longer maintained. Currently maintained collections include TRANSFAC (Wingender et al. 1996) and the Transcription Regulatory Region Database (TRRD; Kel et al. 1994). If one is interested in a particular factor, there is no substitute for reading the literature to find both natural sites and random oligonucleotide selection data (for an overview, see Wright and Funk 1993), and understanding the degree of evidence for each putative site. For hundreds of recently discovered transcription factors, binding site data may be scarce or absent. In some cases, it may be possible to predict the specificity of a new factor from that of a closely related factor whose specificity is known (e.g., Choo and Klug 1994; Suzuki and Yagi 1994).
Bucher (1990) constructed PWM for several core promoter elements; these are widely used in promoter recognition algorithms. PWM for many specific transcription factors have been collected in TRANSFAC and TRRD (see also Chen et al. 1995). Because some of the sites used to build these matrices have questionable experimental support, one should exercise caution in applying them.
Most of the work in this area has centered around characterizing transcription factor binding sites and their relative localization. Approaching a different aspect of the problem, Benham (1996) has described methods to predict regions of helix destabilization, likely to coincide with certain gene features, including transcriptional regulatory regions. Also, the advent of large-scale model organism sequencing allows one to identify functionally important regions of all kinds (though not to differentiate between the different possible functions) by means of sequence conservation. The application of this technique, termed phylogenetic footprinting, to the discovery of gene regulatory regions has been reviewed by Duret and Bucher (1997).
Available Promoter Prediction Tools
In this section we describe publicly available software tools for locating promoters in DNA sequence. To gain some idea of how the tools perform in practice, we tested them on a small sample of recently determined sequences in which the transcription initiation site has been experimentally mapped. We collected 18 published mammalian sequences containing 24 promoters (Table 1) in a total of 33120 bp. Two of these sequences were not found in GenBank (as of February 20, 1997); the others were dated no earlier than May 16, 1996. None of them matches a sequence in EPD (either at the level of identity or at the level of clear homology). Thus, we believe that these represent an independent test set, not overlapping in any significant way the sequences used in the development of the tools described below.
Mapped and Predicted Transcription Start Sites
| Seq. | Citation | TSS | Audic | Autogene | GeneID | NNPP | P’Find | P’Scan | TATA | TSSG | TSSW |
| L47615 3321 bp | Barbeau et al. (1996) | 2078/ 2108 (e) | 2800 3000 r2572 r522 r672 r2422 | 1681 2080 2511 r920 r1623 r2012 | 300 1900 2200 2600 r221 r721 r1521 r1921 | 560 1690 2087 r2440 r2010 r1612 r909 | 2810 r2502 | 270 2707 | 2081 2510 r1302 r1304 r1703 | 262 2578 r166 r2023 r2556 | 246 549 2510 2811 r162 r701 r2023 r2614 |
| U54701 5663 bp | Bernier et al. (1996) | 935(efp); 2002(ef) | 715 2803 3117 3352 5250 5366 5683 r626 r1308 r2909 r5299 | 300 800 2000 2500 3200 3500 4200 r563 r1163 r1663 r2963 r5263 | 234 1095 2995 3121 3129 r4605 r3222 r1808 r528 | 4400 r4904 | 3113 | 119 228 716 2979 2981 3118 3368 5369 r4356 r5619 | 3124 | 2260 3115 | |
| None 2003 bp | Chu et al. (1996) | 1483–1554 (ef); 1756– 1783 (efp) | 1482 | 400 800 1500 r1403 | 1493 | 1060 r864 | r186 | ||||
| U10577 1649 bp | Grande et al. (1996) | 1169–1171 (ef); r1040–1045 (ef) | 1150 1350 1550 r700 r800 | 500 800 | 362 787 1342 | 1170 r870 | 349 | 354 | 352 1165 r1271 | 352 1177 1078 r1432 | |
| U30245 1093 bp | Kao et al. (1996) | 850– 961(efp) | 314 472 680 r251 r386 r569 r620 | 740 r554 | 446 475 690 r528 r680 r818 | r574 | |||||
| U69634 1515 bp | Le et al. (1997) | 1450(ef) | 300, 1500 , r16, r1016 | 300, 1200, r715 | 305, 605, 1376 r864 | 1490 r1186 | 280, 1336 , r54 | 306, 1336 , r61, r1336 | |||
| U29912 565 bp | Mahnke-Zizelman et al. (1996) | 143–166 (efp) | 550 r16 | 395 | 370 r66 | 379 | 383 r306 | 382 r330 | |||
| U29927 2562 bp | Mahnke-Zizelman et al. (1996) | 738– 803(efp); 1553– 1717(efp) | 521 | 700 1800 2400 r162 r762 r1262 r2062 | 528 577 1539 2120 r897 | 1280 r983 | 332 | 1529 | |||
| Y10100 1066 bp | Naville et al. (1997) | 1018– 1033(ef) | 161 769 r102 | 300 r466 | 167 787 r712 r88 | 400 r347 | 159 781 r181 r349 | 282 r183 | 166 r183 | ||
| None 2191 bp | Nomoto et al. (1996) | 1793– 1812(ef) | 2150 r1542 | 114 1139 1267 | 200 700 1000 1500 r691 r1291 | 1198 1297 1382 1649 1774 1852 r1718 r417 | 2010 r1712 | 1782 | 1135 1375 | 1824 r1599 r1936 | 1369 1839 r1599 r2018 |
| U75286 1984 bp | Rogers et al. (1997) | 1416/ 1480(efp) | 1600 r985 | r177 | 800 1200 r1684 | 494 726 1262 r147 | 1320 r1065 | r1245 | 479 1302 r1121 r1732 | ||
| U52432 1604 bp | Schoots et al. (1997) | 1521/ 1523(efp) | 1350 r1005 | 300 r1304 | 1187 1536 r1462 r864 r281 | 1120 r925 | 1138 | r138 | 1231 r954 | 987 1288 r954 | |
| U80601 632 bp | Silins et al. (1997) | 317– 400(ef) | 600 r33 | 135 296 309 389 402 414 433 530 542 551 607 r490 r478 r448 r378 r363 r275 | 620 r333 | 269 | 348 r284 | 393 r195 r518 | |||
| X94563 2692 bp | Swinnen et al. (1996) | 1163– 1200(ef) | 1000 1300 1900 2050 r1693 r1593 r1493 r893 | 374 2528 r262 r1044 r2469 | 700 1000 r1992 r2392 | 1200 1483 r2460 r2109 r1125 r251 | 1170 r1013 | 613 2527 r227 r578 r2436 | 1116 r1026 | 1188 1880 r1069 r1709 | |
| Z49978 1352 bp | Szabo et al. (1996) | 855(e); 1020(e); 1150(e) | 1350 r1053 r903 | 289 889 1010 r190 r235 r955 | 400 1100 r852 | 127 1017 r942 r373 r187 r68 | 1320 r1023 | 1126 | 893 1011 r405 r1122 r1160 | 1152 r1039 r196 | 116 1212 r196 r1060 |
| U49855 682 bp | Toulouse et al. (1996) | 28/51(e) | 400 r33 | r382 | 72 201 r156 r127 | 310 r33 | 251 r89 | 240 r168 r538 | |||
| X75410 918 bp | Wieman et al. (1996) | 815/835/ 836(ef) | 146 476 601 656 682 778 871 931 r304 r405 r472 r510 r721 | 800 | 156 578 r501 r292 r39 | 300 r9 | 461 572 640 685 925 r198 r340 r385 r408 r410 r619 r874 r876 | ||||
| U24240 1728 bp | Yoo et al. (1996) | 1480(p) | 1400 | r117 r767 r821 r887 | 600 1100 r528 | r744 r958 r1364 r91 | 1350 r1429 | r959 | 1518 | 1518 r1378 |
[i] For each sequence tested (all mammalian), the DDBJ/EMBL/GenBank accession no. and length is listed, then the citation, transcription start site(s) (TSS), and prediction results from the various algorithms. A semicolon separates (groups of) TSSs that belong to different exons, or to functionally verified distinct promotors. Within a group of TSSs, if more than three were given by the investigators, and they were divided into major and minor sites, only major sites are listed (with the assumption that the minor starts are as likely to be from mRNA degradation products as from genuine alternative CAP sites). If more than three TSSs are given and all have equal status, the first and last, separated by a dash, are listed. If the TSS is prefixed with an r, the sense strand is the reverse complement of that given in the database (and numbering is 5’ to 3’ on that strand). For U75286, an alternate TSS is given by Chang and Yoshida (1997). With each TSS is given the experimental mapping method(s): (e) Primer extension; (f) functional promoter assay; (p) RNase protection. Correct predictions are shown in boldface type and underlined. The programs are described in the text.
Each tool was used with the default settings and was tested in early March 1997 (most of the on-line services do not give version numbers). The computer predictions are given alongside the mapped TSS in Table 1. It is difficult to summarize the degree of agreement of the computer predictions with experimental results, because of ambiguities in the results on both sides. Experimental accuracy may be impacted by mRNA degradation, which can lead to the mapped location of the TSS being 3′ to its true location. Some programs aim to locate the TSS exactly, tolerating a high false-positive rate, with the idea that the approximate location will already be known. Some are intended to analyze large genomic sequences and have as their goal the approximate localization of promoters or gene starts. We evaluated only the ability to approximately locate the TSS itself. If a program gave a promoter prediction but not an explicit TSS, we took the 3′ end of any predicted promoter window as the predicted TSS. The predicted TSS, explicit or implicit, was counted as correct if it was within 200 bp 5′, or 100 bp 3′, of any experimentally mapped TSS. Given these criteria, accuracy results are summarized in Table 2. Because of the limited sample size and the possibly skewed nature of the sample (discussed below), results should be taken as provisional and perhaps pessimistic.
Program Accuracy
| Audic | Autogene | GeneID | NNPP | P’Find | P’Scan | TATA | TSSG | TSSW | |
| Sensitivity | 5/24 24% | 7/24 29% | 10/24 42% | 13/24 54% | 7/24 29% | 3/24 13% | 6/24 25% | 7/24 29% | 10/24 42% |
| Specificity | 33 fp 1/1004 bp | 51 fp 1/649 bp | 51 fp 1/649 bp | 72 fp 1/460 bp | 29 fp 1/1142 bp | 6 fp 1/5520 bp | 47 fp 1/705 bp | 25 fp 1/1325 bp | 42 fp 1/789 bp |
[i] Overall accuracy of the programs tested. For each program the sensitivity (both as the number and percentage of promotors correctly detected) and specificity (as number of false positives and number of base pairs per false positive) is given.
Audic/Claverie
Audic and Claverie (1997) construct Markov models of vertebrate promoter sequences (based on EPD) and nonpromoter sequences (based on regions adjacent to the promoters used). For an arbitrary test window a Bayesian choice is then made between the promoter and nonpromoter hypotheses. This program (available at [email protected]) identified 5 (21%) of the true promoters and reported 33 false positives, or 1/1004 bp (here and below it is base pairs, not single-strand bases, that are counted).
Autogene
Autogene (available by ftp from ftp.bionet.nsc.ru; directory pub/biology/aug) includes a module for promoter recognition (Kondrakhin et al 1995). The program utilizes a set of 136 consensus sequences for transcription factor binding sites collected by Faisst and Meyer (1992). A training set of 472 promoters was taken from the EMBL Database, based on annotation in EPD and EMBL. The occurrence frequencies for each of the consensus sequences in ∼50 fixed length subregions of the promoters was determined. In a test sequence, an occurrence of one of the consensus sequences in one of the subregions was weighted according to the frequency with which it occurred in that subregion in a certain subset of the training set (determined by a clustering algorithm based on the consensus site occurrences) and the expected frequency of occurrence in random DNA. In most cases, the program suggested a range of a few base pairs, of which we took the last as the prediction. Autogene identified 7 (29%) of the true promoters and reported 51 false positives, or 1/649 bp.
GeneID/Promoter1.0
An unpublished promoter-finding algorithm, developed by S. Knudsen (Technical University of Denmark), is included in the GeneID e-mail server (send “help” to [email protected]). According to the on-line documentation, “Promoters are predicted by a program called promoter1.0. It has been developed as an evolution of simulated transcription factors that interact with sequences in promoter regions.” In our tests promoter1.0 identified 10 (42%) of the promoters, and reported 51 false positives (1/649 bp).
NNPP
NNPP (M. Reese, http://www-hgc.lbl.gov/inf/nnpp-abstract.html) combines recognition of the TATA box and the Inr, using the time delay neural net architecture, which allows for variable spacing between the features. We tested the algorithm using the on-line service athttp://www-hgc.lbl.gov/projects/promoter.html. When tested on our data set NNPP identified 13 of the 24 promoters (54%) and reported 72 false positives (1/460 bp). [At the optional threshold 0.9, 7 (29%) of the promoters were identified, and 31 false positives (1/1068 bp) were reported.]
PromFind
PromFind (Hutchinson 1996) is not based on any collection of putative transcription factor binding sites but, rather, on the differences in nucleotide hexamer frequencies (following Claverie and Bougueleret 1986) between promoters, protein coding regions, and noncoding regions downstream of the first coding exon. Training and testing sets were taken from some of the GenBank sequences with corresponding entries in EPD. Among all sites in an input sequence where the promoter versus coding region discriminant exceeds a certain threshold, the site where the promoter versus noncoding region discriminant reaches its maximum (over the input sequence) is taken as a promoter. PromFind (taken from the ftp site iubio.bio.indiana.edu, directory molbio/ibmpc; for future versions, see also http://www.rabbithutch.com) identified 7 of the 24 promoters (29%) and reported 29 false positives (1/1142 bp).
PromoterScan
PromoterScan (Prestridge 1995) recognizes primate promoters by means of (1) the TATA PWM from Bucher (1990), and (2) the density of specific transcription factor binding sites. In calibration, occurrences of each transcription factor binding site listed in TFD was counted in EPD primate sequences and in primate nonpromoter sequences from GenBank. The ratio of the densities of occurrence in each of these two sets is used as a weighting factor for that site. Then in application, the weighting factors for those sites occurring in the test sequence are combined with a TATA box score. The algorithm sometimes suggests a TSS and sometimes only gives a 250-bp window within which a core promoter sequence is thought to occur. In the latter case, we took the end of the window as the predicted TSS. In our tests (at http://biosci.cbs.umn.edu/software/proscan/promoterscan.ht) PromoterScan identified three (13%) of the known promoters and predicted six apparent false positives, or 1/5520 bp.
TATA
Because many investigators rely heavily on the TATA box to help locate a possible promoter, we also tested the TATA PWM from Bucher (1990) as an independent predictor. Bucher found that most TATA boxes were centered at a point 20–36 bp upstream of the TSS, so we took the point 28 bp downstream of the center of the putative TATA box as the predicted TSS. At the recommended cutoff score (−8.16) the TATA PWM gave 159 predictions in our test set. We used a more restrictive cutoff, namely −6.5, that gave 54 predictions, more in line with the other methods. With these parameters the TATA PWM identified 6 (25%) of the known promoters and predicted 47 apparent false positives (1/705 bp).
TSSG and TSSW
TSSG and TSSW (Solovyev and Salamov 1997) both use the same underlying algorithm, which uses a linear discriminant function combining (1) a TATA box score, (2) triplet preferences around the TSS, (3) hexamer preferences in the regions −1 to −100, −101 to −200, and −201 to −300 relative to the TSS, and (4) potential transcription factor binding sites. TSSG is based on the promoter.dat file derived from TFD by Prestridge (1995), whereas TSSW is based on TRANSFAC. TSSG and TSSW were accessed at the sitehttp://dot.imgen.bcm.tmc.edu:9331/gene-finder/gf.html. TSSG correctly predicted 7 (29%) of the true promoters and predicted 25 false positives (1/1325 bp). TSSW correctly predicted 10 (42%) of the true promoters and gave 42 false positives (1/789 bp).
Algorithms Not Included in the Test Results
GRAIL includes promoter recognition as one component of integrated gene structure prediction (Matis et al. 1996). The promoter recognition module combines matrix scores for the TATA-, GC- and CAAT-boxes, the Inr, and the translation start site with constraints on the distances between these elements, using a neural network. Then several rules are applied to combine this independent evidence for a promoter with the expected location of a promoter based on predicted coding exons. The independent promoter component is not available separately; we tested the integrated algorithm using the XGRAIL interface (ftparthur.epm.ornl.gov, directory pub/xgrail), but these results cannot be compared directly with those for the tools considered above. In the test set used here, GRAIL was unable to find the promoters because the coding regions were not included. In sequences with complete genes, GRAIL performed better than the other algorithms (data not shown), but it is difficult to judge how well this reflects the performance of the promoter module per se. The program of Chen et al. (1997) also makes predictions that are not comparable with the others, being non-strand-specific. The method of Crowley et al. (1997) was published after the benchmarking here had been carried out. Descriptions of other possible promoter recognition methods may be found in Larsen et al. (1995); Hatzigeorgiou et al. (1996); and Pedersen et al. (1996).
DISCUSSION
The accuracies of the various programs are plotted in Figure 1, where it may be seen that the true positive rate is approximately a constant fraction of the total number of predictions. For comparison we also show a line on which the accuracy rates of completely random predictions would fall.
Each point plotted represents the accuracy of one program, with the abscissa being the total number of predictions made by the program, and the ordinate being the number of correct predictions. For comparison the line y = 0.11x is plotted. 0.11 is the fraction of all bases in the test set where a prediction would be counted as correct, so that points on the line would reflect the accuracy, on average, of random predictions.
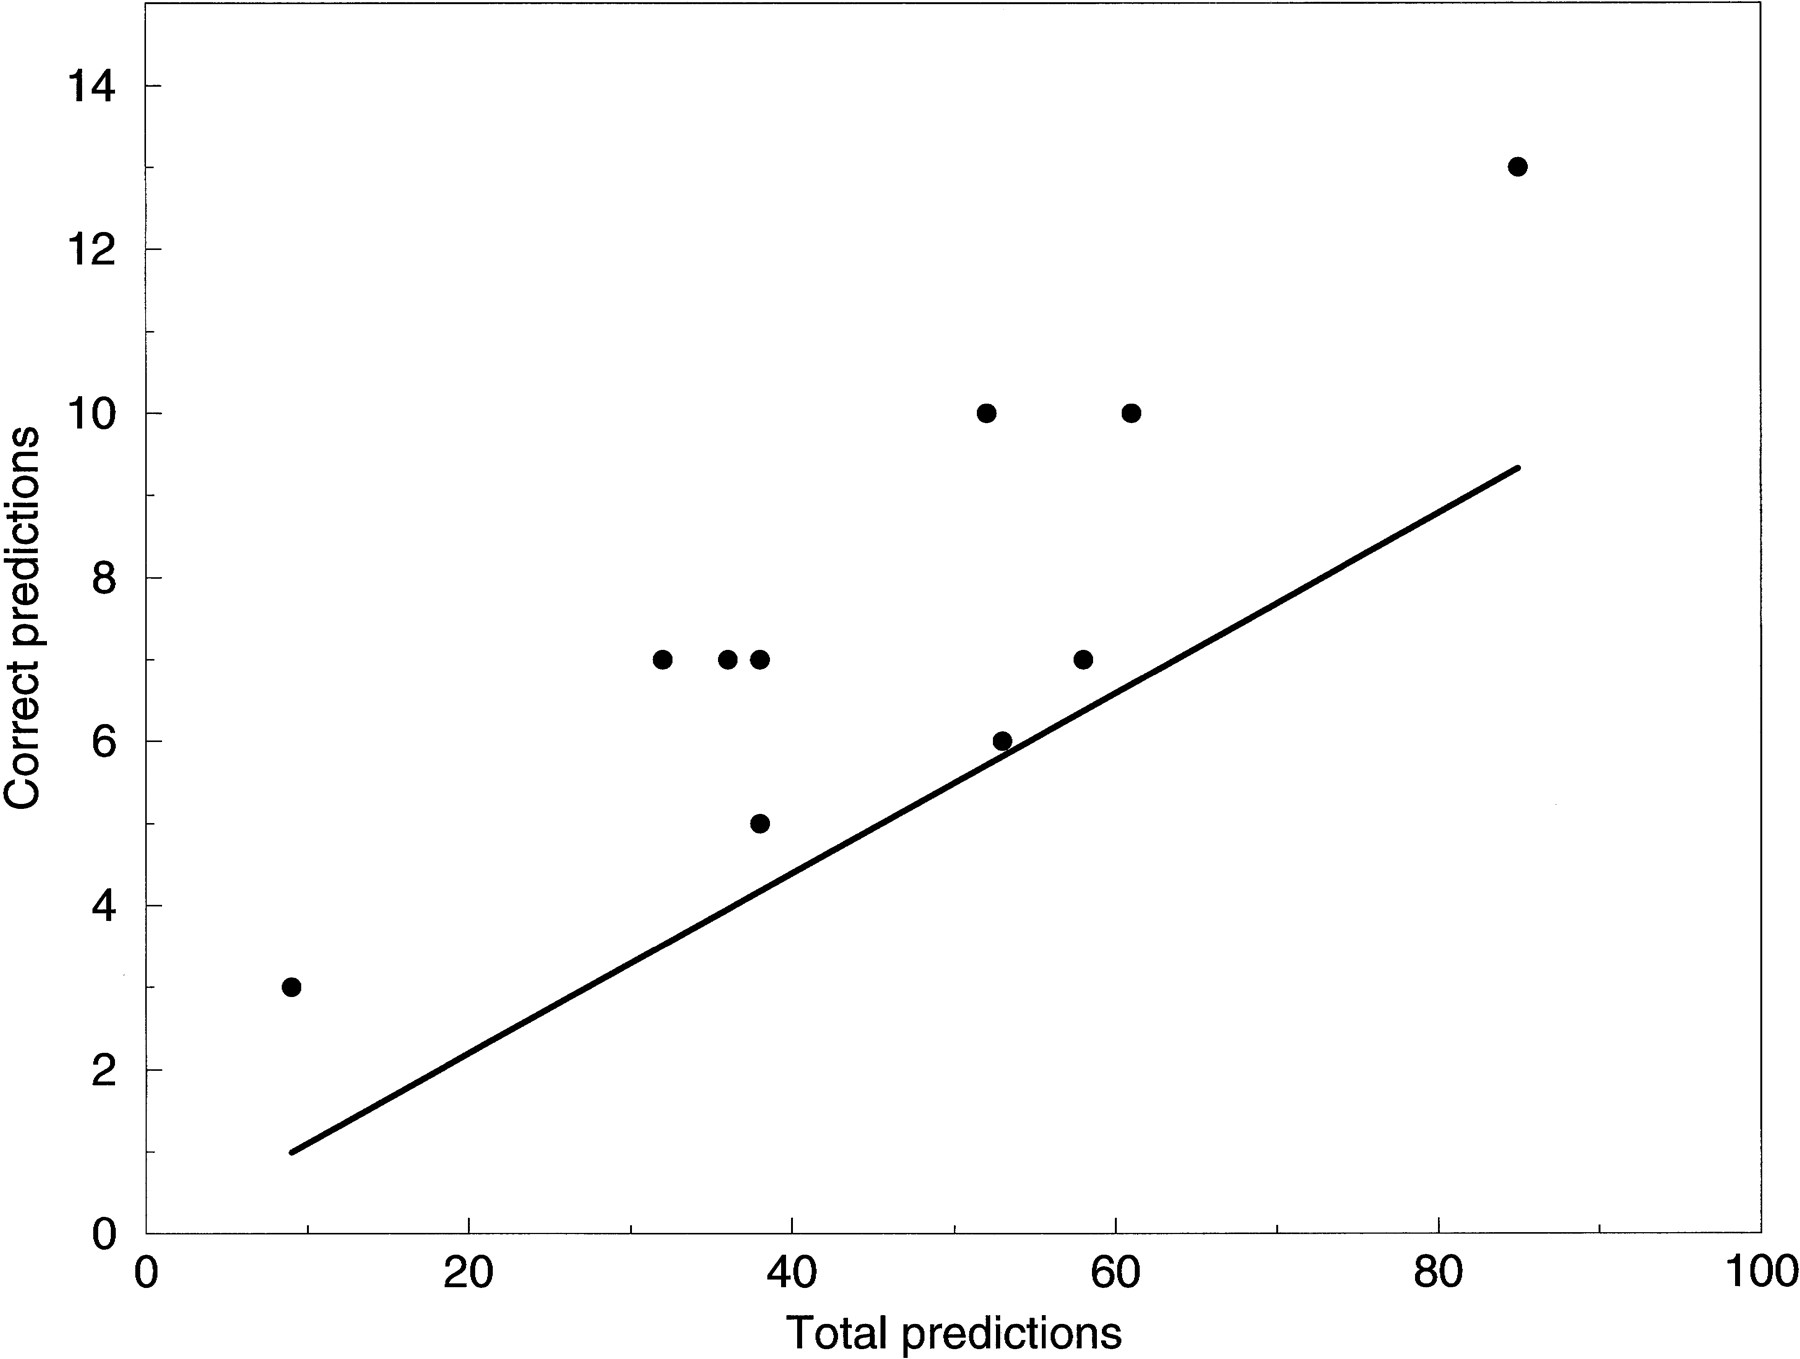
The results presented here should not be used to compare the various programs among themselves (except perhaps to note that no technique used to date is obviously superior to the others), in part because the test set is small for this purpose. Also, the programs use somewhat different definitions of the problem and are not really directly comparable. Our tests were in some sense unfair for each program, usually in a unique way for each. For example, PromFind is intended to locate the promoter when one already knows the approximate gene location and the coding strand, and so it makes exactly one prediction, on the strand presented, in each sequence it is given to analyze; but we had multiple promoters in some sequences, and we tested both strands of each sequence with each program. An examination of the test results in light of each program’s design goals will still show, however, that our conclusions about the general state of the field are not materially affected.
At the default settings, the algorithms we tested found 13%–54% of the true promoters in our test set. However, in the test sets used by the developers the correct prediction rates were higher, and it must be noted that the test set we used was perhaps not representative. It is possible that the way we chose the test set, namely searching recent issues of journals with a focus on transcriptional regulation, retrieved promoters that are active in very specialized contexts. Furthermore, in two cases there are fewer nucleotides upstream of the experimentally mapped TSS than are required for the analysis window of some of the programs. Nevertheless, investigators do need to analyze sequences like the ones in our test set, and the test results do suggest that the challenge of finding all promoters reliably is far from being met.
The programs reported on the order of one false positive per kilobasepair. On the surface, this suggests that if they were applied to a mammalian genome as a whole (with approximately one gene per few tens of kilobases), they would give a few tens of false positives for each real gene. This too may be misleading, however. Because most of the algorithms make use of transcription factor binding site density, they may be expected to give a high signal on enhancers as well as promoters. And although enhancers may be found anywhere up to tens of kilobases away from the TSS, they tend to be more concentrated near the promoter. Thus, it is quite possible that current tools have simply not developed far enough to differentiate reliably between promoters and enhancers and that some of the false positives are in fact true transcriptional regulatory regions. On the other hand, it is also possible that some of the true positives in this set, where the promoter density is high, are attributable to chance and that the false-positive rate would be higher in general genomic DNA.
Although our current knowledge of transcription initiation is still far from complete, it is clear that considerable information is available that has not yet found its way into current algorithms. Given the advances in our understanding of promoters gained from experimental methods in the last few years, there are grounds for cautious optimism that better algorithms can, in fact, be developed.
Wherever a consensus sequence, a PWM, or other recognition module is built to discern the binding sites of a protein, it is probably worth taking the time to fully evaluate the experimental data available, as well as using the latest computational techniques. To quote Frech et al. (1997b), “perhaps more time and effort should be invested in improving the quality of matrix libraries rather than in developing new algorithms to calculate matrix scores.”
However, it will be many years before the majority of transcription factors and their DNA-binding specificities becomes known. One natural way to try to improve promoter prediction would be to concentrate on the core promoter elements. For example, (1) an evaluation of the Bucher TATA matrix on a large number of TATA boxes with proven function would be valuable. Also, given the dependence of activator function on TATA sequence, it would be worth attempting nonlinear recognition methods, such as neural nets or quadratic discriminant analysis. (2) The very low information content of the overall Inr consensus (Javahery et al. 1994), together with the evidence for involvement of multiple proteins families and the existence of conserved elements that occur in some but not all sequences downstream of promoters, suggests that it might be worthwhile to attempt either cluster analysis or nonlinear discrimination of proven, functional Inr sequences. (3) The CCAAT box pattern most used in current algorithms, namely that of Bucher (1990), was derived not from a biological definition, but from a computational one. Bucher’s algorithm was, very roughly, to find a linearly definable pattern common to many promoters and with a strong similarity to CCAAT. Now that several proteins are known to recognize a similar pattern and to be involved in transcription initiation, it seems worth investigating whether there are different classes of CCAAT boxes corresponding to the different proteins.
This work was supported by SmithKline Beecham Pharmaceuticals, Synaptic Ltd., and U.S. Public Health Service grant HG00981-01A1 from the National Center for Human Genome Research. We thank P. Agarwal, J.-M. Claverie, M. Gelfand, I. Grosse, R. Guigo, W. Wasserman, and M. Zhang for valuable comments on the work.
Notes
[3] Corresponding author.
Notes
[4] E-MAIL [email protected]; FAX (610) 270-5580.
REFERENCES
- ↵V. AndresM. CerveraV. Mahdavi(1995) Determination of the consensus binding site for MEF2 expressed in muscle and brain reveals tissue-specific sequence constraints. J. Biol. Chem. 270:23246–23249.
- ↵Audic, S. and J.-M. Claverie. 1997. Detection of eukaryotic promoters using Markov transition matrices. Comput. Chem. 21: (in press)..
- ↵B. BarbeauD. BergeronM. BeaulieuZ. NadjemE. Rassart(1996) Characterization of the human and mouse Fli-1 promoter regions. Biochim. Biophys. Acta 1307:220–232.
- ↵D. BarrickK. VillaneubaJ. ChildsR. KalilT.D. SchneiderC.E. LawrenceL. GoldD. Stormo(1994) Quantitative analysis of ribosome binding sites in E. coli. Nucleic Acids Res. 22:1287–1295.
- ↵C.J. Benham(1996) Computation of DNA structural variability—A new predictor of DNA regulatory regions. Comp. Appl. Biosci. 12:375–382.
- ↵C. BenoistK. O’HareR. BreathnachP. Chambon(1980) The ovalbumin gene-sequence of putative control regions. Nucleic Acids. Res. 8:127–142.
- ↵O.G. BergP.H. von Hippel(1988) Selection of DNA binding sites by regulatory proteins. Trends Biochem. Sci. 13:207–211.
- ↵F. BernierP. SoucyV. Luu-The(1996) Human phenol sulfotransferase gene contains two alternative promoters: Structure and expression of the gene. DNA Cell Biol. 5:367–375.
- ↵A.P. Bird(1987) CpG islands as gene markers in the vertebrate nucleus. Trends Genet. 3:342–347.
- ↵B.J. BonvenA.L. NielsenP.L. NorbyF.S. PedersenP. Jorgensen(1995) E-box variants direct formation of distinct complexes with the basic helix-loop-helix protein ALF1. J. Mol. Biol. 249:564–575.
- ↵S. BrunakJ. EngelbrechtS. Knudsen(1991) Prediction of human mRNA donor and acceptor sites from the DNA sequence. J. Mol. Biol. 220:49–65.
- ↵P. Bucher(1990) Weight matrix descriptions of four eukaryotic RNA polymerase II promoter elements derived from 502 unrelated promoter sequences. J. Mol. Biol. 212:563–578.
- ↵P. BucherE.N. Trifonov(1986) Compilation and analysis of eukaryotic POL II promoter sequences. Nucleic Acids Res. 14:10009–10026.
- ↵C. BurgeS. Karlin(1997) Prediction of complete gene structures in human genomic DNA. J. Mol. Biol. 268:79–94.
- ↵T.W. BurkeJ.T. Kadonaga(1996) Drosophila TFIID binds to a conserved downstream basal promoter element that is present in many TATA-box-deficient promoters. Genes & Dev. 10:711–724.
- ↵S.K. BurleyR.G. Roeder(1996) Biochemistry and structural biology of transcription factor IID (TFIID). Annu. Rev. Biochem. 65:769–799.
- ↵M. BursetR. Guigo(1996) Evaluation of gene structure prediction programs. Genomics 34:353–367.
- ↵Z. CaoR. . UmekS.L. McKnight(1991) Regulated expression of three C/EBP isoforms during adipose conversion of 3T3-L1 cells. Genes & Dev. 5:1538–1552.
- ↵C. ChangA. Yoshida(1997) Human fatty aldehyde dehydrogenase gene (ALDH10): Organization and tissue-dependent expression. Genomics 40:80–85.
- ↵D.M. ChaoR.A. Young(1996) Activation without a vital ingredient. Nature 383:119–120.
- ↵Q.K. ChenG.Z. HertzG. Stormo(1995) MATRIX SEARCH 1.0: A computer program that scans DNA sequences for transcriptional elements using a database of weight matrices. Comp. Appl. Biosci. 11:563–566.
- ↵Q.K. ChenG.Z. HertzG.D. Stormo(1997) PromFD 1.0: A computer program that predicts eukaryotic pol II promoters using strings and IMD matrices. Comp. Appl. Biosci. 13:29–35.
- ↵Y. ChooA. Klug(1994) Selection of DNA binding sites for zinc fingers using rationally randomized DNA reveals coded interactions. Proc. Natl. Acad. Sci. 91:11168–11172.
- ↵Y-Y. ChuK.-H. TuY.C. LeeZ.-H. KuoH.L. LaiY. Chern(1996) Characterization of the rat A2a adenosine receptor gene. DNA Cell Biol. 15:329–337.
- ↵J.-M. ClaverieS. Audic(1996) The statistical significance of nucleotide position-weight matrix matches. Comp. Appl. Biosci. 12:431–440.
- ↵J.-M. ClaverieL. Bougueleret(1986) Heuristic informational analysis of sequences. Nucleic Acids Res. 14:179–196.
- ↵J.-M. ClaverieI. Sauvaget(1985) Assessing the biological significance of primary structure consensus patterns using sequence databanks. I. Heat-shock and glucocorticoid control elements in eukaryotic promoters. Comp. Appl. Biosci. 1:95–104.
- ↵B. CoulombeJ. LiJ. Greenblatt(1994) Topological localization of the human transcription factors IIA, IIB, TATA box-binding protein, and RNA polymerase II-associated protein 30 on a class II promoter. J. Biol. Chem. 269:19962–19967.
- ↵E.M. CrowleyK. RoederM. Bina(1997) A statistical model for locating regulatory regions in genomic DNA. J. Mol. Biol. 268:8–14.
- ↵M.E. DalphinC.M. BrownP.A. StockwellW.P. Tate(1997) The translational signal database, TransTerm: More organisms, complete genomes. Nucleic Acids Res. 25:246–247.
- ↵C.J. DeckerR. Parker(1994) Mechanisms of mRNA degradation in eukaryotes. Trends Biochem. Sci. 19:336–340.
- ↵T.T. DiaganaD.L. NorthC. JabetM.Y. FiszmanS. TakedaR.G. Whalen(1997) The transcriptional activity of a muscle-specific promoter depends critically on the structure of the TATA element and its binding protein. J. Mol. Biol. 265:480–493.
- ↵L. DuretP. Bucher(1997) Searching for regulatory elements in human noncoding sequences. Curr. Opin. Struc. Biol. 7:399–406.
- ↵A. EfstratiadisJ.W. PosakonyT. ManiatisR.M. LawnC. O’ConnellR.A. SpritzJ.K. DeRielB.G. ForgetS.M. WeissmanJ.L. SlightomA.E. BlechlO. SmithiesF.E. BaralleC.C. ShouldersN.J. Proudfoot(1980) The structure and evolution of the human beta-globin gene family. Cell 21:653–668.
- ↵Q.G. EichbaumR. IyerD.P. RavehC. MathieuR.A.B. Ezekowitz(1994) Restriction of interferon γ responsiveness and basal expression of the myeloid human FcγR1b gene is mediated by a functional PU.1 site and a transcription initiator consensus. J. Exp. Med. 179:1985–1986.
- ↵K.H. EmamiW.W. NavarreS.T. Smale(1995) Core promoter specificities of the Sp1 and VP16 transcriptional activation domains. Mol. Cell. Biol. 15:5906–5916.
- ↵S. FaisstS. Meyer(1992) Compilation of vertebrate encoded transcription factors. Nucleic Acids Res. 20:3–26.
- ↵J.W. Fickett(1996a) Finding genes by computer: The state of the art. Trends Genet. 12:316–320.
- ↵(1996b) Coordinate positioning of MEF2 and myogenin binding sites. Gene 172:GC19–GC32, ibid.
- ↵(1996c) Quantitative discrimination of MEF2 sites. Mol. Cell Biol. 16:437–441, ibid.
- ↵C. FondratA. Kalogeropoulos(1994) Approaching the function of new genes by the detection of their potential upstream activation sequences in Saccharomyces cerevisiae: Application to chromosome III. Curr. Genet. 25:396–406.
- ↵K. FrechK. QuandtT. Werner(1997a) Software for the analysis of DNA sequence elements of transcription. Comp. Appl. Biosci. 13:89–97.
- ↵(1997b) Finding protein-binding sites in DNA sequences: The next generation. Trends Biochem. Sci. 22:103–104, ibid.
- ↵M. Gardiner-GardenM. Frommer(1987) CpG islands in vertebrate genomes. J. Mol. Biol. 196:261–282.
- ↵M.S. Gelfand(1995) Prediction of function in DNA sequence analysis. J. Comp. Biol. 2:87–115.
- ↵M.S. GelfandA.A. MironovP.A. Pevzner(1996) Gene recognition via spliced sequence alignment. Proc. Nat. Acad. Sci. 93:9061–9066.
- ↵D. Ghosh(1990) A relational database of transcription factors. Nucleic Acids. Res. 18:1749–1756.
- ↵W. GishD.J. States(1993) Identification of protein coding regions by database similarity search. Nature Genet. 3:266–272.
- ↵J.P. GrandeD.C. MelderD.L. KlugeE.D. Wieben(1996) Structure of the rat collagen IV promoter. Biochim. Biophys. Acta 1309:85–88.
- ↵P.A.B. HarburyK. Struhl(1989) Functional distinctions between yeast TATA elements. Mol. Cell. Biol. 9:5298–5304.
- ↵A.G. HatzigeorgiouN. MacheM. Reczko(1996) Functional site prediction on the DNA sequence by artificial neural networks. Proceedings of the IEEE International Joint Symposia on Intelligence and Systems (IEEE Computer Society Press, Los Alamitos, CA), pp 12–17.
- ↵K. HofmannP. Bucher(1995) The FHA domain: A putative nuclear signalling domain found in protein kinases and transcription factors. Trends Biochem. Sci. 20:347–349.
- ↵H.-L. HsuL. HuangJ.T. TsanW. FunkW.E. WrightJ.-S. HuR.E. KingstonR. Baer(1994) Preferred sequences for DNA recognition by the TAL1 helix-loop-helix proteins. Mol. Cell. Biol. 14:1256–1265.
- ↵G.B. Hutchinson(1996) The prediction of vertebrate promoter regions using differential hexamer frequency analysis. Comp. Appl. Biosci. 12:391–398.
- ↵T.A. InceK.W. Scotto(1995) A conserved downstream element defines a new class of RNA polymerase II promoters. J. Biol. Chem. 270:30249–30252.
- ↵X. JacqC. BrouY. LutzI. DavidsonP. ChambonL. Tora(1994) Human TAFII30 is present in a distinct TFIID complex and is required for transcriptional activation by the estrogen receptor. Cell 79:107–117.
- ↵R. JavaheryA. KhachiK. LoB. Zenzie-GregoryS.T. Smale(1994) DNA sequence requirements for transcriptional initiator activity in mammalian cells. Mol. Cell Biol. 14:116–127.
- ↵Z.J. JuoT.K. ChiuP.M. LeibermanI. BaikalovA.J. BerkR.E. Dickerson(1996) How proteins recognize the TATA box. J. Mol. Biol. 261:239–254.
- ↵T. Kadesch(1993) Consequences of heteromeric interactions among helix-loop-helix proteins. Cell Growth Differ. 4:49–55.
- ↵K. KaiserM. Meisterernst(1996) The human general co-factors. Trends Biochem. Sci. 21:342–345.
- ↵W.Y. KaoL.L. DworkinJ.A. BriggsR.C. Briggs(1996) Characterization of the human myeloid cell nuclear differentiation antigen gene promoter. Biochim. Biophys. Acta 1808:201–204.
- ↵J. KaufmannC.P. VerrijzerJ. ShaoS.T. Smale(1996) CIF, an essential cofactor for TFIID-dependent initiator function. Genes & Dev. 10:873–886.
- ↵O.V. KelA.G. RomachenkoA.E. KelA.N. NaumochkinN.A. Kolchanov(1994) Structure of data representation in TRRD—Database of transcription regulatory regions on eukaryotic genomes. Proceedings of the 28th Annual Hawaii International Conference on System Sciences v5, Biotechnology Computing (IEEE Computer Society Press, Los Alamitos, CA), pp 42–51.
- ↵R.E. KingstonC.A. BunkerA.N. Imbalzano(1996) Repression and activation by multiprotein complexes that alter chromatin structure. Genes & Dev. 10:905–920.
- ↵Y.V. KondrakhinA.E. KelN.A. KolchanovA.G. RomashchenkoL. Milanesi(1995) Eukaryotic promoter recognition by binding sites for transcription factors. Comp. Appl. Biosci. 11:477–488.
- ↵Y. KondrakhinV. ShamirN. Kolchanov(1994) Construction of a generalized consensus matrix for recognition of vertebrate pre-mRNA 3′ terminal processing sites. Comp. Appl. Biosci. 10:597–603.
- ↵R.D. Kornberg(1996) RNA polymerase II transcription control. Trends Biochem. Sci. 21:325–326.
- ↵M. Kozak(1992) Regulation of translation in eukaryotic systems. Annu. Rev. Cell Biol. 8:197–225.
- (1996) Interpreting cDNA sequences: Some insights from studies on translation. Mammal. Genome 7:563–574, ibid.
- ↵R.J. KrausE.E. MurrayS.R. WileyN.M. ZinkK. LoritzG.W. GelembiukJ.E. Mertz(1996) Experimentally determined weight matrix definitions of the initiator and TBP binding site elements of promoters. Nucleic Acids Res. 24:1531–1539.
- ↵N.I. LarsenJ. EngelbrechtS. Brunak(1995) Analysis of eukaryotic promoter sequences reveals a systematically occurring CT-signal. Nucleic Acids Res. 23:1223–1230.
- ↵F. LeK. GroshanX.P. ZengE. Richelson(1997) Characterization of the genomic structure, promoter region, and a tetranucleotide repeat polymorphism of the human neurotensin receptor gene. J. Biol. Chem. 272:1315–1322.
- ↵H. LiY. Capetanaki(1994) An E box in the desmin promoter cooperates with the E box and MEF-2 sites of a distal enhancer to direct muscle-specific transcription. EMBO J. 13:3580–3589.
- ↵D.K. Mahnke-ZizelmanR. EddyT.B. ShowsR.L. Sabina(1996) Characterization of the human AMPD3 gene reveals that 5′ exon usage is subject to transcriptional control by three tandem promoters and alternative splicing. Biochim. Biophys. Acta 1306:75–92.
- ↵E. MartinezQ. ZhouN.D. L- EtoileT. OelgeschlaegerA.J. BerkR.G. Roeder(1995) Core promoter-specific function of a mutant transcription factor TFIID defective in TATA-box binding. Proc. Natl. Acad. Sci. 92:11864–11868.
- ↵S. MatisY. XuM. ShahX. GuanJ.R. EinsteinR. MuralE. Uberbacher(1996) Detection of RNA polymerase II promoters and polyadenylation sites in human DNA sequence. Comput. Chem. 20:135–140.
- ↵M. McKeown(1992) Alternative mRNA splicing. Annu. Rev. Cell. Biol. 8:133–155.
- ↵D. NavilleC. JaillardL. BarjhouxP. DurandM. Begeot(1997) Genomic structure and promoter characterization of the human ACTH receptor gene. Biochem. Biophys. Res. Commun. 230:7–12.
- ↵K. NomotoN. ShibataK. KitamuraY. MizunoK. Kikuchi(1996) Molecular cloning and analysis of the 5′-flanking region of the rat PP1 α gene. Biochim. Biophys. Acta 1309:221–225.
- ↵C.D. NovinaA.L. Roy(1996) Core promoters and transcriptional control. Trends Genet. 12:351–355.
- ↵S. OsadaH. YamamotoT. NishiharaM. Imagawa(1996) DNA binding specificity of the CCAAT/enhancer-binding protein transcription factor family. J. Biol. Chem. 271:3891–3896.
- ↵S. PattisonD.G. SkalnikA. Roman(1997) CCAAT displacement protein, a regulator of differentiation-specific gene expression, binds a negative regulatory element within the 5′ end of the human papillomavirus type 6 long control region. J. Virol. 71:2013–2022.
- ↵A.G. PedersenP. BaldiS. BrunakY. Chauvin(1996) Characterization of prokaryotes and eukaryotic promoters using hidden Markov models. in The Fourth International Conference on Intelligent Systems in Molecular Biology, eds D.J. StatesP. AgarwalT. GaasterlandL. HunterR. Smith(AAAI Press, Menlo Park, CA), pp 182–191.
- Y. PrasharS.M. Weissman(1996) Analysis of differential gene expression by display of 3′ end restriction fragments of cDNAs. Proc. Natl. Acad. Sci. 93:659–663.
- ↵D.S. Prestridge(1995) Predicting Pol II promoter sequences using transcription factor binding sites. J. Mol. Biol. 249:923–932.
- ↵M. PtashneA. Gann(1997) Transcriptional activation by recruitment. Nature 386:569–577.
- ↵B.A. PurnellP.A. EmanuelD.S. Gilmour(1994) TFIID sequence recognition of the initiator and sequences farther downstream in Drosophila class II genes. Genes & Dev. 8:830–842.
- ↵R.G. Roeder(1996) The role of general initiation factors in transcription by RNA polymerase II. Trends Biochem. Sci. 21:327–335.
- ↵G.R. RogersG.M. NedialkaV. De LaurenziW.B. RizzoJ.G. Compton(1997) Genomic organization and expression of the human fatty aldehyde dehydrogenase gene (FALDH). Genomics 39:127–135.
- ↵D.A. RosenbluethD. ThieffryA.M. HuertaH. SalgadoJ. Collado-Vides(1996) Syntactic recognition of regulatory regions in Escherichia coli. Comp. Appl. Biosci. 12:415–422.
- ↵T.D. SchneiderG.D. StormoL. GoldA. Ehrenfeucht(1986) Information content of binding sites on nucleotide sequences. J. Mol. Biol. 188:415–431.
- ↵O. SchootsT. VoskoglouH.H.M. Van Tol(1997) Genomic organization and promoter analysis of the human G-protein coupled K+ channel Kir3.1 (KCNJ3/GHIRK1). Genomics 39:279–288.
- ↵M. ShagoV. Giguere(1996) Isolation of a novel retinoic acid-responsive gene by selection of genomic fragments derived from CpG-island-enriched DNA. Mol. Cell Biol. 16:4337–4348.
- ↵J. ShineL. Dalgarno(1974) The 3′ terminal sequence of Escherichia coli 16S ribosomal RNA: Complementarity to nonsense triplets and ribosome binding sites. Proc. Natl. Acad. Sci. 71:1342–1346.
- ↵G. SilinsS. GrimmondM. EgertonN. Hayward(1997) Analysis of the promoter region of the human VEGF-related factor gene. Biochem. Biophys. Res. Commun. 230:413–418.
- ↵V.L. SingerC.R. WobbeK. Struhl(1990) A wide variety of DNA sequences can functionally replace a yeast TATA element for transcriptional activation. Genes & Dev. 4:636–645.
- ↵S. SinhaS.N. MaityM.F. SeldinB. de Crombrugghe(1996) Chromosomal assignment and tissue expression of CBF-C/NFY-C, the third subunit of the mammalian CCAAT-binding factor. Genomics 37:260–263.
- ↵S.T. Smale(1997) Transcription initiation from TATA-less promoters within eukaryotic protein coding genes. Biochim. Biophys. Acta. 1351:73–88.
- ↵V. SolovyevA. Salamov(1997) The Gene-Finder computer tools for analysis of human and model organism genome sequences. in Proceedings of the Fifth International Conference on Intelligent Systems for Molecular Biology, eds T. GaasterlandP. KarpK. KarplusC. OuzounisC. SanderA. Valencia(AAAI Press, Menlo Park, CA), pp 294–302.
- ↵L.A. StargellK. Struhl(1996) Mechanisms of transcriptional activation in vivo: Two steps forward. Trends Genet. 12:311–315.
- ↵K. Struhl(1986) Constitutive and inducible Saccharomyces cerevisiae promoters: Evidence for two distinct molecular mechanisms. Mol. Cell Biol. 6:3847–3853.
- ↵M. SuzukiN. Yagi(1994) DNA recognition code of transcription factors in the helix-turn-helix, probe helix, hormone receptor, and zinc finger families. Proc. Natl. Acad. Sci. 91:12357–12361.
- ↵J.V. SwinnenM. EsquenetJ. RosseelsF. ClaessensW. RombautsW. HeynsG. Verhoeven(1996) A human gene encoding daizepam-binding inhibitor/acyl-CoA-binding protein: Transcription and hormonal regulation in the androgen-sensitive human prostatic adenocarcinoma cell line LNCaP. DNA Cell. Biol. 15:197–208.
- ↵G. SzaboZ. KatarovaE. KortvelyR.J. GreenspanZ. Urban(1996) Structure and the promoter region of the mouse gene encoding the 67 kD form of glutamic acid decarboxylase. DNA Cell Biol. 15:1081–1091.
- ↵R. Tjian(1995) Molecular machines that control genes. Sci. Am. 272:54–61.
- ↵A. ToulouseJ. MorinM. PelletierW.E.C. Bradley(1996) Structure of the human retinoic acid receptor β1 gene. Biochim. Biophys. Acta 1309:1–4.
- ↵F. TroncheF. RingeisenM. BlumenfeldM. YanivM. Pontoglio(1997) Analysis of the distribution of binding sites for a tissue-specific transcription factor in the vertebrate genome. J. Mol. Biol. 266:231–245.
- ↵K.-I. TsutsumiK. ItoT. YabukiK. Ishikawa(1993) A1F-B, a novel CCAAT-binding transcription activator that interacts with the aldolase B promoter. FEBS Lett. 321:51–54.
- A. UshevaT. Shenk(1994) TATA-binding protein independent initiation: YY1, TFIIB and RNA polymerase II direct basal transcription on supercoiled template DNA. Cell 76:1115–1121.
- ↵C.P. VerrijzerR. Tjian(1996) TAFs mediate transcriptional activation and promoter selectivity. Trends Biochem. Sci. 21:338–342.
- ↵C.P. VerrijzerK. YokomoriJ.-L. ChenR. Tjian(1994) Drosophila TAFII150: Similarity to yeast gene TSM-1 and specific binding to core promoter DNA. Science 264:933–941.
- ↵E. WahleW. Keller(1996) The biochemistry of polyadenylation. Trends Biochem. Sci. 21:247–250.
- ↵R.O.J. WeinzierlS. RuppertB.D. DynlachtN. TaneseR. Tjian(1993) Cloning and expression of Drosophila TAFII60 and human TAFII70 reveal conserved interactions with other subunits of TFIID. EMBO J. 12:5303–5309.
- S. WiemannB. SteuerA. AlonsoV. KinzelW. Pyerin(1996) Promoter of the gene encoding the bovine catalytic subunit of cAMP-dependent protein kinase isoform Cβ2. Biochim. Biophys. Acta 1309:211–220.
- ↵S.R. WileyR.J. KrausJ.E. Mertz(1992) Functional binding of the “TATA” box binding component of transcription factor TFIID to the -30 region of TATA-less promoters. Proc. Natl. Acad. Sci. 89:5814–5818.
- ↵E. WingenderP. DietzeH. KarasR. Knueppel(1996) TRANSFAC: A database on transcription factors and their DNA binding sites. Nucleic Acids Res. 24:238–241.
- ↵A.P. Wolffe(1994) Architectural transcription factors. Science 264:1100–1101.
- ↵W.E. WrightM. BinderW. Funk(1991) Cyclic amplification and selection of targets (CASTing) for the myogenin consensus binding site. Mol. Cell. Biol. 11:4104–4110.
- ↵K.L. WrightB.J. VilenY. Itoh-LindstromT.L. MooreG. LiM. CriscitielloP. CogswellJ.B. ClarkeJ.P.-Y. Ting(1994) CCAAT box binding protein NF-Y facilitates in vivo recruitment of upstream DNA binding transcription factors. EMBO J. 13:4042–4053.
- ↵W.E. WrightW.D. Funk(1993) CASTing for multicomponent DNA-binding complexes. Trends Biochem. Sci. 18:77–80.
- ↵J. YooR.T. StoneS.M. KappesS.S. ToldoR. FriesC.W. Beattie(1996) Genomic organization and chromosomal mapping of the bovine FAS/APO-1 gene. DNA Cell Biol. 15:377–385.
- ↵C.-H. YuhE.H. Davidson(1996) Modular cis-regulatory organization of Endo16, a gut-specific gene of the sea urchin embryo. Development 122:1069–1082.
- ↵Y.-Y. ZhaoP. QasbaM.A.Q. SiddiquiA. Kumar(1993) Multiple CCAAT binding proteins regulate the expression of the angiotensinogen gene. Cell. Mol. Biol. Res. 39:727–737.