
Abstract
Genome-wide association studies (GWAS) have become the primary approach for identifying genes with common variants influencing complex diseases. Despite considerable progress, the common variations identified by GWAS account for only a small fraction of disease heritability and are unlikely to explain the majority of phenotypic variations of common diseases. A potential source of the missing heritability is the contribution of rare variants. Next-generation sequencing technologies will detect millions of novel rare variants, but these technologies have three defining features: identification of a large number of rare variants, a high proportion of sequence errors, and a large proportion of missing data. These features raise challenges for testing the association of rare variants with phenotypes of interest. In this study, we use a genome continuum model and functional principal components as a general principle for developing novel and powerful association analysis methods designed for resequencing data. We use simulations to calculate the type I error rates and the power of nine alternative statistics: two functional principal component analysis (FPCA)–based statistics, the multivariate principal component analysis (MPCA)–based statistic, the weighted sum (WSS), the variable-threshold (VT) method, the generalized T2, the collapsing method, the CMC method, and individual  tests. We also examined the impact of sequence errors on their type I error rates. Finally, we apply the nine statistics to the published resequencing data set from ANGPTL4 in the Dallas Heart Study. We report that FPCA-based statistics have a higher power to detect association of rare variants and a stronger ability to filter sequence errors than the other seven methods.
Testing the phenotypic association of millions of individual SNPs across the genome has become the primary approach for identifying genes having common variants influencing complex diseases (Frazer et al. 2009; Hindorff et al. 2009). To date, hundreds of putative disease gene loci have been identified by genome-wide association studies (GWAS). Despite this progress, these newly discovered loci typically account for only a small fraction of disease heritability. This implies that individual common variations identified by GWAS are unlikely to explain the majority of phenotypic variance on disease susceptibility (Schork et al. 2009). A potential source of the majority of missing heritability is the contribution of rare variants (Cohen et al. 2006; Ji et al. 2008; Marini et al. 2008; Manolio et al. 2009; Nejentsev et al. 2009; Zhu et al. 2010). As an alternative to the popular common disease common variants (CDCV) hypothesis, it may be possible that common diseases in the population at large are influenced by numerous rare or low-frequency variants with large effects on disease risk (CDRV). Recently, Dickson et al. (2010) proposed that the association of common alleles identified by GWAS could come from the effect of rare alleles and their association with common marker alleles.
Next-generation sequencing technologies have the potential to discover the entire spectrum of sequence variations in a sample of well-phenotyped individuals. Despite their promise, next-generation sequencing platforms also present challenges. First, the error rate of these platforms is higher than conventional sequencing methods, and many errors are not random events (Johnson and Slatkin 2008; Chaisson et al. 2009; Lynch 2009; Bansal et al. 2010a). These errors may be frequent enough to obscure true associations or systematic enough to generate false-positive associations. Second, the data produced by next-generation sequencing technologies also have a high rate of missing data (Pool et al. 2010). Although imputation may be useful for common and low-frequency variants, it is likely to be dubious for truly rare variants. In some cases, the signal we seek consists of a single variant in a single individual, where imputation will be of no use.
Traditional statistical methods testing the association of common alleles with common disease have mainly focused on the serial investigation of individual variants. These methods are ill-suited for large amounts of allelic heterogeneity present in sequence data (Gorlov et al. 2008) and do not account for sequencing errors or handle large amounts of missing data without imputation. Group tests that record rare sequence variants at different genomic positions and collectively test association have recently been proposed (Li and Leal 2008; Madsen and Browning 2009; Bansal et al. 2010b; Li et al. 2010; Price et al. 2010). Although, in some cases, group tests have higher power than the individual tests, they also suffer limitations. First, group tests ignore differences in genetic effects among SNPs at different genomic locations. Second, group tests do not leverage linkage disequilibrium (LD) in the data. And third, since sequence errors are cumulative when rare variants are grouped, some group tests are sensitive to genotyping errors and missing data.
Recently developed functional data analysis techniques (Ramsay and Silverman 2005) are ideally suited for association studies using next-generation sequencing data. It has been shown that the number of rare alleles in large samples is approximately distributed as a Poisson process with its intensity depending on the total mutation rate (Joyce and Tavare 1995). The intensity of the Poisson process within a genomic region can be interpreted as a function of the genomic location. A collection of genetic variants for each individual can be viewed as a realization of the Poisson process. To jointly test the association of multiple variants thus can be transformed to test the equality of two random functions or processes between cases and controls. However, we do not need to assume that the number of rare variants strictly follow the Poisson process. The purpose of this study is to use functional data analysis techniques to develop statistics for testing the phenotypic association of rare variants with high power, nominal type I error rates and the ability to buffer the impact of sequencing errors and missing data. A program for implementing the developed statistics can be downloaded from our website, http://www.sph.uth.tmc.edu/hgc/faculty/xiong/index.htm.
Methods
Model
Let  be the position of a genetic variant along a chromosome or within a genomic region and
  be the length of the genomic region being considered. For convenience, we rescale the region
  to
to  . Because the density of genetic variants is high, we can view
  as a continuous variable in the interval
  . Although the variants are discretely located along the chromosomes, the map of variants from next-generation sequencing is very dense. When the genomic region is scaled into the interval of [0,1], the genomic location parameter of the variants can be approximately viewed as a real continuous number. The model that considers a chromosome as a continuum is defined as the genome continuum model (Bickeboller and Thompson 1996). Assume that
  cases and
  controls are sampled and sequenced.
We define the genotype of the ith case as
 . We can define a similar function
  for the ith control. Throughout this study, functions
  and
and  in which genomic information is recorded at multiple variant sites are referred to as “genetic variant functions.” The genetic variant functions can also be defined by recording the allele status of the individual at the site. We can also view the product of the value of the genetic variant function and the probability of the variant site being functional as a genetic variant function. We also can incorporate prior biological information into the definition of genetic variant functions. The definition of genetic variant function is very flexible.
Defining functional principal component analysis for genetic variant data
Similar to principal component analysis (PCA) for multivariate data where we consider a linear combination of variables to capture the variations contained in the entire data, we can consider a linear combination of functional values:
 is a weight function and
  is a centered genotype function defined in Equation 1. To capture the genetic variations in the genotype function, we chose the weight function
  to maximize the variance of
  . By the formula for the variance of stochastic integral (Henderson and Plaschko 2006), we have:
 is the covariance function of the genotype function
  . Since multiplying
  by a constant will not change the maximizer of the variance,
  , we impose a constraint to make the solution unique:
Therefore, to find the weight function, we seek to solve the following optimization problem:
By the Lagrange multiplier, we reformulate the constrained optimization problem (5) into the following nonconstrained optimization problem:

 is a parameter.
By variation calculus (Struwe 1990), the weight function  that solves the problem (6) should satisfy the following integral equation:
 . The left side of the integral Equation 7 defines an integral transform
  of the weight function
  . Therefore, the integral transform of the covariance function
  is referred to as the covariance operator
  . The integral Equation 7 can be rewritten as:
 is an eigenfunction and referred to as a principal component function. Equation 8 is also referred to as an eigenequation. Clearly, the eigenequation 8 looks the same as the eigenequation for the multivariate PCA if the covariance operator and eigenfunction are replaced by a covariance matrix and eigenvector.
Since the number of function values is theoretically infinite, we may have an infinite number of eigenvalues. Provided the functions  and
and  are not linearly dependent, there will be only
  nonzero eigenvalues, where
  is the total number of sampled individuals (
 ). Eigenfunctions satisfying the eigenequation are orthonormal (Ramsay and Silverman 2005). In other words, Equation 8 generates a set of principal component functions:

These principal component functions satisfy:
The principal component function  with the largest eigenvalue is referred to as the first principal component function, and the principal component function
  with the second largest eigenvalue is referred to as the second principal component function, etc.
Computations for the principal component function and the principal component score
The eigenfunction is an integral function and difficult to solve in closed form. A general strategy for solving the eigenfunction problem in Equation 8 is to convert the continuous eigen-analysis problem to an appropriate discrete eigen-analysis task (Ramsay and Silverman 2005). FPCA methods effectively pool data across individuals to estimate the covariance functions, eigenfunctions, and functional principal component scores by nonparametric techniques that will use the correlation feature among the variants to maximize the available information. Unlike the multivariate principal component analysis (MPCA), the FPCA methods can be applied to sparse and irregularly spaced genomic variants data. They will not assume that each person should have at least two rare variants directly contributing to diseases.
In this study, we separately use discretization and basis function expansion methods to achieve this conversion. As is discussed below, these two methods are not the same, and one or the other may be more appropriate in specific situations. To help readers to understand FPCA easier, we briefly introduce these methods.
Discretization method
In practice, the available genetic variants occur at discrete genomic positions. Assume that in a genomic region there are  variable loci, which are indexed as
  . For the ith individual, the observed genetic variants can be expressed as
  . The covariance function
  at these loci can be written as a matrix:
Let  The principal component function
  at
at  loci is a vector and is written as
  . By methods for numerical integration, the integral Equation 8 can be converted to an ordinary matrix eigenequation. For each
  , we have:

Then, Equation 8 has the approximate discrete form:

 .
.Let  Then, Equation 11 can be reduced to:

Equation 12 is the usual eigenequation from multivariate analysis. Compute the eigenvalues  and eigenvectors
  of
of  . Then,
  and
and  are a pair of discrete eigenfunctions and eigenvalues, respectively, of the original functional eigenequation (8).
Basis function expansion method
Another method for solving the functional eigenequation (8) is to expand  as a linear combination of the basis function
  :
:
Define the vector-valued function  and the vector-valued function
  . The joint expansion of all N genetic variant profiles can be expressed as:

In matrix form we can express the variance–covariance function of the genetic variant profiles as:
Similarly, the eigenfunction  can be expanded as:


 . Substituting expansions 15 and 16 of the variance–covariance R(s,t) and the eigenfunction
  into the functional eigenequation (8), we obtain:
The normalization condition  implies that:

Let  . Then, the eigenequation (17) and normalization condition (18) can be reduced to:

Solving the multivariate eigenvalue and eigenvector problems in Equation 19 will yield the eigenvalue  and eigenvector
  . Then, the eigenfunction
  is finally given by:

If the basis functions  are orthonormal, then
  , the identity matrix.
Test statistic
We use the pooled genetic variant profiles  of cases and
  of controls to estimate the principal component function
  using the discretization or basis expansion methods. By the Karhunen-Loéve expansion (Yao et al. 2005),
  and
and  can be expressed as:

 and
and  are uncorrelated random variables with zero mean and variances
  with
with  . Define the averages
  and
and  of the principal component scores
  and
and  in the cases and controls. Then, the statistic for testing the association of a genomic region with disease is defined as:
Under the null hypothesis of no association of the genomic region, the test statistic  is asymptotically distributed as a central
  distribution.
Results
Null distribution of test statistics
When the sample size is large, the distribution of the test statistic  for testing the association of the genomic region with a trait of interest is distributed under the null hypothesis of no association as a central
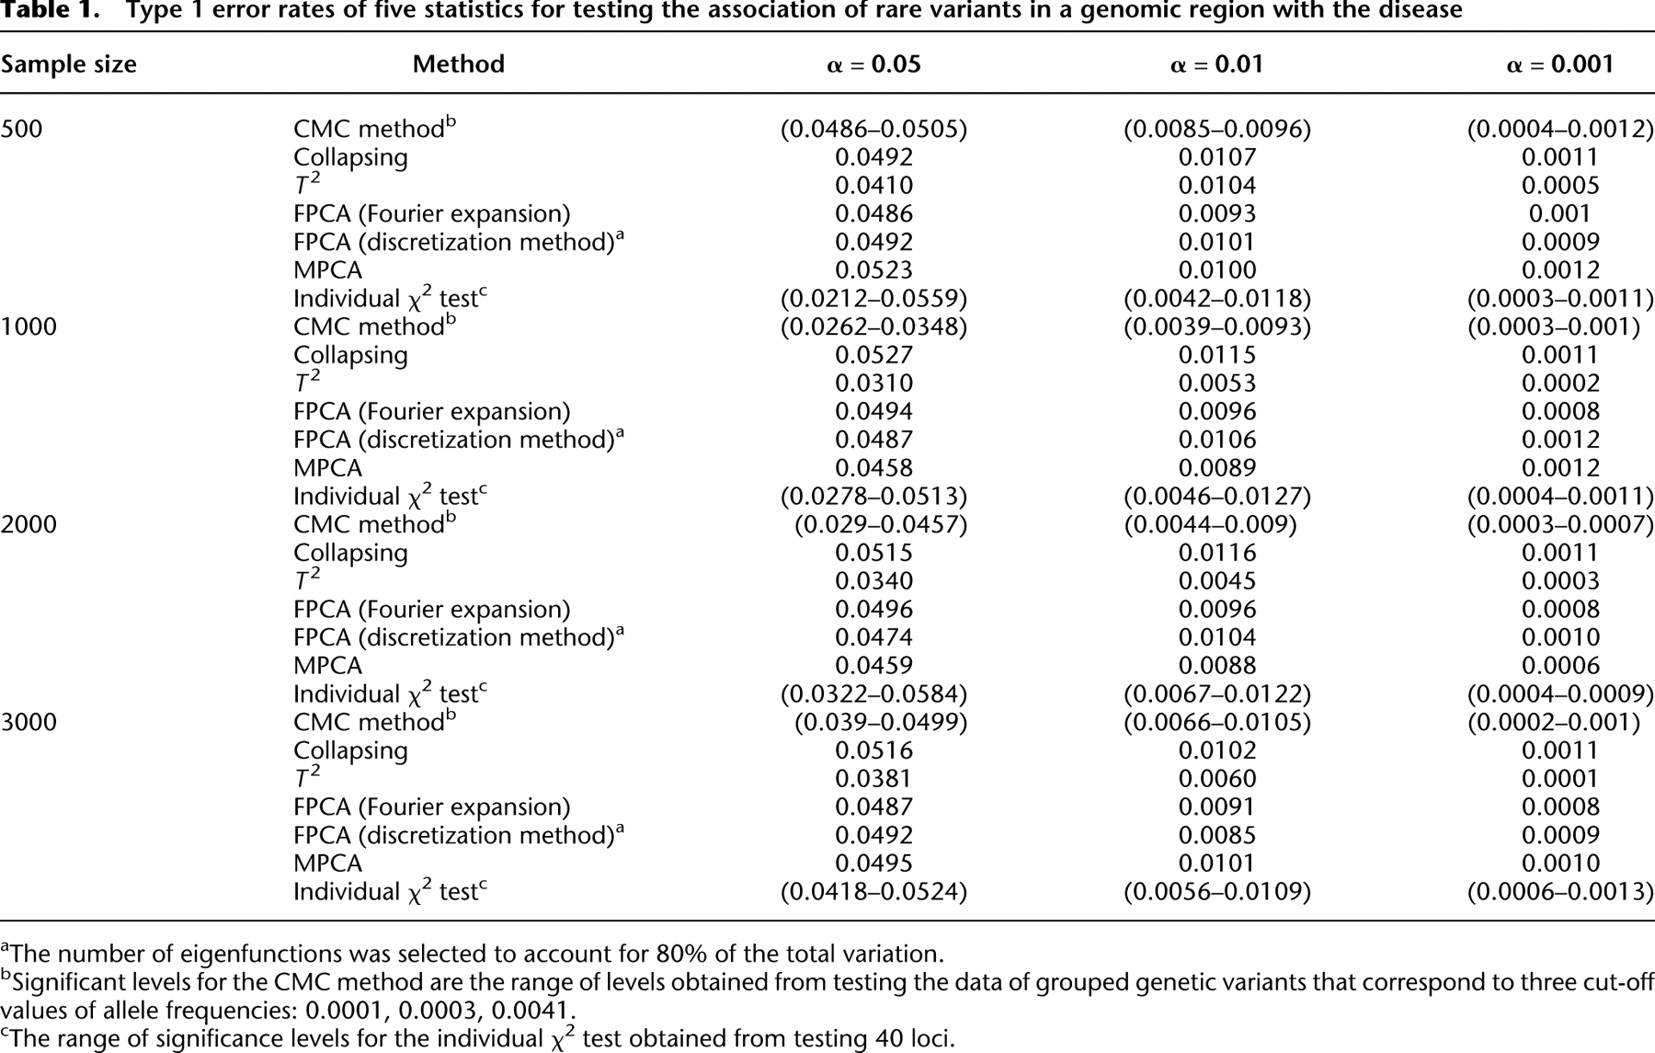
  distribution, where K is the number of functional principal components used in the test. To examine the validity of this statement, we performed a series of simulation studies. We used the MS software (Hudson 2002) to generate a population of 1 million chromosomes each with 100 variable loci under a neutrality model. Forty of the loci had a minor allele frequency (MAF) between 0.0001 and 0.036, and these were used to calculate the type I error rates under the null hypothesis. The number of individuals ranged from 500 to 3000, each with two chromosomes, and each individual was assigned with an equal probability of being a case or a control. Each data set was analyzed using the methods described above, and 10,000 data sets were generated.
Table 1 summarizes the type I error rates of the statistics  , the multivariate PCA-based statistic (MPCA), Hotelling's
  test, the collapsing
  test, the CMC method, and the individual
  test for each locus with sample sizes 500, 1000, 2000, and 3000. For the
  , both the discretization method and the basis function expansion method are provided. Table 1 shows that the estimated type I error rates of the FPCA-based statistics
  and the collapsing test were, in general, not appreciably different from the expected nominal levels
  ,
,  , and
, and  . However, the type I error rates of the CMC method, the generalized
  test, and the individual
  test showed large deviations from the expected nominal levels.
Type 1 error rates of five statistics for testing the association of rare variants in a genomic region with the disease
Impact of genotyping errors on the tests
The error rates for the new generation of sequencing technologies are higher than traditional Sanger sequencing (Harismendy et al. 2009). Variants caused by sequencing errors may bias available genotype–phenotype association tests. Investigating the impact of sequencing errors on association analyses will provide guidance for developing robust statistics for association tests. For simplicity, we assumed that the genotyping error rate for common alleles (frequencies  0.05) and rare variants (frequencies <0.05) ranges from
  to
to  and from
  to 0.01, respectively. We generated 500 cases and 500 controls, with each individual having genotype data at 100 loci with MAF ranging from 0.0001 to 0.036 within a defined genomic region. As in the above case, 10,000 sample sets were generated. Table 2 provides the type I error rates for each test in the presence of the variant genotype error rate where the number of eigenfunctions was selected to account for 80% of the total variation and three cut-off values of allele frequencies: 0.0001, 0.0003, and 0.0041 were taken for the CMC method.
Impact of sequencing errors on the type 1 error rates of the test
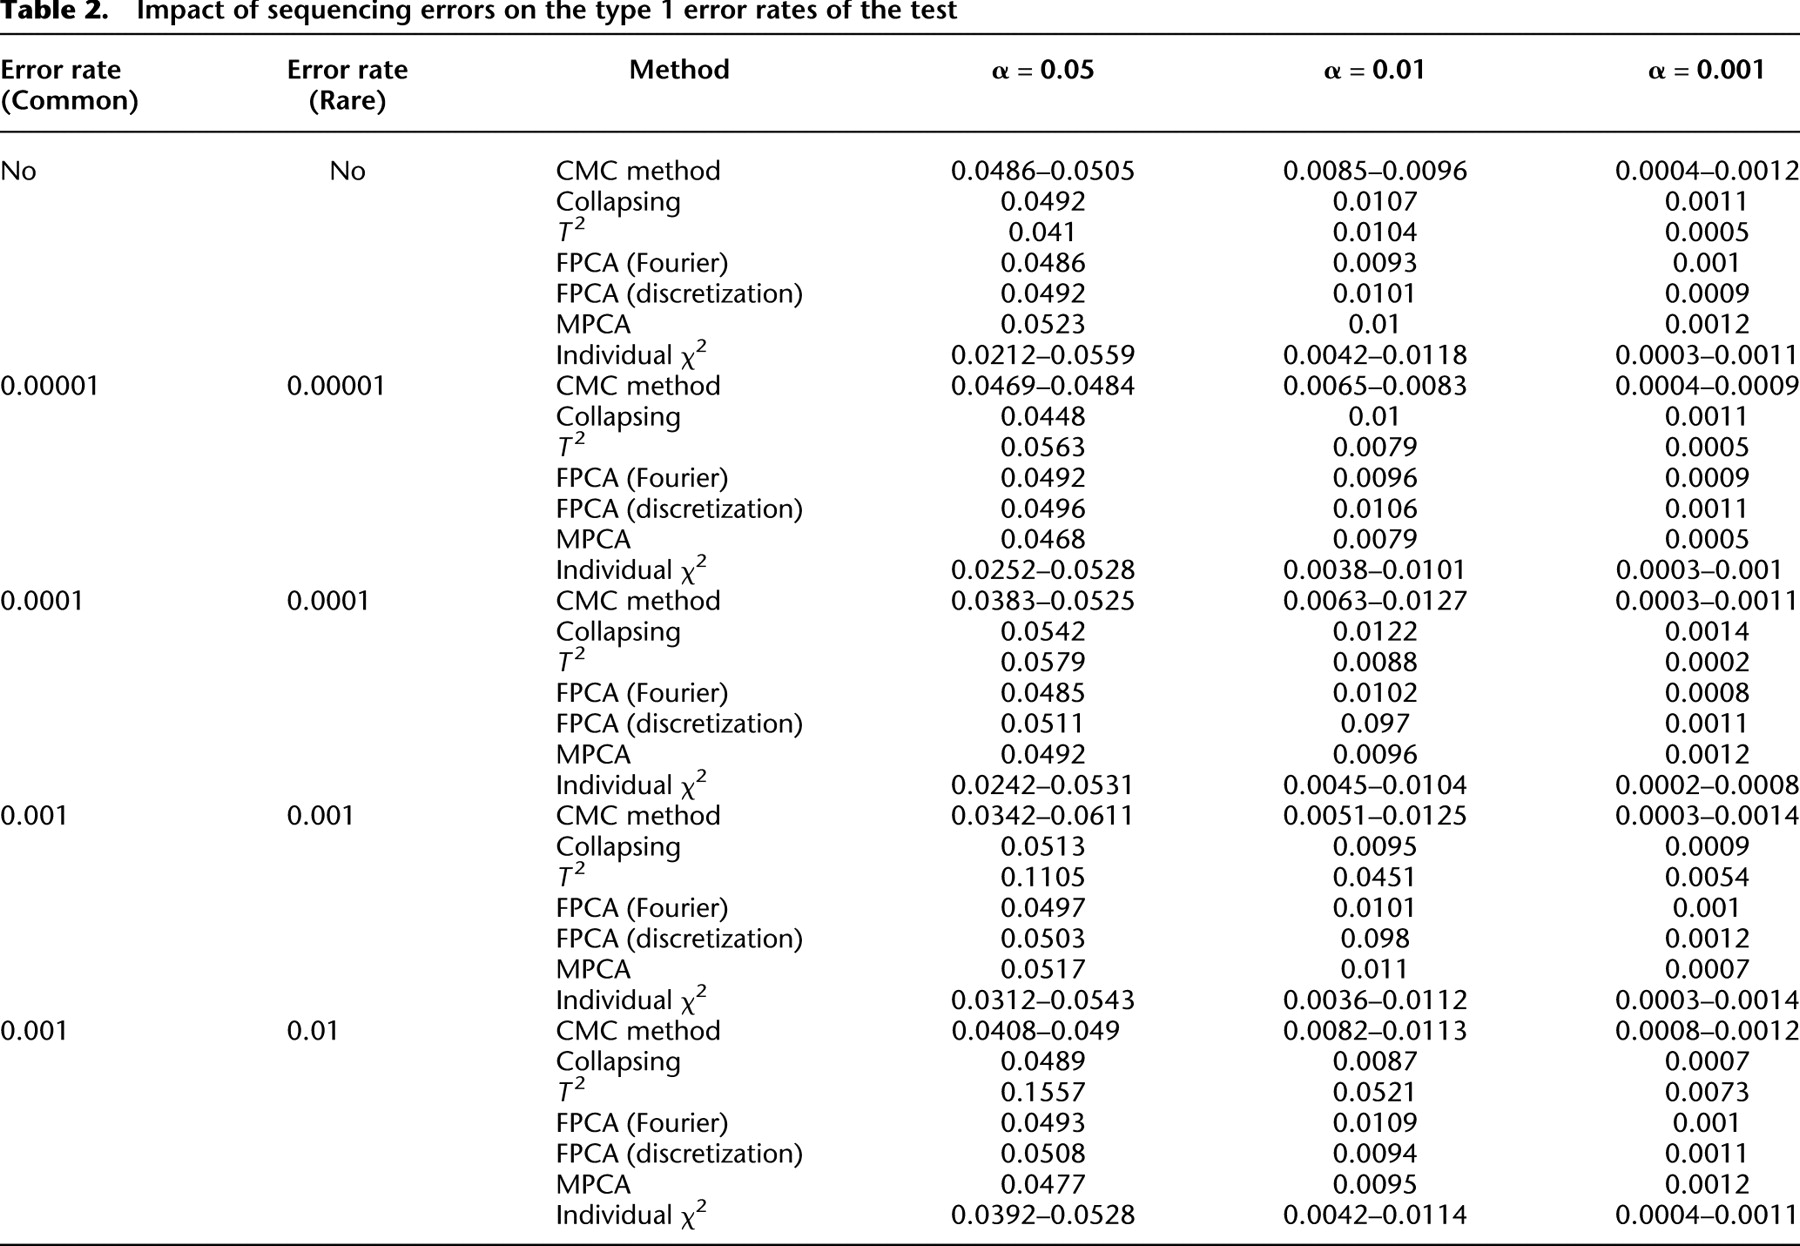
These errors led to no significant deviation of the type I error rates of the FPCA-based statistics  , the MPCA-based statistics, and the collapsing method from the expected nominal levels. However, we observed that sequencing errors, indeed, inflated the type I error rates of the CMC method, the generalized
  test, and the single marker test. Table 2 strongly suggests that the FPC-based statistics are insensitive to the genotyping errors.
Power evaluation
To evaluate the performance of the FPCA-based statistics for testing the association of a set of rare variants with disease, we used simulated data to estimate their power to detect a true association. We considered four disease models: additive, dominant, recessive, and multiplicative. To mimic the distribution of rare variants in a natural population, we used the July 2010 release of genotype data of the gene “CoL6A3” from 90 non-Hispanic white (CEU) individuals in the exon pilot study of the 1000 Genomes Project (http://www.1000genomes.org/). Based on these data, we included 22 rare variants with frequencies <0.05. The frequencies of the 22 variants are summarized in Supplemental Table 1.
CoL6A3 haplotypes were inferred from genotype data using phase 2.0 (Stephens and Donnelly 2003). A population of 2 million haplotypes was generated by sampling from 180 inferred haplotypes with replacement. Two haplotypes were randomly sampled from the population and assigned to an individual.
An individual's disease status was determined based on the individual's genotype and the penetrance for each locus. Let  be a rare risk allele at the ith locus. Let
  be the genotypes
  ,
,  , and
, and  , respectively, and
  be the penetrance of genotypes
  at the ith locus. The relative risk (RR) at the ith locus is defined as
  and
and  , where
  is the baseline penetrance of the wild-type genotype at the ith variant site. We assume that for the additive disease model,
  ; for the dominant disease model,
  ; for the recessive disease model,
  ; and for the multiplicative disease model,
  . The genotype relative risk was assumed to be inversely proportional to MAF, where the population attributable risk (PAR) of each group was assumed to be 0.005 (Li et al. 2010). We assumed that the relative risks across all variant sites are equal and that the variants influence disease susceptibility independently (i.e., no epistasis). Each individual was assigned to the group of cases or controls depending on their disease status. The process for sampling individuals from the population of 2 million haplotypes was repeated until the desired samples were reached for each disease model.
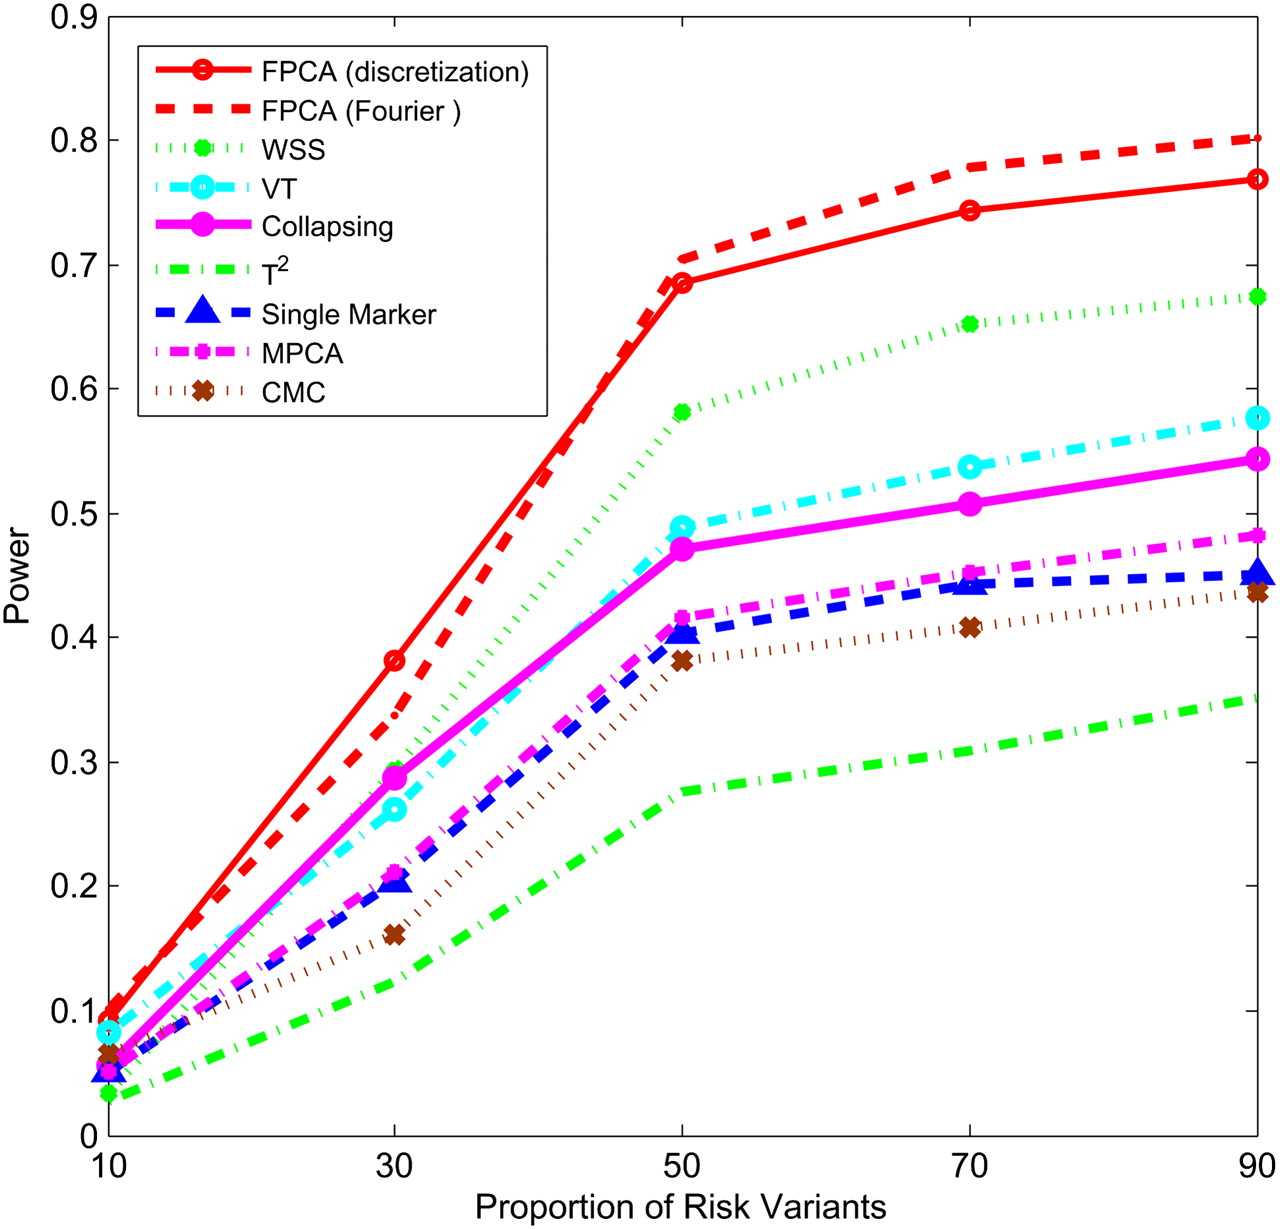
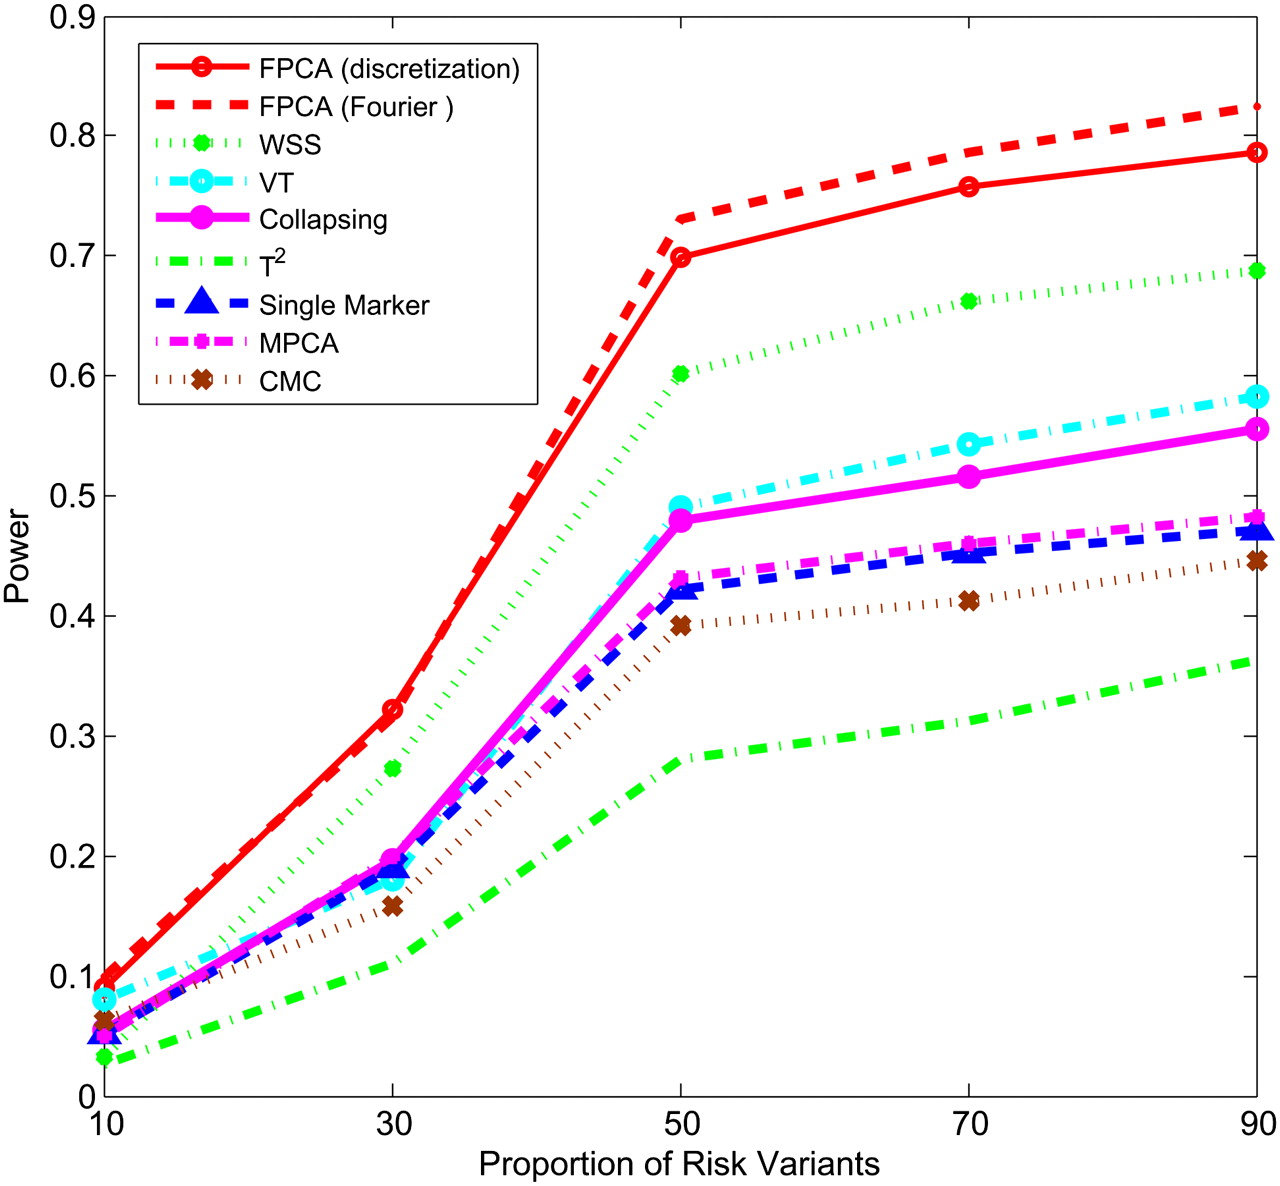
Figures 1–4 plot the power curves of nine statistics: FPCA-discretization, FPCA-Fourier expansion, weighted sum statistic (WSS), variable threshold (VT), multivariate principal component (MPC)–based statistic, collapsing method, generalized  statistic, single marker
  test where permutation was used to adjust for multiple testing, and the CMC method (variants with frequencies
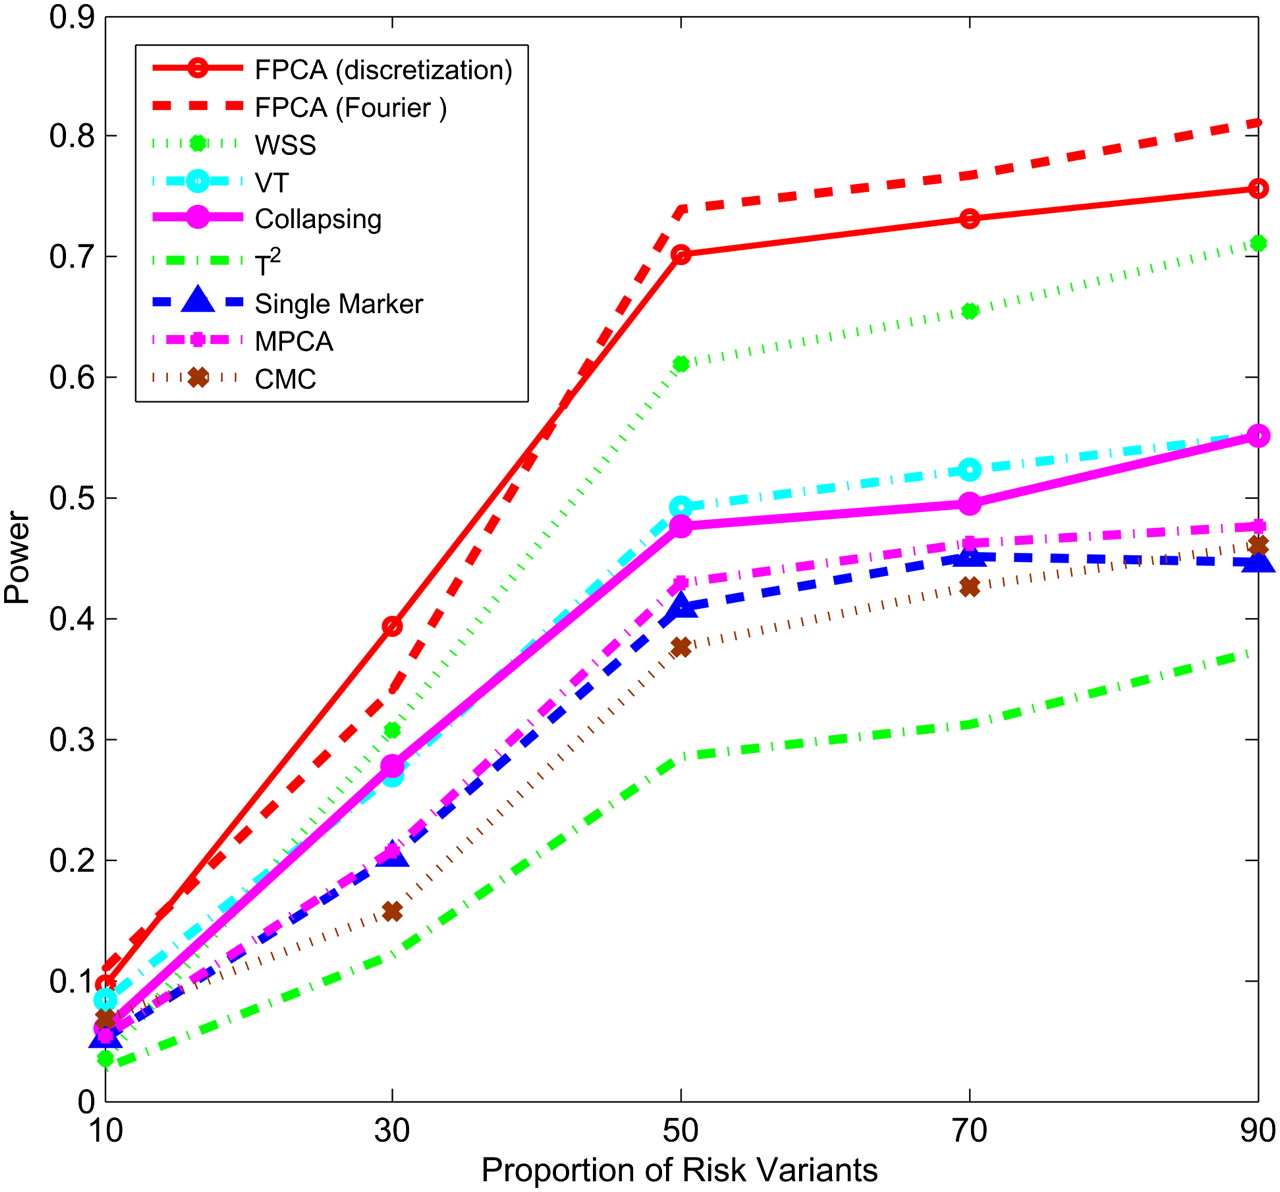
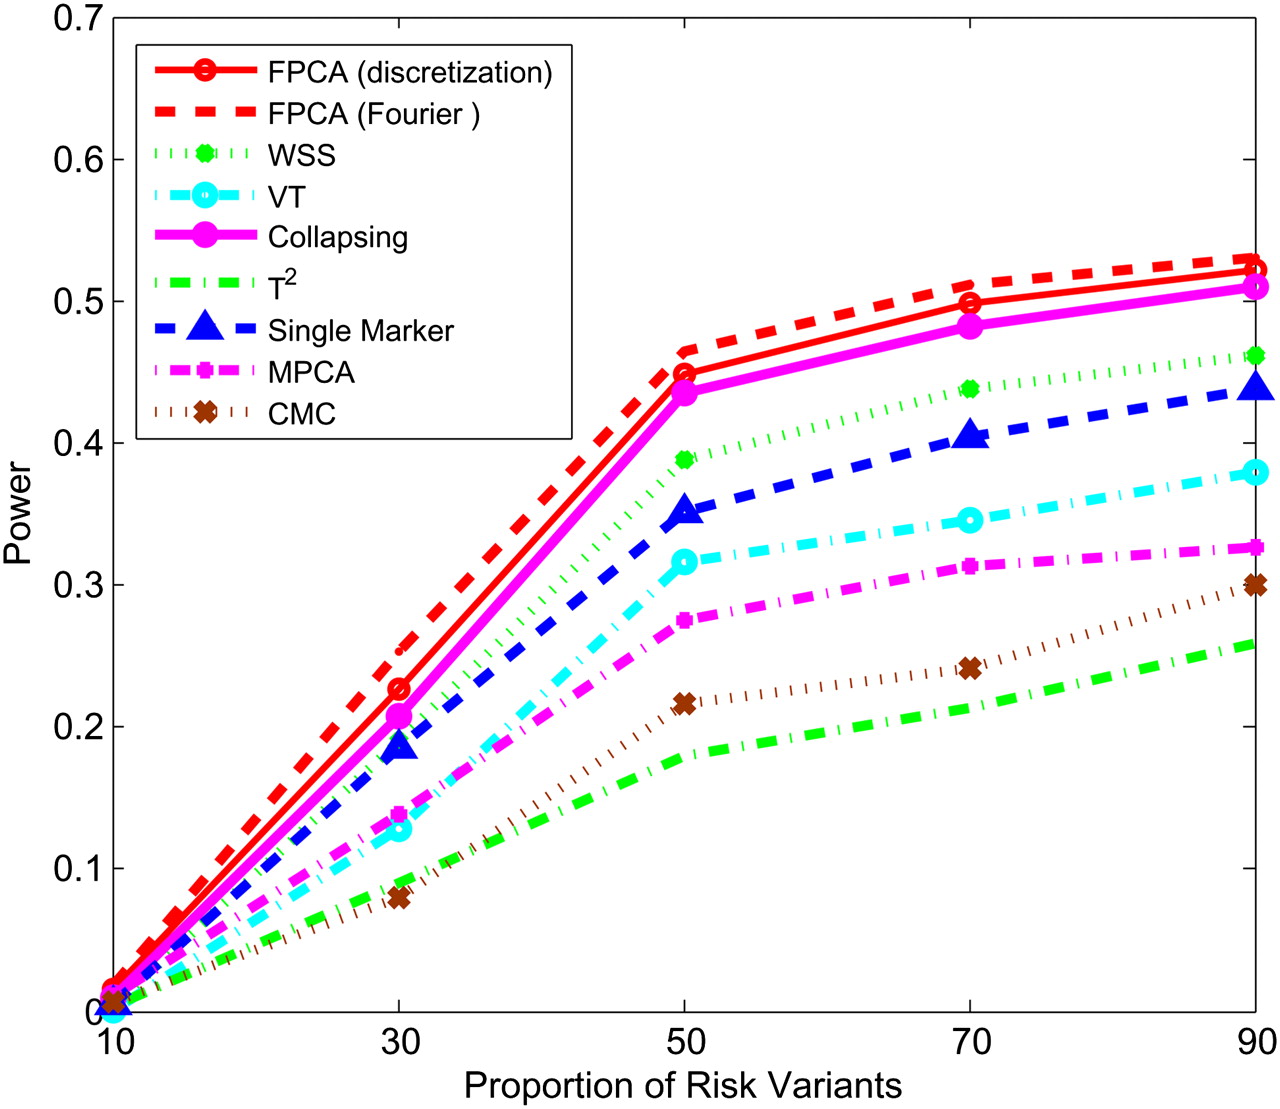
  0.005 were collapsed) as a function of the proportion of risk-increasing variants for testing the association of 22 rare variants with disease under additive, dominant, multiplicative, and recessive disease models, assuming a baseline penetrance of 0.01. The FPCA-based statistics had the highest power followed by WSS and VT under the additive, dominant, and multiplicative disease models. Under the recessive model, the collapsing method will have higher power than the WSS and VT statistics. The explanation for this observation is that each individual in cases under the recessive model may just have a few risk-increasing variants collapsing then will not lose much information. The generalized
  and CMC methods under all disease models have the lowest power to detect association of rare variants. When the PAR is assumed a constant, the number of risk-increasing variants determines the marginal PAR of each variant in the group. From these figures, we can see that the power of all nine statistics is an increasing function of the proportion of risk variants.
Power of nine statistics: FPCA (discretization approach)–based statistics, FPCA (Fourier expansion approach)–based statistic, multivariate PC–based statistic, WSS, VT, collapsing method, generalized T2 statistic, single marker χ2 test, and CMC method (the variants with frequencies ≤ 0.005 were collapsed) as a function of proportion of risk-increasing variants for testing association of 22 rare variants with the disease under the additive disease model, assuming baseline penetrance of 0.01, 2000 cases, and 2000 controls.
Power of nine statistics: FPCA (discretization approach)–based statistics, FPCA (Fourier expansion approach)–based statistic, multivariate PC–based statistic, WSS, VT, collapsing method, generalized T2 statistic, single marker χ2 test, and CMC method (the variants with frequencies ≤ 0.005 were collapsed) as a function of proportion of risk-increasing variants for testing association of 22 rare variants with the disease under the dominant disease model, assuming baseline penetrance of 0.01, 2000 cases, and 2000 controls.
Power of nine statistics: FPCA (discretization approach)–based statistics, FPCA (Fourier expansion approach)–based statistic, multivariate PC–based statistic, WSS, VT, collapsing method, generalized T2 statistic, single marker χ2 test, and CMC method (the variants with frequencies ≤ 0.005 were collapsed) as a function of proportion of risk-increasing variants for testing association of 22 rare variants with the disease under the multiplicative disease model, assuming baseline penetrance of 0.01, 2000 cases, and 2000 controls.
Power of nine statistics: FPCA (discretization approach)–based statistics, FPCA (Fourier expansion approach)–based statistic, multivariate PC–based statistic, WSS, VT, collapsing method, generalized T2 statistic, single marker χ2 test, and CMC method (the variants with frequencies ≤ 0.005 were collapsed) as a function of proportion of risk-increasing variants for testing association of 22 rare variants with the disease under the recessive disease model, assuming baseline penetrance of 0.01, 3000 cases, and 3000 controls.
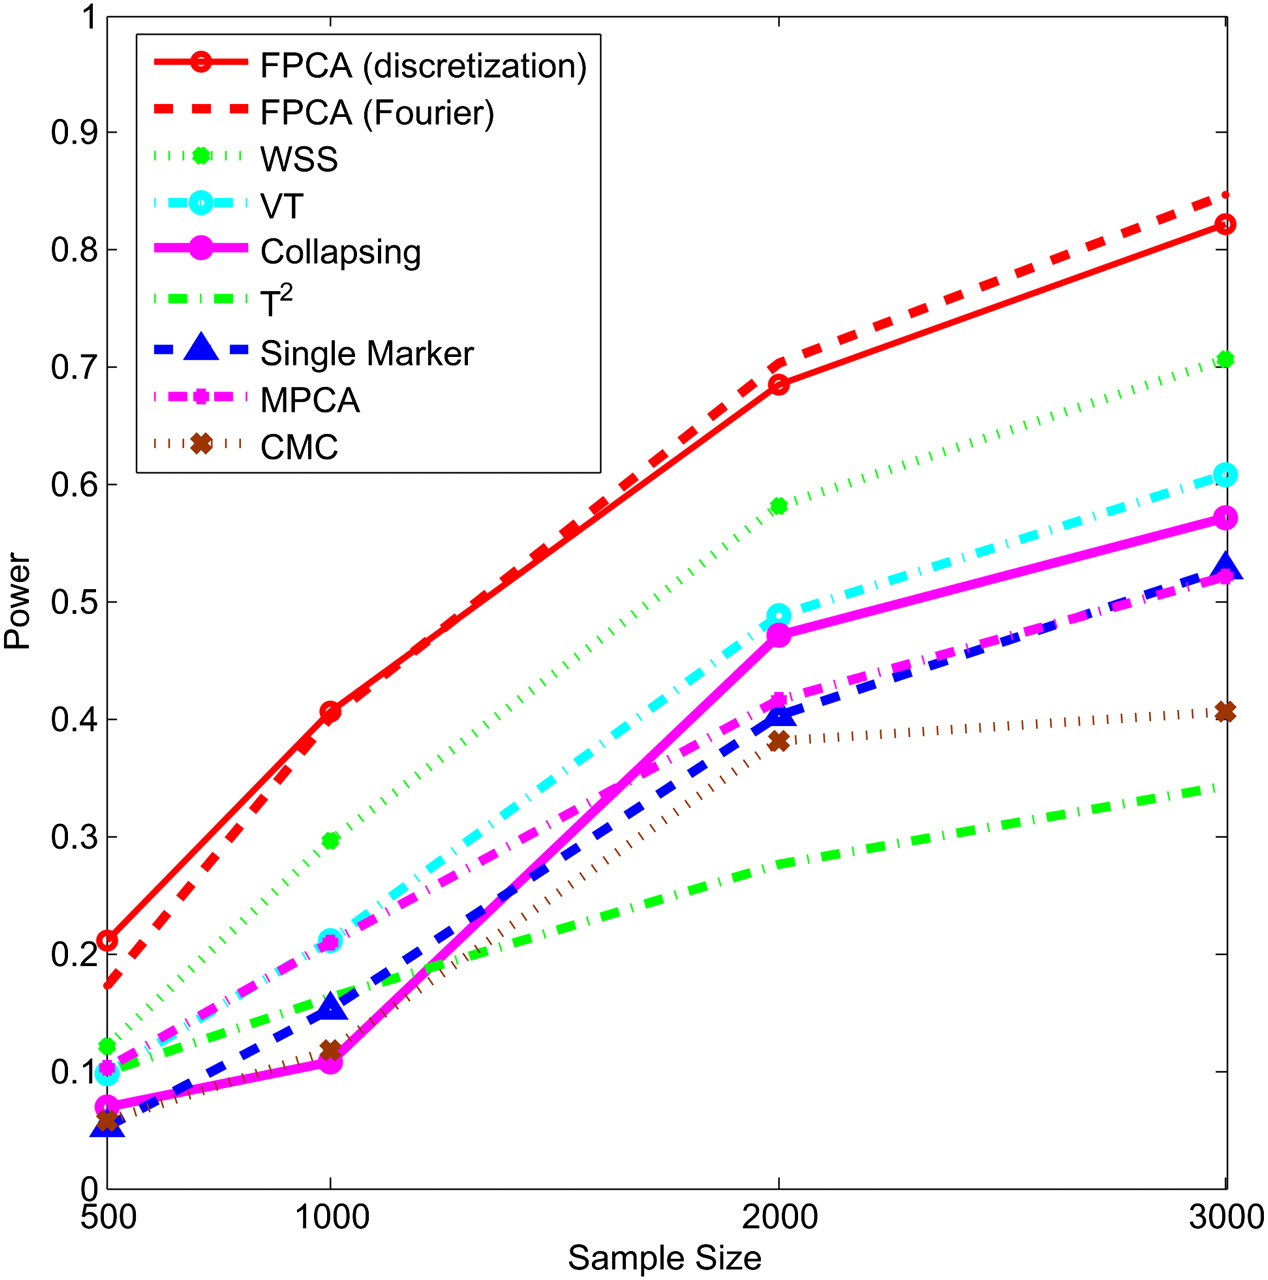
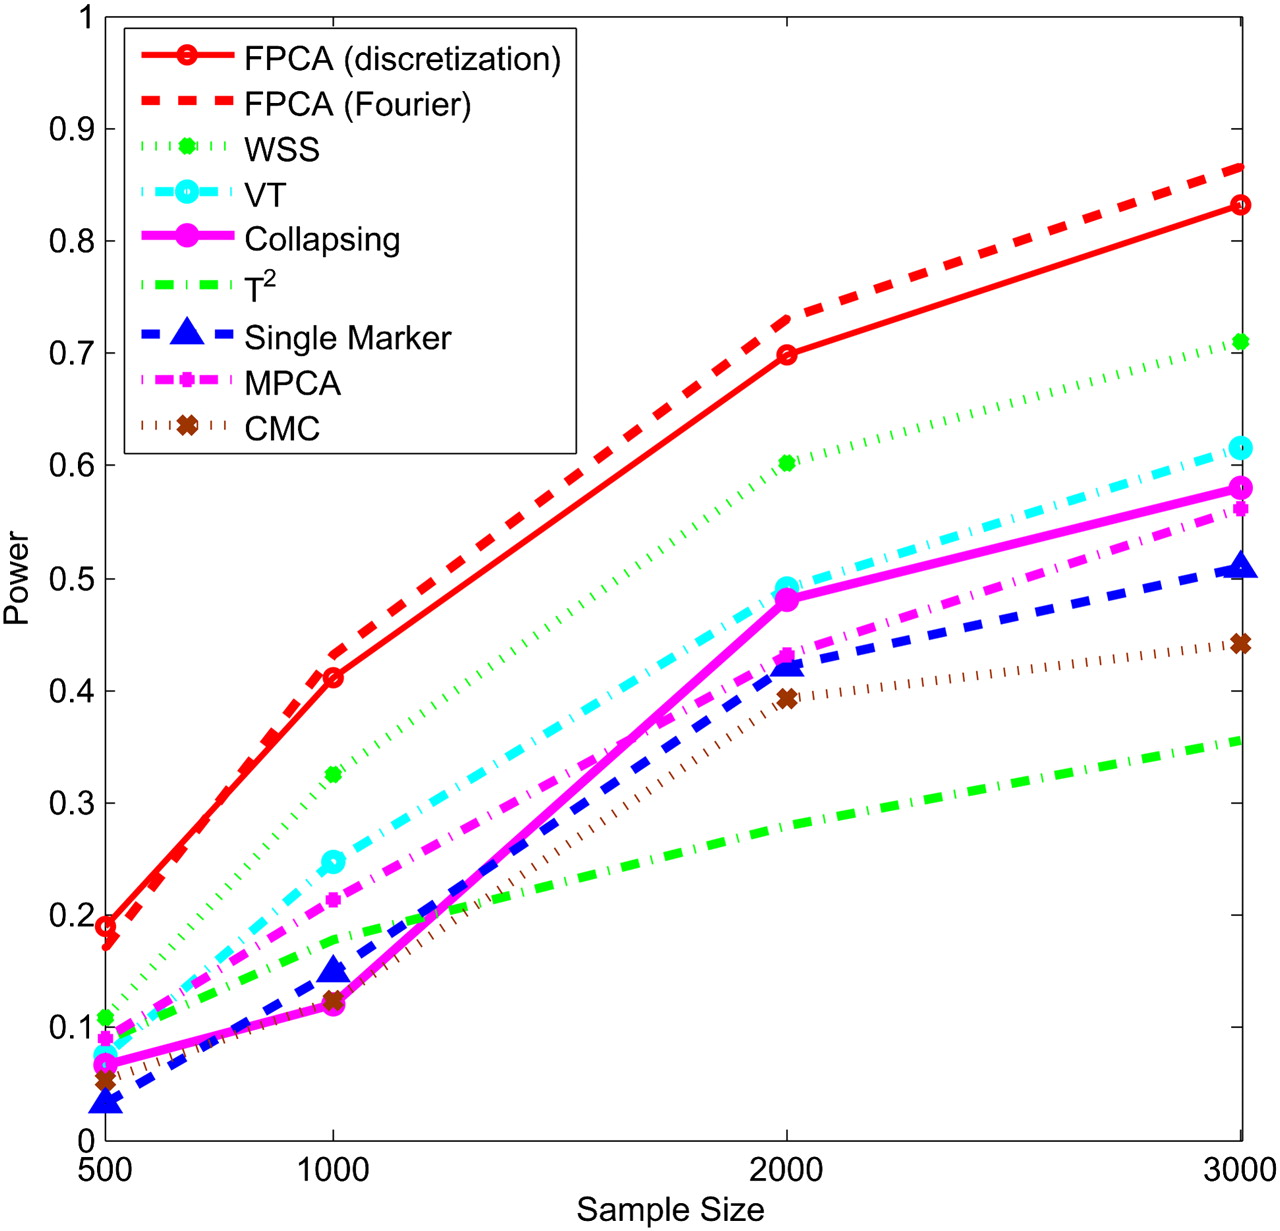
Next, we study the impact of the sample sizes on the power. We assume that half of the 22 rare variants were risk-increasing variants under the additive, dominant, and multiplicative models, and 70% of the 22 rare variants were risk variants under the recessive model. Figures 5–8 show the power of the above nine statistics as a function of sample sizes. Similar to Figures 1–4, we observed that the FPCA-based statistics had the highest power in all cases. Differences in the power between the FPCA-based statistics and the seven other statistics increased as the sample sizes increased except for the collapsing method under the recessive model. We also observed that most of the time the power of FPCA by expansion is higher than that of FPCA by the discretization method, although their difference is small.
Power of nine statistics: FPCA (discretization approach)–based statistics, FPCA (Fourier expansion approach)–based statistic, multivariate PC–based statistic, WSS, VT, collapsing method, generalized T2 statistic, single marker χ2 test, and CMC method (the variants with frequencies ≤ 0.005 were collapsed) as a function of sample sizes for testing association of 22 rare variants, half of which were risk-increasing variants, with the disease under the additive disease model, assuming baseline penetrance of 0.01.
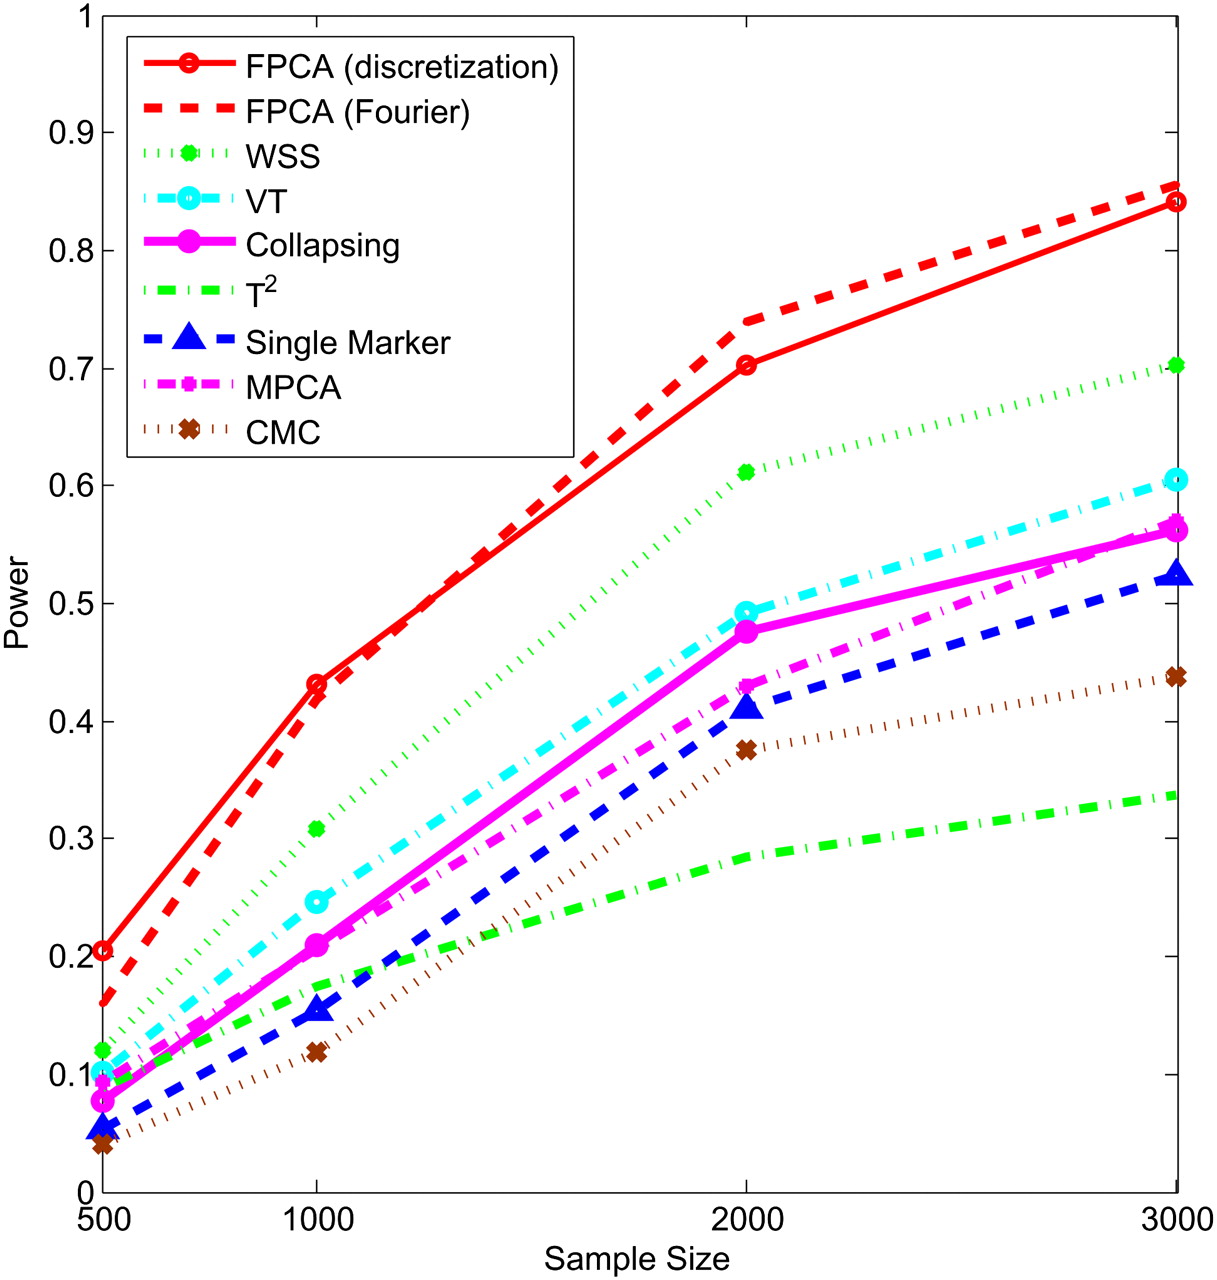
Power of nine statistics: FPCA (discretization approach)–based statistics, FPCA (Fourier expansion approach)–based statistic, multivariate PC–based statistic, WSS, VT, collapsing method, generalized T2 statistic, single marker χ2 test, and CMC method (the variants with frequencies ≤ 0.005 were collapsed) as a function of sample sizes for testing association of 22 rare variants, half of which were risk-increasing variants, with the disease under the dominant disease model, assuming baseline penetrance of 0.01.
Power of nine statistics: FPCA (discretization approach)–based statistics, FPCA (Fourier expansion approach)–based statistic, multivariate PC–based statistic, WSS, VT, collapsing method, generalized T2 statistic, single marker χ2 test, and CMC method (the variants with frequencies ≤ 0.005 were collapsed) as a function of sample sizes for testing association of 22 rare variants, half of which were risk-increasing variants, with the disease under the multiplicative disease model, assuming baseline penetrance of 0.01.
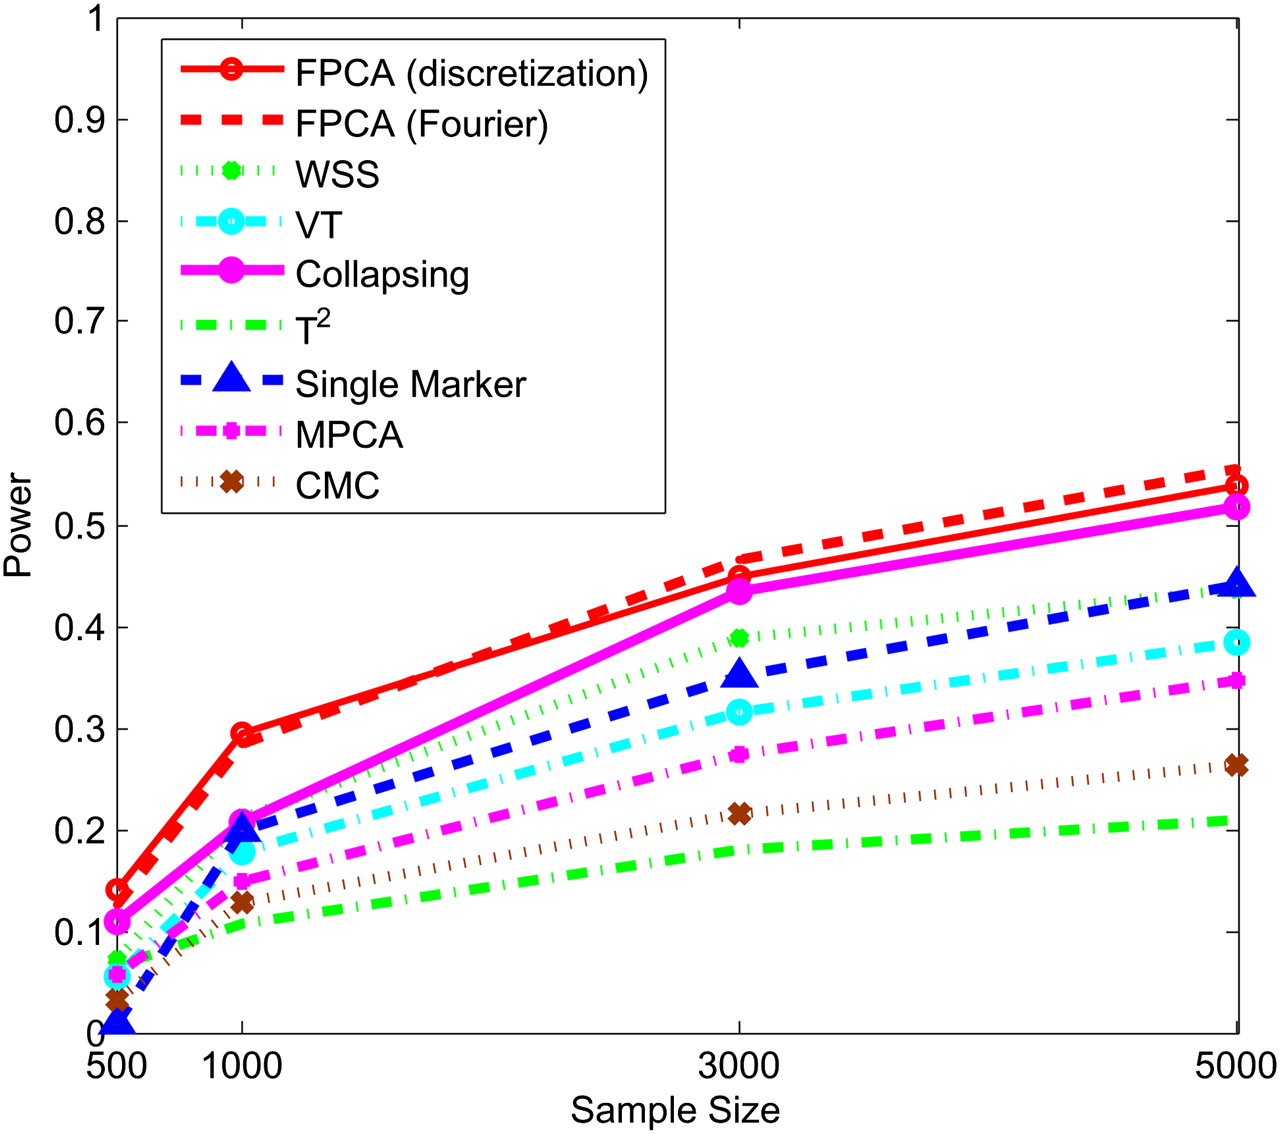
Power of nine statistics: FPCA (discretization approach)–based statistics, FPCA (Fourier expansion approach)–based statistic, multivariate PC–based statistic, WSS, VT, collapsing method, generalized T2 statistic, single marker χ2 test, and CMC method (the variants with frequencies ≤ 0.005 were collapsed) as a function of sample sizes for testing association of 22 rare variants, 70% of which were risk-increasing variants, with the disease under the recessive disease model, assuming baseline penetrance of 0.01.
Since the MAF of variants in the exon pilot data set in the 1000 Genomes Project is not very low, we used MS software (Hudson 2002) to simulate 1 million individuals with 80 variants, the MAF of which ranges from 0.0003 to 0.036. The results for MS simulated data are summarized in Supplemental Figures 1–8. Supplemental Figures 1–4 plot the power of nine statistics as a function of the proportion of risk-increasing variants, and Supplemental Figures 5–8 plot the power of the nine statistics as a function of the sample sizes under the additive, dominant, multiplicative, and recessive disease models. The patterns of power of nine statistics for MS software simulated data were similar to that for exon pilot data in the 1000 Genomes Project. The FPCA-based statistics had the highest power, followed by the VT and WSS. We observed that unlike the results for the simulated data based on the exon pilot project, where the power of WSS was higher than that of the VT statistic, the power of VT was often higher than that of WSS for the MS software simulated data.
Application to a real data example
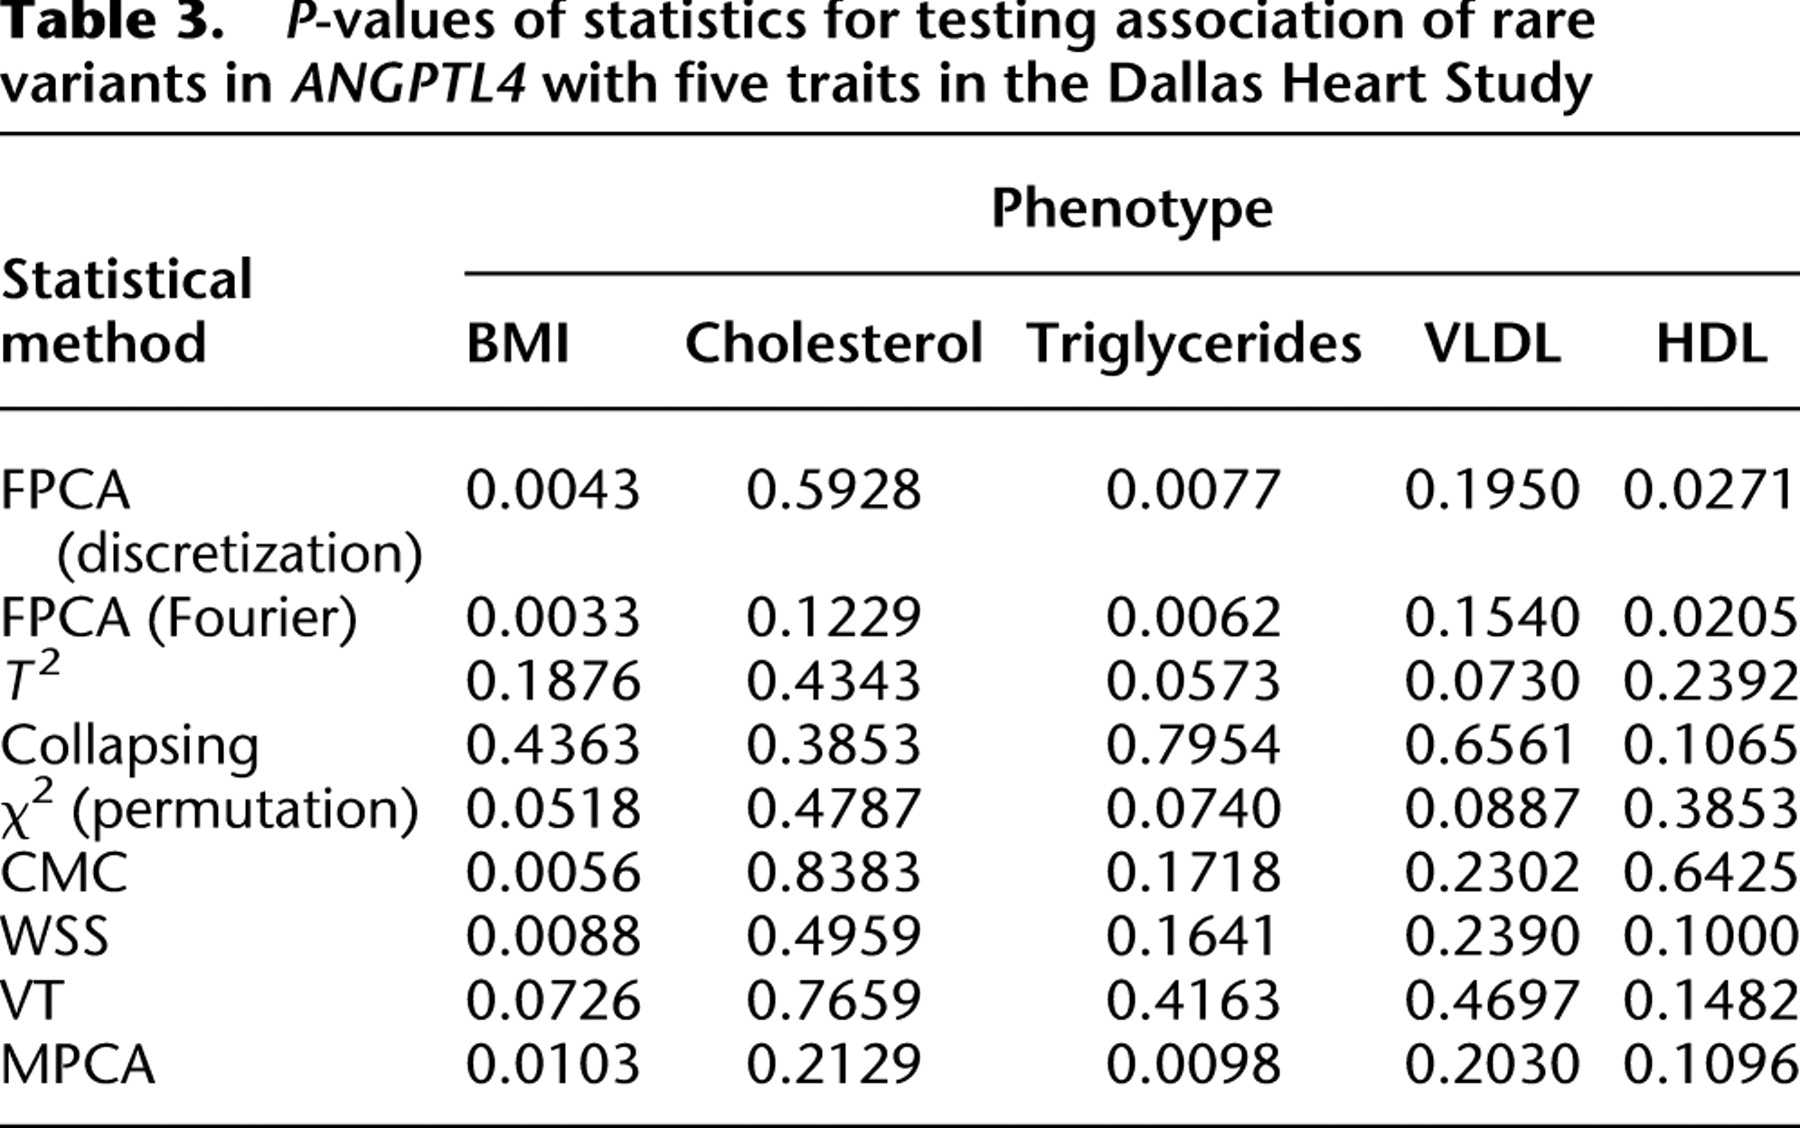
To further evaluate their performance, the FPCA tests were applied to ANGPTL4 sequence and phenotype data from the Dallas Heart Study (Romeo et al. 2007). A total of 93 variants were identified from 3553 individuals. Since the FPCA method requires that each individual should have at least two rare variants in the genomic region being tested, we excluded 98 individuals with only one rare variant. The total number of rare variants with a minor allele frequency below 0.03 in the data set was 71. To examine the phenotypic effects of 71 rare variants in ANGPTL4, we selected two groups of individuals with the lowest and highest quartiles of five traits related to lipid metabolism. The individuals whose plasma triglyceride levels less than or equal to the 25th percentile were classified as the lowest quartiles of the triglyceride, and the individuals whose plasma triglycerides were greater than or equal to the 75th percentile were grouped as the highest quartiles of the triglyceride. We can similarly classify the individuals as the lowest and highest quartiles of high-density lipoprotein cholesterol (HDL), total cholesterol, very low density lipoprotein cholesterol (VLDL), and body mass index (BMI). P-values from the FPCA-based statistics, WSS, VT, MPCA-based statistic, the generalized T2 statistic, single marker  test where permutation was used to adjust for multiple testing, collapsing, and CMC methods for testing association of rare variants in ANGPTL4 with the five traits are summarized in Table 3. For the CMC method, variants with an allele frequency below 0.005 were collapsed. The FPCA-based statistic, the CMC method, WSS, and MPCA showed that rare variants in ANGPTL4 were collectively associated with BMI, and FPCA by expansion had the smallest P-value. Comparing the FPCA and MPCA tests for identifying association of the rare variants in ANGPTL4 with triglyceride levels, we observed that the P-values for the FPCA methods (0.0062 and 0.0077) are smaller than that for the MPCA methods (0.0098). We also observed that P-values by the FPCA-based statistics for testing association of the rare variants in ANGPTL4 with triglyceride were smaller than the P-value (0.016) in their original studies (Romeo et al. 2007). Only the FPCA-based statistic identified an association of the rare variants in ANGPTL4 with HDL.
P-values of statistics for testing association of rare variants in ANGPTL4 with five traits in the Dallas Heart Study
Discussion
The purpose of this study was to explore existing and newly proposed methods for analyzing genotype–phenotype relationships using large-scale DNA sequence data. These methods must be able to meet both the opportunities and obstacles of existing sequencing technologies. We used a genome continuum model and functional principal components as a general principle for developing novel association analysis methods designed for large-scale sequence data. We use simulations that are based on either the exon pilot data in the 1000 Genomes Project or MS software (using population genetic models) generated data to calculate the power of nine alternative statistics: two FPCA-based statistics, MPCA-based statistic, WSS, VT, the generalized T2 statistics, the collapsing method, the CMC method, and the individual  test. We report that the FPCA-based statistics have a higher power to detect association of rare variants and better abilities to filter sequence errors than the other methods.
Data from large scale next-generation sequencing projects have two special features: enrichment for rare variants and a high frequency of sequence errors. Most traditional statistical methods were originally designed for testing the association of common alleles with common diseases and have mainly focused on investigations of individual variants. These methods are ill-suited for rare variants for the following reasons: First, the power of the single marker test (e.g.,  test) is, in general, inversely proportional to the frequency of the risk-raising allele. Therefore, many single marker tests have enough power to detect associations of common alleles with disease but lack the power to detect associations of rare alleles. In the presence of allelic heterogeneity, the power of the current variant-by-variant tests for association of rare variants will vanish. Second, new sequence technologies are error-prone (Johnson and Slatkin 2008). The impact of sequence errors on association analyses of rare variants is more severe than their impact on common variants. As shown here, sequencing errors can inflate the type I error rates of single marker tests of association with rare variants. All of these points argue for a paradigm shift away from single marker association analysis toward collectively testing for association of multiple rare variants.
The current popular strategies for collectively testing for association of multiple rare variants that form the basis for most of the group tests (Bansal et al. 2010b) are to “collapse” sets of rare variants into a single group and test differences in their collective frequency between cases and controls. Such strategies for testing the association of rare variants suffer some limitations. First, the variants at different genomic locations may have different sizes of genetic effects. The frequencies of the variants may not be the only factor that determines the size of genetic effects. Collapsing sets of rare variants into groups or its modified version with assigning weights that are functions of variant frequencies cannot well explore the size information of genetic effects. Second, multiple rare variants may be correlated. The group strategies do not take correlations among variants into account.
To overcome these limitations, we proposed a genome continuum model and used a FPCA method that collectively uses all of the information that can be accessed for testing the association of multiple rare variants in a genomic region with a phenotype of interest. These FPCA methods have several merits. First, the variable at the individual variant site in genetic variant functions can take integer values to code alleles or genotypes, or real numbers to represent the number of reads of the sequences, the probability of the variant being functional, or weights at the variant site. The FPCA methods can use various types of genetic variant data and can be extended for association studies of CNVs. They can also incorporate the functional prediction of the variants into the tests. Therefore, the FPCA methods provide a unified framework for testing the association of the entire spectrum of genomic variation. Second, the FPCA methods simultaneously use genetic information of the individual variants and correlation information (linkage disequilibrium) among all variants. They view the genetic variation across the genomic region as a function of its genomic location. Unlike group tests in which the correlated genetic variants are treated separately, the FPCA methods use the intrinsic functional dependence structure of the data and all available genetic information of the variants in a genomic region. Therefore, we can expect that the FPCA methods will have a high power to detect association of the genomic regions. Through extensive simulations using 1000 Genomes Project real data and simulated data based on a population genetics model, we demonstrated that the power of the FPCA-based statistics is much higher than that of the WSS test, the VT test, the MPCA-based statistic, the single marker tests, the generalized T2 test, the collapsing method, and the CMC method. Third, genetic variant data in a genomic region often have multicollinearity and high dimensionality, which the MPCA methods and the generalized  statistic are unable to deal with efficiently. FPCA methods use data reduction techniques to compress the signal into a few components. Smoothing data recorded at closely spaced variants can reduce the effects of noise. Therefore, application of FPCA-based statistics helps mitigate the impact of sequence errors on tests. By simulation, we showed that the impact of sequence errors on the type I error rates of the FPCA-based statistics was much less than their impact on the type I error rates for other statistics. Fourth, missing data are another challenge for sequence-based association studies. Due to the stochastic placement of sequence reads across the genome, some regions may not be sampled at all or only at low coverage. The rates of missing data for next-generation sequencing platforms are often high (i.e., >20%). Ignoring missing data can introduce biases in association studies. Because rare variants are infrequent and irregularly spaced or missed, each individual has relatively little available information, thus FPCA statistics effectively pool data across individuals by smoothing techniques and using the correlation feature of the genetic data to maximize the available information. This feature makes the FPCA-based statistic less sensitive to missing data.
Sequencing technologies are evolving rapidly and will soon produce the entire spectrum of nucleotide and structural variation for an individual in a timely and cost-effective manner. Application of these technologies to a large sample of well-phenotyped individuals provides a great opportunity to unveil the missing heritability unexplained by current GWAS findings and for fully dissecting the genetic architectures of complex diseases. However, the development of efficient analysis tools for sequence-based association studies is lagging. An over-abundance of rare variants, sequencing errors, and missing data are three important challenges for association tests of DNA sequence data. These challenges greatly affect the type I error rates and power of the commonly used statistics for testing genotype–phenotype associations for rare variants. Although our results are early due to limitations of available next-generation sequence data from large samples of well-phenotyped individuals, the concepts and methods described in this study are expected to emerge as an alternative analytic framework for genetic studies of complex disease and should stimulate further discussions regarding challenges raised by novel sequencing technologies.
Acknowledgments
The project described was supported by Grants 1R01AR057120-01, 1R01HL106034-01, P01 AR052915-01A1, and P50 AR054144-01 CORT from the National Institutes of Health and NIAMS. We thank Yun Zhu for some simulations in the revised version and Hoicheong Siu for downloading low-coverage pilot data in the 1000 Genomes Project.
References
- V Bansal, O Harismendy, R Tewhey, SS Murray, NJ Schork, EJ Topol, KA Frazer. 2010a. Accurate detection and genotyping of SNPs utilizing population sequencing data. Genome Res 20: 537–545.
- V Bansal, O Libiger, A Torkamani, NJ Schork. 2010b. Statistical analysis strategies for association studies involving rare variants. Nat Rev Genet 11: 773–785.
- ↵H Bickeboller, EA Thompson. 1996. The probability distribution of the amount of an individual's genome surviving to the following generation. Genetics 143: 1043–1049.
- ↵MJ Chaisson, D Brinza, PA Pevzner. 2009. De novo fragment assembly with short mate-paired reads: Does the read length matter? Genome Res 19: 336–346.
- ↵JC Cohen, A Pertsemlidis, S Fahmi, S Esmail, GL Vega, SM Grundy, HH Hobbs. 2006. Multiple rare variants in NPC1L1 associated with reduced sterol absorption and plasma low-density lipoprotein levels. Proc Natl Acad Sci 103: 1810–1815.
- ↵SP Dickson, K Wang, I Krantz, H Hakonarson, DB Goldstein. 2010. Rare variants create synthetic genome-wide associations. PLoS Biol 8: e1000294. doi: 10.1371/journal.pbio.1000294.
- ↵KA Frazer, SS Murray, NJ Schork, EJ Topol. 2009. Human genetic variation and its contribution to complex traits. Nat Rev Genet 10: 241–251.
- ↵IP Gorlov, OY Gorlova, SR Sunyaev, MR Spitz, CI Amos. 2008. Shifting paradigm of association studies: Value of rare single-nucleotide polymorphisms. Am J Hum Genet 82: 100–112.
- ↵O Harismendy, PC Ng, RL Strausberg, X Wang, TB Stockwell, KY Beeson, NJ Schork, SS Murray, EJ Topol, S Levy, . 2009. Evaluation of next generation sequencing platforms for population targeted sequencing studies. Genome Biol 10: R32. doi: 10.1186/gb-2009-10-3-r32.
- ↵D Henderson, P Plaschko. 2006. Stochastic differential equations in science and engineering. World Scientific Publishing, Hackensack, NJ.
- ↵LA Hindorff, P Sethupathy, HA Junkins, EM Ramos, JP Mehta, FS Collins, TA Manolio. 2009. Potential etiologic and functional implications of genome-wide association loci for human diseases and traits. Proc Natl Acad Sci 106: 9362–9367.
- ↵RR Hudson. 2002. Generating samples under a Wright-Fisher neutral model of genetic variation. Bioinformatics 18: 337–338.
- ↵W Ji, JN Foo, BJ O'Roak, H Zhao, MG Larson, DB Simon, C Newton-Cheh, MW State, D Levy, RP Lifton. 2008. Rare independent mutations in renal salt handling genes contribute to blood pressure variation. Nat Genet 40: 592–599.
- ↵PL Johnson, M Slatkin. 2008. Accounting for bias from sequencing error in population genetic estimates. Mol Biol Evol 25: 199–206.
- ↵P Joyce, S Tavare. 1995. The distribution of rare alleles. J Math Biol 33: 602–618.
- ↵B Li, SM Leal. 2008. Methods for detecting associations with rare variants for common diseases: Application to analysis of sequence data. Am J Hum Genet 83: 311–321.
- ↵Y Li, AE Byrnes, M Li. 2010. To identify associations with rare variants, Just WhaIT: Weighted haplotype and imputation-based tests. Am J Hum Genet 87: 728–735.
- ↵M Lynch. 2009. Estimation of allele frequencies from high-coverage genome-sequencing projects. Genetics 182: 295–301.
- ↵BE Madsen, SR Browning. 2009. A groupwise association test for rare mutations using a weighted sum statistic. PLoS Genet 5: e1000384. doi: 10.1371/journal.pgen.1000384.
- ↵TA Manolio, FS Collins, NJ Cox, DB Goldstein, LA Hindorff, DJ Hunter, MI McCarthy, EM Ramos, LR Cardon, A Chakravarti, . 2009. Finding the missing heritability of complex diseases. Nature 461: 747–753.
- ↵NJ Marini, J Gin, J Ziegle, KH Keho, D Ginzinger, DA Gilbert, J Rine. 2008. The prevalence of folate-remedial MTHFR enzyme variants in humans. Proc Natl Acad Sci 105: 8055–8060.
- ↵S Nejentsev, N Walker, D Riches, M Egholm, JA Todd. 2009. Rare variants of IFIH1, a gene implicated in antiviral responses, protect against type 1 diabetes. Science 324: 387–389.
- ↵JE Pool, I Hellmann, JD Jensen, R Nielsen. 2010. Population genetic inference from genomic sequence variation. Genome Res 20: 291–300.
- ↵AL Price, GV Kryukov, PI de Bakker, SM Purcell, J Staples, LJ Wei, SR Sunyaev. 2010. Pooled association tests for rare variants in exon-resequencing studies. Am J Hum Genet 86: 832–838.
- ↵JO Ramsay, BW Silverman. 2005. Functional data analysis. Springer, New York.
- ↵S Romeo, LA Pennacchio, Y Fu, E Boerwinkle, A Tybjaerg-Hansen, HH Hobbs, JC Cohen. 2007. Population-based resequencing of ANGPTL4 uncovers variations that reduce triglycerides and increase HDL. Nat Genet 39: 513–516.
- ↵NJ Schork, SS Murray, KA Frazer, EJ Topol. 2009. Common vs. rare allele hypotheses for complex diseases. Curr Opin Genet Dev 19: 212–219.
- ↵M Stephens, P Donnelly. 2003. A comparison of Bayesian methods for haplotype reconstruction from population genotype data. Am J Hum Genet 73: 1162–1169.
- ↵M Struwe. 1990. Variational methods. Springer-Verlag, Berlin.
- ↵F Yao, HG Müller, JL Wang. 2005. Functional data analysis for sparse longitudinal data. J Am Stat Assoc 100: 577–590.
- ↵X Zhu, T Feng, Y Li, Q Lu, RC Elston. 2010. Detecting rare variants for complex traits using family and unrelated data. Genet Epidemiol 34: 171–187.
Notes
[1] [Supplemental material is available for this article.]
[2] Article published online before print. Article, supplemental material, and publication date are at http://www.genome.org/cgi/doi/10.1101/gr.115998.110.