
Abstract
Williams syndrome is a complex developmental disorder that results from the heterozygous deletion of a ∼1.6-Mb segment of human chromosome 7q11.23. These deletions are mediated by large (∼300 kb) duplicated blocks of DNA of near-identical sequence. Previously, we showed that the orthologous region of the mouse genome is devoid of such duplicated segments. Here, we extend our studies to include the generation of ∼3.3 Mb of genomic sequence from the mouse Williams syndrome region, of which just over 1.4 Mb is finished to high accuracy. Comparative analyses of the mouse and human sequences within and immediately flanking the interval commonly deleted in Williams syndrome have facilitated the identification of nine previously unreported genes, provided detailed sequence-based information regarding 30 genes residing in the region, and revealed a number of potentially interesting conserved noncoding sequences. Finally, to facilitate comparative sequence analysis, we implemented several enhancements to the program PipMaker, including the addition of links from annotated features within a generated percent-identity plot to specific records in public databases. Taken together, the results reported here provide an important comparative sequence resource that should catalyze additional studies of Williams syndrome, including those that aim to characterize genes within the commonly deleted interval and to develop mouse models of the disorder.
[The sequence data described in this paper have been submitted to GenBank under accession nos. AF267747, AF289666,AF289667, AF289664, AF289665, AC091250, AC079938, AC084109, AC024607,AC074359, AC024608, AC083858, AC083948, AC084162, AC087420, AC083890,AC080158, AC084402, AC083889, AC083857, and AC079872.]
The past decade has brought spectacular advances in our understanding of the contiguous gene deletion disorder Williams syndrome (WS, also known as Williams-Beuren syndrome; OMIM 194050 [see http://www.ncbi.nlm.nih.gov/Omim]). This complex and intriguing developmental disorder is associated with defects in multiple physiological systems, with the classic phenotypic features including cardiovascular disease, dysmorphic facial characteristics, infantile hypercalcemia, and unique cognitive and personality components (Burn 1986; Morris et al. 1988; Bellugi et al. 1990, 1999; Lashkari et al. 1999; Mervis et al. 1999; Donnai and Karmiloff-Smith 2000; Mervis and Klein-Tasman 2000; Morris and Mervis 2000).
A key turning point in elucidating the genetic basis of WS came in 1993 with the discovery that the disorder is associated with hemizygous microdeletions within human chromosome 7q11.23 that include the elastin gene (ELN; Ewart et al. 1993). Since that time, there have been numerous studies aiming to map this region of chromosome 7, identify the genes residing within the commonly deleted interval, and associate the phenotypic features of the disorder to the haploinsufficiency of specific genes. These efforts have been aided by a joint effort between our group and the Washington University Genome Sequencing Center (http://genome.wustl.edu/gsc) to map and sequence the human WS region. However, significant challenges have been encountered. For example, attempts to establish contiguous and accurate long-range physical maps of the human WS region have been hampered by a number of problems, including unstable yeast artificial chromosome (YAC) clones derived from the region (which are most likely a consequence of the notably high density of repetitive sequences) and the presence of several large (∼300 kb), closely spaced blocks of DNA with near-identical sequence (Gorlach et al. 1997; Osborne et al. 1997a; Hockenhull et al. 1999; Korenberg et al. 2000; Peoples et al. 2000; Valero et al. 2000). The latter genomic segments, which greatly confound conventional mapping and sequencing strategies, are particularly important, both because they contain gene and pseudogene sequences (Gorlach et al. 1997; Osborne et al. 1997a; Perez Jurado et al. 1998) and because they appear to play a central role in mediating the inter- and intrachromosomal recombination events that lead to the WS-associated deletions (Perez Jurado et al. 1996; Robinson et al. 1996; Baumer et al. 1998).
Despite the challenges associated with mapping and sequencing the human WS region, numerous genes residing within the commonly deleted interval and the flanking duplicated segments have been identified (Fig.1; Table 1;Francke 1999; Osborne 1999; Osborne and Pober 2001). The diverse phenotypic features associated with WS likely result from haploinsufficiency of these and/or yet-to-be-identified genes that reside within the deleted interval. However, with the exception ofELN and cardiovascular/connective tissue disease, correlating individual genes with specific phenotypic features has proven difficult.
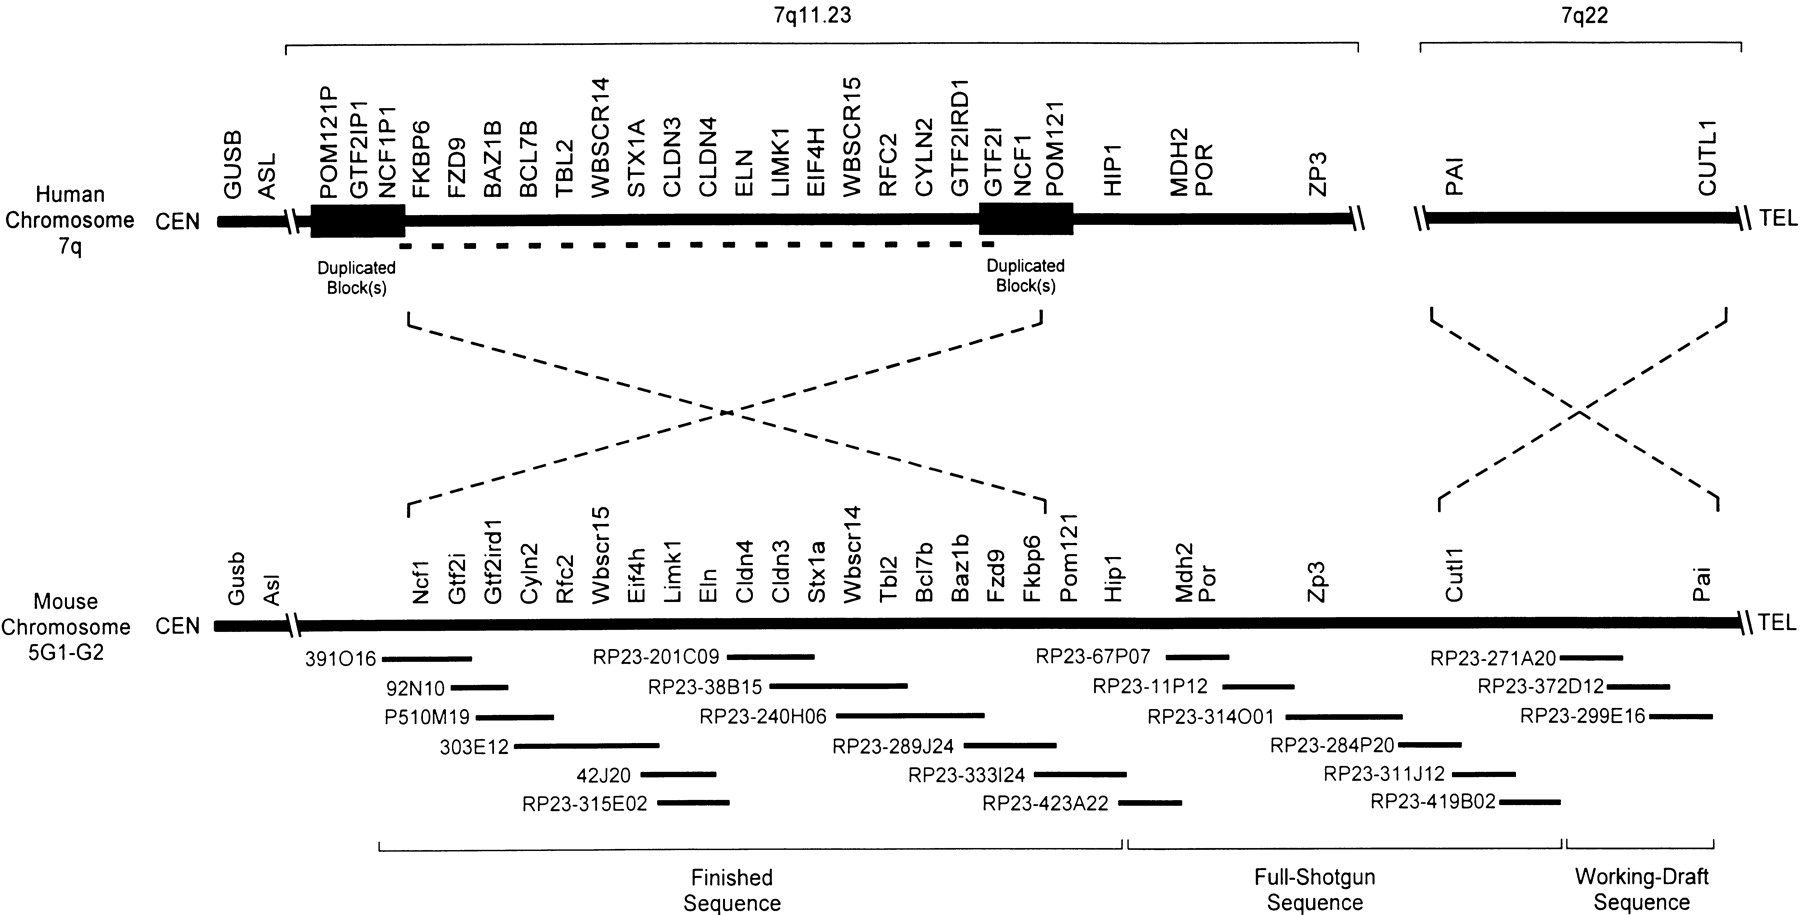
Long-range organization of human and mouse Williams syndrome (WS) regions. A physical map of the WS regions on human chromosome 7q and mouse chromosome 5G is depicted emphasizing the positions of the known genes residing within and flanking the interval commonly deleted in WS (DeSilva et al. 1999; Francke 1999; Hockenhull et al. 1999; Osborne 1999; Korenberg et al. 2000; Peoples et al. 2000; Valero et al. 2000). In the human WS region, this interval spans ∼1.6 Mb (indicated by a bold dashed line) and is flanked by duplicated blocks of DNA of near-identical sequence (estimated at ∼300 kb in size; indicated by dark rectangles). The relative positions of the centromere (CEN) and telomere (TEL) are indicated in each case. Note the inverted orientation of the two discontiguous segments of human chromosome 7 relative to the single contiguous segment of mouse chromosome 5G. The relative positions of the known human and mouse genes residing in this region are indicated, with additional details provided in Table 1. Depicted below the map of the mouse WS region are the 21 overlapping BAC/PAC clones selected for sequencing (seehttp://bio.cse.psu.edu/publications/desilva for a complete contig map of the mouse WS region), with the current sequencing status (finished, full shotgun, or working draft) indicated at the bottom (also see Table2). Note that the depicted genomic regions and the BAC/PAC clones are not drawn to scale.
Known Human/Mouse Genes Residing Within or Near the WS Region
As a complement to the above efforts, our interests have focused on the comparative mapping and sequencing of the WS region in the human and mouse genomes. Previously, we established a bacterial clone-based contig map of the mouse genomic region encompassing the Elnand Ncf1 (p47-phox) genes (DeSilva et al. 1999); note that NCF1 gene/pseudogene sequences reside within the duplicated blocks in the human WS region (Fig. 1; Table 1). Interestingly, we discovered that the mouse WS region is devoid of the large duplicated segments that are characteristic of its human counterpart. To acquire a more detailed view of this important genomic interval, we have now extended our mouse physical mapping efforts as well as sequenced the entire mouse WS region. Here, we report the generation of ∼3.3 Mb of mouse genomic sequence and the results of detailed computational analyses, which included extensive comparisons with the available sequence of the human WS region.
RESULTS
Physical Mapping of the Mouse WS Region
The segment of the mouse genome corresponding to the human WS region resides on distal mouse chromosome 5. Our previous clone-based physical mapping efforts resulted in the construction of a bacterial artificial chromosome (BAC)/P1-derived artificial chromosome (PAC) contig spanning a large portion of this genomic region, including the entire interval flanked by the Eln and Ncf1 genes (DeSilva et al. 1999). As part of a broader effort to generate BAC-based physical maps of the portions of the mouse genome orthologous to human chromosome 7 (Thomas et al. 2000), we extended this contig map to encompass the entire WS region (including the interval commonly deleted in WS, the segment that is duplicated in human, and additional flanking DNA). The complete contig map is available as part of an electronic supplement accompanying this paper (athttp://bio.cse.psu.edu/publications/desilva). Based on our earlier (DeSilva et al. 1999) and expanded physical mapping efforts, a set of 21 clones, which together fully encompass the mouse WS region, was selected for systematic sequencing (Fig. 1).
Consistent with our previous mapping studies (DeSilva et al. 1999), we encountered no evidence for the presence of large, duplicated blocks of DNA within the mouse WS region, such as those residing in the orthologous segment on human chromosome 7q11.23. Indeed, the clone-based physical mapping of the mouse WS region proceeded smoothly, in striking contrast to our efforts and those of others (Osborne et al. 1996; Hockenhull et al. 1999; Korenberg et al. 2000; Peoples et al. 2000; Valero et al. 2000) in mapping the human WS region.
The long-range organization of the mouse and human WS regions is also different in other ways. Specifically, a single contiguous block of mouse chromosome 5 encompassing the WS region is orthologous to two discontiguous segments of human chromosome 7, one on 7q11.23 and one on 7q22. The former segment contains the interval commonly deleted in WS and the flanking duplicated blocks; interestingly, the orientation of the central portion of this region is inverted in mouse versus human (Fig. 1). The inverted orientation of the mouse WS region (compared to the human WS region) was confirmed by two-color fluorescent in situ hybridization (FISH) studies with Ncf1– andFkbp6-containing BACs; the results clearly showed thatNcf1 is at the centromeric end and Fkbp6 at the telomeric end of the WS region on mouse chromosome 5 (data not shown). These physical mapping studies are consistent with the BSS JAX panel genetic mapping data (http://www.jax.org/resources/documents/cmdata/bkmap/BSS.html). Importantly, the breakpoints associated with this evolutionary inversion correspond to the locations of the duplicated blocks in the human WS region, which are also the most common sites of deletion breakpoints seen in WS (Fig. 1). Our finding of an inverted orientation of the mouse versus human WS region is consistent with data generated by others (Peoples et al. 2000; Valero et al. 2000).
Immediately telomeric to the interval commonly deleted in WS is a genomic segment encompassing the HIP1/Hip1,MDH2/Mdh2, POR/Por, andZP3/Zp3 genes; this region is oriented the same in mouse and human. However, in mouse, this segment is contiguous (in the telomeric direction) with a region that is orthologous to human 7q22 and that contains the Cutl1 and Pai genes. In human, this segment is not contiguous with the WS region and, in fact, is inverted in orientation (relative to the mouse segment; see Fig. 1).
Sequencing of the Mouse WS Region
The 21 overlapping mouse clones depicted in Figure 1 were sequenced by a shotgun sequencing strategy. The GenBank accession number for each resulting sequence is provided in Table 2. Note that the first five clones (391O16, 92N10, P510M19, 303E12, and 42J20) were isolated from libraries derived from the 129SV mouse strain and sequenced prior to the decision to use the C57BL/6J mouse strain (with an emphasis on the RPCI-23 mouse BAC library) for sequencing the mouse genome as part of the Human Genome Project (Battey et al. 1999;Denny and Justice 2000). The remaining 16 clones were isolated from the RPCI-23 library. Taken together, a total of ∼3.3 Mb of nonredundant mouse genomic sequence was generated, of which a single contiguous block of just over 1.4 Mb is finished, high-accuracy sequence (i.e., with an error rate of <1 in 10,000 bp), another ∼1.4 Mb is at a full-shotgun stage (with ∼11-fold average coverage in Phred Q20 bases; Ewing et al. 1998; Ewing and Green 1998) and is currently being finished, and the remaining ∼0.5 Mb is at a working-draft stage (with ∼5-fold average coverage in Phred Q20 bases), as indicated in Figure1 and Table 2.
Sequenced Mouse Clones
| Clone name | Clone type | Status | GenBank No. |
| 391O16 | BAC | Finished | AF267747 |
| 92N10 | BAC | Finished | AF289666 |
| P510M19 | PAC | Finished | AF289667 |
| 303E12 | BAC | Finished | AF289664 |
| 42J20 | BAC | Finished | AF289665 |
| RP23-315E02 | BAC | Finished | AC091250 |
| RP23-201C09 | BAC | Finished | AC079938 |
| RP23-38B15 | BAC | Finished | AC084109 |
| RP23-240H06 | BAC | Finished | AC024607 |
| RP23-289J24 | BAC | Finished | AC074359 |
| RP23-333I24 | BAC | Finished | AC024608 |
| RP23-423A22 | BAC | Full Shotgun | AC083858 |
| RP23-67P07 | BAC | Full Shotgun | AC083948 |
| RP23-11P12 | BAC | Full Shotgun | AC084162 |
| RP23-314O01 | BAC | Full Shotgun | AC087420 |
| RP23-284P20 | BAC | Full Shotgun | AC083890 |
| RP23-311J12 | BAC | Full Shotgun | AC080158 |
| RP23-419B02 | BAC | Full Shotgun | AC084402 |
| RP23-271A20 | BAC | Working Draft | AC083889 |
| RP23-372D12 | BAC | Working Draft | AC083857 |
| RP23-299E16 | BAC | Working Draft | AC079872 |
Mouse–Human Comparative Sequence Analysis
The resulting mouse genomic sequence was subjected to rigorous computational analyses. Emphasis was placed on studying the large (∼1.4 Mb), contiguous block of finished sequence, which included the entire region orthologous to the interval commonly deleted in WS. For comparison to the finished mouse sequence, we were able to identify finished or draft-level human sequence in GenBank for all but ∼200 kb of the corresponding region on human chromosome 7q11.23 (with the notable segments unavailable for comparative analyses being ∼40 kb encompassing the gene represented by AK005040, ∼100 kb at the 5′ end of ELN, and ∼20 kb just 5′ to CLDN3).
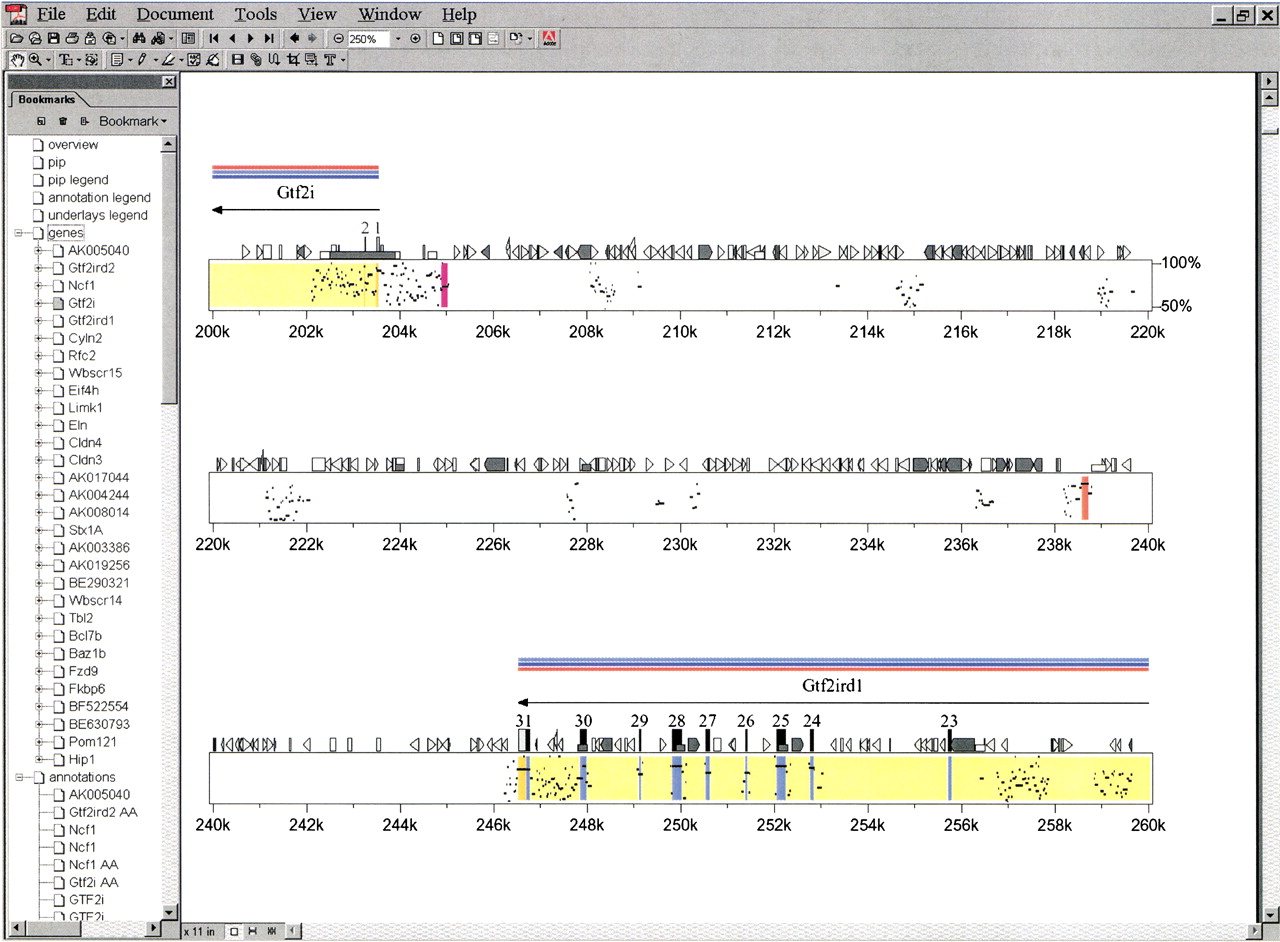
The central analytical and organizational tool for our comparative sequence analyses was the program PipMaker (Hardison et al. 1997; Ellsworth et al. 2000; Schwartz et al. 2000). The core function of this program is to perform direct comparisons between large blocks of orthologous sequences. In addition, though,PipMaker provides an effective and convenient mechanism for assimilating and displaying relevant annotations about large segments of genomic sequence, including the location of repetitive elements and CpG islands, the intron–exon organization of genes, and, most importantly, the areas (both coding and noncoding) found to be highly conserved between two orthologous sequences. To enhance the utility of PipMaker, we recently added a feature that incorporates hyperlinks from annotated regions of the resulting percent-identity plot (PIP) to relevant Internet sites. This allows the creation of an informative and dynamic electronic supplement that captures the key elements of each comparative analysis. An illustration of this new PipMaker feature is provided in Figure2, which shows a small portion of the PIP generated by comparing the sequences of the mouse and human WS regions (note that the entire PDF-formatted PIP is available athttp://bio.cse.psu.edu/publications/desilva).
Representative portion of the percent-identity plot (PIP) comparing mouse and human sequence from the Williams syndrome (WS) region. The finished mouse sequence reported here was compared with the available orthologous human sequence using PipMaker. The complete PIP and details about the various annotations it contains are available at http://bio.cse.psu.edu/publications/desilva. Shown here is a ∼60-kb region containing portions of theGtf2i/GTF2I and Gtf2ird1/GTF2IRD1genes and the interval residing between them. Note that only gap-free segments that are ≥50% identical between mouse and human are plotted. The first two exons and last nine exons ofGtf2i/GTF2I and Gtf2ird1/GTF2IRD1, respectively, are represented by vertical rectangles and numbered accordingly; most of these exons are associated with high levels of mouse–human sequence conservation. Note the two conserved noncoding sequences at ∼205 kb and ∼239 kb (both are gap-free segments of >100 bp in length with mouse–human sequence identities of >70% and >90%, respectively, as indicated by the different colored vertical lines at those positions). Also note the various colored horizontal bars drawn above the two genes; in the actual PDF file generated byPipMaker, these bars provide direct links to relevant Internet sites (e.g., appropriate PubMed citation[s] for the gene [pink], the GenBank record containing the predicted amino acid sequence of the protein encoded by the gene [light blue], and the LocusLink entry for the gene [dark blue]). The bookmarks along the left side provide links to compiled information about the various genes and other annotations generated during the comparative analysis of these sequences.
Our comparative analyses revealed a number of interesting general features of the WS region. First, the GC content of the mouse and human WS regions is similar, both the overall level (48.8% and 49.2%, respectively) and the relative uniformity across the region (ranging from 41.7% to 51.7% in mouse and 40.2% to 55.5% in human when calculated in 50-kb windows). In contrast, the mouse and human WS regions differ substantially in their repeat content, for example, consisting of 35.9% and 54.2% interspersed repetitive elements (mostly SINES and LINES), respectively. In addition, there is a notable lack of uniformity of repeat content across the region, ranging from 30.6% to 62.7% in mouse and 27.9% to 84.3% in human (when calculated in 50-kb windows). The difference in the amount of repetitive sequences largely accounts for the slight compression of the mouse WS region compared to its human counterpart. For example, this is clearly evident in the interval encompassing the genesGTF2IRD2/Gtf2ird2, NCF1/Ncf1, andGTF2I/Gtf2i, with finished sequence being available for both the mouse and human regions; the size of the same genomic segment is ∼124 kb and ∼169 kb in mouse and human, respectively (consisting of 34.3% and 50.0% interspersed repeats, respectively). Finally, PipMaker analysis revealed numerous segments that are highly conserved between the mouse and human WS regions. Most of these correspond to exons within known and newly identified genes (see below); however, many others appear to be conserved noncoding sequences. Specifically, within the ∼1.4 Mb of finished mouse sequence, 55 gap-free alignments of ≥100 bp in length and with ≥70% mouse–human sequence identity were identified that do not overlap any of the identified exons. Two of these are shown in Figure 2, with the complete list available at http://bio.cse.psu.edu/publications/desilva.
PipMaker analysis also revealed that mouse–human sequence conservation across the WS region is relatively low compared to other genomic regions examined to date, both in terms of the total amount of noncoding, nonrepetitive sequence that is at least moderately conserved (i.e., can be reliably aligned between mouse and human) and the amount that is highly conserved. To quantify this, we focused attention on the finished sequence from the mouse WS region. Following removal of segments for which the orthologous human sequence was not available and the masking of both repeats and annotated coding regions, the remaining mouse sequence was aligned with its human counterpart. Only 20.3% of the nonexonic, nonrepetitive sequence could be aligned between mouse and human, providing a benchmark for the overall level of conservation (Table 3). Only 1.1% of the sequence was found to be highly conserved (i.e., resided within a gap-free alignment of ≥100 bp in length and ≥70% mouse–human sequence identity). For comparison, we performed the same analysis on 12 other genomic regions for which large blocks of finished sequence were available for both mouse and human. For these other regions, we first masked repeats and annotated exons in the human (rather than mouse) sequence. In all but two cases, there is a greater degree of total mouse–human sequence conservation than that encountered with the WS region (Table 3), with a greater percentage of highly conserved sequence seen in all but three cases. In addition, the data presented in Table 3 suggest a potential correlation between mouse–human sequence divergence and the content of G+C nucleotides and/or interspersed repetitive elements; note that the latter is consistent with the findings of Chiaromonte et al. (2001). However, a more systematic study is certainly required before firm conclusions can be reached.
Mouse-Human Sequence Conservation in Selected Genomic Regions
| Genomic region[i] | Non-exonic, non-repetitive (unmasked) sequence | |||||
| Total conserved (%)[ii] | Highly conserved (%)[iii] | G+C (%)[iv] | Length (bp)[v] | Masked (%)[vi] | Reference[vii] | |
| HOXA | 99.3 | 21.3 | 50.7 | 93,211 | 15.2 | Unpublished |
| TCR | 77.8 | 7.0 | 44.0 | 77,115 | 21.0 | Koop and Hood 1994 |
| FHIT | 58.1 | 7.6 | 37.1 | 331,123 | 42.1 | Shiraishi et al. 2001 |
| CFTR | 53.2 | 4.9 | 34.9 | 247,331 | 41.3 | Ellsworth et al. 2000 |
| BTK | 49.6 | 4.9 | 41.1 | 43,504 | 41.0 | Oeltjen et al. 1997 |
| SNCA | 44.4 | 1.0 | 34.6 | 84,504 | 29.8 | Touchman et al. 2001 |
| DIST1 | 40.9 | 0.8 | 55.3 | 64,841 | 45.7 | Flint et al. 2001 |
| MECP2 | 39.7 | 5.9 | 47.8 | 59,670 | 56.9 | Reichwald et al. 2000 |
| CD4 | 35.6 | 3.3 | 51.9 | 106,531 | 50.8 | Ansari-Lari et al. 1998 |
| CECR | 21.3 | 1.8 | 45.9 | 368,778 | 52.5 | Footz et al. 2001 |
| WS region | 20.3 | 1.1 | 48.9 | 573,537 | 49.7 | This paper |
| MYO15 | 15.4 | 3.7 | 56.9 | 46,035 | 47.7 | Liang et al. 1999 |
| ERCC2 | 11.0 | 0 | 58.5 | 15,721 | 61.7 | Lamerdin et al. 1996 |
[i] Listed here are 13 genomic regions for which mouse and human genomic sequence is available for comparative analyses. In all cases except for the WS region, finished sequence was available for both mouse and human; in these cases, the name of a known (human) gene within the sequenced region is given. In the case of the WS region, the ∼1.4 Mb of finished mouse sequence was analyzed and an attempt was made to remove mouse sequence for which the orthologous human sequence was not available.
[ii] Annotated exons and sequences identified by theRepeatMasker program (using the default settings) were masked in the human sequence (or the mouse sequence in the case of the WS region). The mouse and human sequences were then aligned with theBLASTZ component of PipMaker (using the default settings). In all cases except for the WS region, the human sequence was used as the reference for the PipMakeranalysis. Shown in this column is the percentage of the non-exonic, non-repetitive sequence within a mouse-human alignment, reflecting the amount of unmasked sequence with at least moderate levels of mouse–human sequence conservation.
[iii] Percentage of the non-exonic, non-repetitive (unmasked) sequence within a gap-free mouse-human sequence alignment of ≥100 bp in length and ≥70% nucleotide identity.
[iv] Percentage of G+C nucleotides in the non-exonic, non-repetitive (unmasked) sequence.
[v] Total length (in bp) of the non-exonic, non-repetitive (unmasked) sequence.
[vi] Percentage of the entire region masked as repetitive or exonic.
[vii] All of the mouse and human genomic sequences used for the analysis summarized in this table are in GenBank. When available, a citation reporting the mouse and/or human sequence for the region is provided.
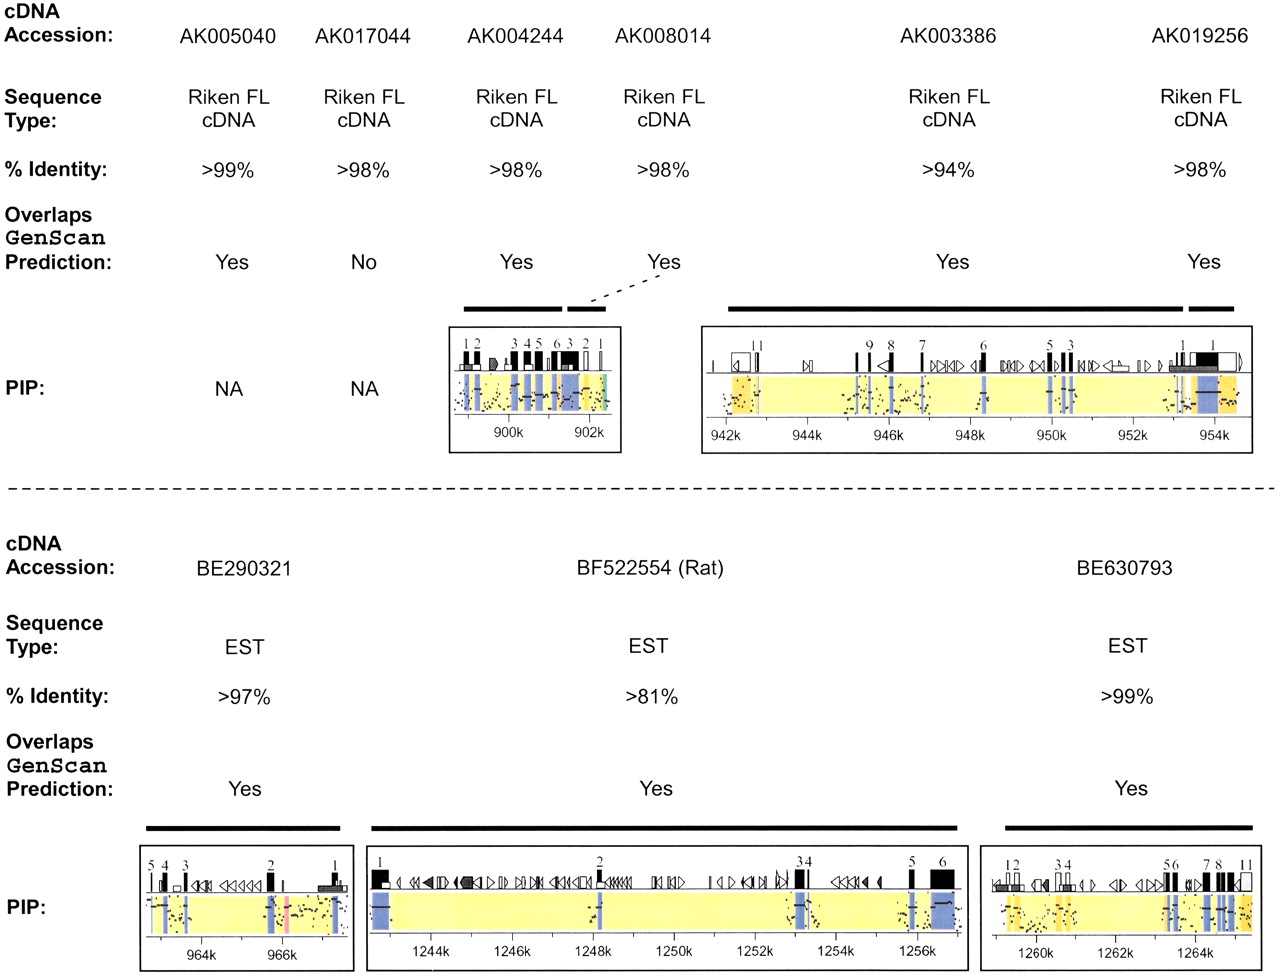
Significant effort was also focused on the computational detection and annotation of genes residing in the WS region. The availability of both mouse and human genomic sequences greatly enhanced the ability to detect genes and to define their long-range organization. Table4 provides a summary of the 30 genes identified within the ∼1.4 Mb of finished mouse sequence, with additional details (e.g., deduced coding sequences, predicted amino acid sequences of the corresponding proteins, and presence of conserved domains) available at http://bio.cse.psu.edu/publications/desilva. Of these 30 genes, 20 have been assigned names and reported previously as residing within the WS region (see Table 1), while one (Gtf2ird2) is associated with an annotated GenBank record (AY014963) indicating its presence in the WS region. Importantly, the remaining 9 (in each case indicated in Table 4 by a representative GenBank record containing a corresponding full-length cDNA sequence or an associated expressed-sequence tag [EST]) represent newly identified genes with respect to their presence in the WS region. The evidence that these are authentic genes includes the identification of cDNA sequences matching the mouse genomic sequence, their overlap withGenScan-predicted gene models (in all but one case), and the presence of strong mouse–human sequence conservation; these features are detailed in Figure 3. Remarkably, 6 of these newly identified genes (AK017044, AK004244,AK008014, AK003386, AK019256, and BE290321) clearly reside within the genomic interval commonly deleted in WS. Additional features of the newly identified genes are summarized in an electronic table athttp://bio.cse.psu.edu/publications/desilva.
Genes Identified in the ∼1.4 Mb of Finished Sequence from the Mouse WS Region
| Gene[i] | CpG island[ii] | Mouse-human comparisons | |||
| CDS length in bp, mouse (human)[iii] | CDS, % identity[iv] | AA sequence, % identity[v] | |||
| AK005040 | Yes | 1163 (NA) | NA | NA | |
| Gtf2ird2 | Yes | 2811 (2673) | 79.3 | 82.1 | |
| Ncf1 | No | 1173 (1170) | 81.4 | 82.5 | |
| Gtf2i | Yes | 2940 (2937) | 87.7 | 96.8 | |
| Gtf2ird1 | Yes | 2071 (2077) | 88.0 | 87.1 | |
| Cyln2 | Yes | 3136 (3134) | 86.0 | 91.4 | |
| Rfc2 | Yes | 1050 (1066) | 84.9 | 92.8 | |
| Wbscr15 | No | 576 (610) | 74.0 | 64.6 | |
| Eif4h | Yes | 747 (747) | 91.3 | 98.4 | |
| Limk1 | Yes | 1944 (1944) | 88.0 | 95.2 | |
| Eln | Yes | 2582 (2274) | 81.4 | 81.8 | |
| Cldn4 | Yes | 631 (628) | 82.7 | 83.2 | |
| Cldn3 | Yes | 660 (663) | 88.2 | 91.3 | |
| AK017044 | No | 838 (NA) | NA | NA | |
| AK004244 | Yes | 924 (NA) | NA | NA | |
| AK008014 | No | 544 (529) | 75.3 | NA | |
| Stx1a | Yes | 867 (863) | 91.0 | 98.3 | |
| AK003386 | Yes | 1135 (1045) | 81.2 | 74.9 | |
| AK019256 | Yes | 530 (530) | 78.8 | 76.3 | |
| BE290321 | Yes | 521 (NA) | NA | NA | |
| Wbscr14 | Yes | 2595 (2559) | 83.9 | 81.6 | |
| Tbl2 | Yes | 1329 (1344) | 85.4 | 87.8 | |
| Bcl7b | Yes | 546 (546) | 88.5 | 94.6 | |
| Baz1b | Yes | 4440 (4452) | 86.6 | 91.1 | |
| Fzd9 | Yes | 1648 (1648) | 87.6 | 95.8 | |
| Fkbp6 | Yes | 864 (864) | 81.6 | 86.0 | |
| BF522554 | Yes | 1455 (1466) | 84.2 | 78.8 | |
| BE630793 | Yes | 1211 (1212) | 83.2 | NA | |
| Pom121 | Yes | 3361 (3440) | 78.1 | 71.1 | |
| Hip1 | Yes | 2518 (2518) | 87.6 | 87.6 | |
[i] The 30 genes identified within the ∼1.4 Mb of finished sequence from the mouse WS region are listed in their order on mouse chromosome 5G1-G2 (from centromere to telomere; see Fig. 1). Of these 30 genes, 21 have been previously published (listed in Table 1and depicted in Fig. 1) or, in the case of Gtf2ird2, submitted as an annotated GenBank record (AY014963). In the case of the 9 genes previously not reported as residing in the WS region, representative GenBank accession numbers are provided (see Fig. 3).
[ii] The presence (yes) or absence (no) of an overlap between the 5′ exon of the gene and a CpG island (regions of ≥50% G+C content where the ratio of CpG dinucleotides relative to GpC is ≥60% within a 200-bp window) is indicated. In two cases (BE290321and BF522554), cDNA sequence was not available to define the 5′ exons; instead, the 5′ exons were predicted by GenScanbased on extending an existing EST (to a methionine codon).
[iii] The length of each mouse coding sequence (CDS) was established by one of several methods. If a mouse RefSeq entry was available for the gene (http://www.ncbi.nlm.nih.gov/LocusLink/refseq.html), the length of the CDS in that record was used. In the absence of a mouse RefSeq record but presence of a human gene sequence (HIP1), aBLASTZ alignment was used to identify the putative mouse coding and predicted amino acid sequences. In the absence of a human gene, other sources were used to annotate the mouse genes. For example, the rat Pom121 gene aligned with the mouse genomic sequence at >85% identity with precise exon boundaries and was therefore used to annotate the mouse Pom121 exons. Two genes (BE522554 andBE630793) were identified by a MegaBLAST search of the mouse genomic sequence against the TIGR EST database (http://www.tigr.org/tdb/tgi.shtml); the resulting information was used in conjunction with GenScan to establish the mouse gene model. The length of each human coding sequence was estimated byPipMaker (this was done for consistency because there was no corresponding human RefSeq record nor human LocusLink mRNA entry for roughly a third of the mouse genes). Of note, analyses performed using available human RefSeq records yielded the same results as those obtained using the PipMaker-predicted human coding sequences; in one case (ELN), PipMaker failed to predict a human coding sequence; in this case, the available RefSeq record was used. In one case (GTF2IRD2), PipMaker failed to predict a coding sequence and no full-length human cDNA sequence was available in GenBank; in this case, a GenScan prediction of the human coding sequence was used. In four cases (indicated by NA), none of the above means for predicting the human coding sequence was effective, most often due to the lack of available human genomic or cDNA sequence.
[iv] The tool EMBOSS(http://www.ebi.ac.uk/emboss/align), which uses the Needleman-Wunsch global alignment algorithm to find the optimum alignment (including gaps) of two sequences when considering their entire length, was used to calculate the percent-identity of the mouse and human coding sequences over the aligned regions. In four cases, no human coding sequence was available for this analysis (indicated by NA).
[v] The predicted amino acid (AA) sequence derived from each orthologous mouse–human gene pair was compared usingEMBOSS. The indicated percent-identity corresponds to the percentage of the total amino acids with identical matches between the two sequences over the aligned regions. When available, the amino acid sequences were derived from RefSeq records; otherwise, matching GenBank protein records were used. In the case of BF522554, neither of these sources was available; thus, a translated version of the coding sequence predicted by PipMaker was used. WhenPipMaker failed to predict a human coding sequence for a mouse gene or no open reading frame could be found in the predicted coding sequence, BLASTX or BLASTP was used to search the National Center for Biotechnology Information database. For three genes (AK003386, AK019256, and Pom121), this yielded an aligning human protein (XP_042880, XP_042882, and XP_034753.1, respectively). In some cases (indicated by NA), amino acid sequence alignments could not generated, either because the mouse coding sequence did not provide an open reading frame that enabled an accurate prediction of a protein sequence or a human amino acid sequence could not be obtained for alignment with the predicted mouse protein.
Identification of previously unreported genes in the Williams syndrome (WS) region. Of the 30 genes identified within the ∼1.4 Mb of finished mouse sequence (see Table 4), 9 have not been previously reported to reside within the WS region. Information about each of these 9 genes is provided (listed in order across the mouse WS region), including (1) a representative GenBank accession number for the mouse cDNA sequence (note in one case, BF522554, the only available cDNA sequence was from rat); (2) the type of sequence contained in that GenBank record (Riken full-length [FL] cDNA sequence [Kawai et al. 2001] or EST); (3) the percent-identity between the mouse genomic sequence and the matching cDNA sequence; (4) an indication of whether or not the putative gene overlaps aGenScan-predicted gene (specifically, if >1 exon matches a Genscan-predicted exon or, in the case of AK019256, the single exon matches the predicted exon for >500 bp; note that the only gene not meeting these criteria, AK017044, did have one of its exons matching a Genscan-predicted exon); and (5) the gene-containing portion of the percent-identity plot (PIP) showing the pattern of mouse–human sequence conservation (except for AK005040 andAK017044, for which no human sequence was available). See Fig. 2 for additional details about the PIP.
The 30 identified genes are associated with a number of other interesting features. First, all but 4 (87%) have a CpG island at their 5′ end (Table 4); this is a considerably higher fraction than that reported previously for mouse genes (Antequera and Bird 1993;Jareborg et al. 1999). Second, the splice sites and intron–exon organization of the genes are the same in mouse and human (at least for the genes for which genomic sequence was available in both species) except for Eln/ELN, which has 81% amino acid identity between mouse and human but shows a lack of conservation at the splice junctions. Third, the coding-sequence conservation between the mouse–human orthologous gene pairs (Table 4) falls within the typical range established previously (Makalowski et al. 1996;Makalowski and Boguski 1998), with the exceptions being the less conserved Wbscr15/WBSCR15 (as we reported previously [Doyle et al. 2000]) and perhaps Pom121/POM121. Finally, with the exception of the changes associated with the evolutionary inversions depicted in Figure 1, gene order is the same in the mouse and human WS regions.
The ∼1.9-Mb segment of draft-level mouse sequence that we generated (corresponding to the seven clones taken to full-shotgun and three clones taken to working-draft levels of redundancy; see Table 2) is orthologous to a region of human chromosome 7 that is telomeric to the interval commonly deleted in WS (Fig. 1). As such, less rigorous computational analyses have thus far been performed with this mouse sequence. However, since human sequence is available for virtually all of this segment, a routine set of comparative analyses was performed using PipMaker, with the resulting PIPs available athttp://bio.cse.psu.edu/publications/desilva.
DISCUSSION
It is now well-established that the comparative analysis of genomic sequence from different organisms represents a powerful means for identifying conserved coding and noncoding regions, including regulatory elements (Duret and Bucher 1997; Hardison et al. 1997;Hardison 2000; Miller 2000; Wasserman et al. 2000; Cliften et al. 2001;Pennacchio and Rubin 2001; Touchman et al. 2001). With the recent completion of a working-draft sequence of the human genome (International Human Genome Sequencing Consortium 2001; Venter et al. 2001), increasing attention is being given to the sequencing of other organisms (Green 2001). In particular, the sequencing of the mouse genome is now taking center stage (Battey et al. 1999; Denny and Justice 2000), with the recognition that the resulting data will provide both an invaluable infrastructure for performing research with this important experimental animal and the ability to more rigorously annotate the human sequence by comparative analyses (Batzoglou et al. 2000; Bouck et al. 2000).
Indeed, the past few years have brought a sizable crescendo in the generation of mouse genomic sequence, allowing insightful comparisons to be made with the orthologous human sequence. Notable examples of large (e.g., >300 kb) blocks of generated mouse sequence include that from the velocardiofacial syndrome region (∼634 kb; Lund et al. 2000), the Cftr region (∼358 kb; Ellsworth et al. 2000), theBpa/Str region (∼430 kb; Mallon et al. 2000), the region on chromosome 7 containing an imprinted genomic domain (∼1 Mb;Onyango et al. 2000), the region on chromosome 11 containing a cluster of interleukin genes (∼1100 kb; Loots et al. 2000), the region containing the protocadherin gene cluster (∼900 kb; Wu et al. 2001), the cat eye syndrome region (∼450 kb; Footz et al. 2001), the region on chromosome 17 containing a cluster of olfactory receptor genes (∼330 kb; Younger et al. 2001), a segment on mouse chromosome 16 orthologous to the Down's syndrome critical region (∼470 kb;Pletcher et al. 2001), the Fra14A2/Fhit region (∼600 kb; Shiraishi et al. 2001), and the 15 mouse genomic segments orthologous to human chromosome 19 (totaling ∼42 Mb; Dehal et al. 2001); note that a handful of other examples are also cataloged at www.ncbi.nlm.nih.gov/genome/seq/MmProgress.shtml. Together, the generated mouse sequence has played a key role in the establishment and refinement of computational approaches for systematic comparative sequence analysis (Mallon and Strivens 1998; Stojanovic et al. 1999;Batzoglou et al. 2000), with the emergence of tools such asPipMaker (http://bio.cse.psu.edu; Schwartz et al. 2000),VISTA (http://sichuan.lbl.gov/vista; Mayor et al. 2000), and Alfresco (http://www.sanger.ac.uk/Software/Alfresco;Jareborg and Durbin 2000).
The ∼3.3 Mb of sequence reported here for the mouse WS region represents one of the largest and most complete blocks of mouse sequence reported to date. This is particularly the case with respect to the ∼1.4-Mb contiguous segment of finished, high-accuracy sequence. Indeed, in many of the cases listed above, only draft-level mouse sequence has thus far been generated. Our extensive and high-quality data set provided the opportunity to perform detailed computational analyses, with particular emphasis on mouse–human sequence comparisons. Several general findings deserve special mention. First, the order and structure of genes in the mouse and human WS regions are well conserved, with the only exceptions relating to the two large evolutionary inversions illustrated in Figure 1. Second, comparative sequence analysis in conjunction with cDNA/EST comparisons and Genscan predictions has provided strong evidence for the presence of at least nine previously unreported genes within the WS region (see Fig. 3 and below). Finally, numerous conserved noncoding sequences can be readily identified within the human and mouse WS regions; these represent viable candidates for regulatory elements associated with the numerous genes residing in the region or perhaps serve some other biologically important function(s). Of note, during the generation of our mouse sequence data, Martindale et al. (2000)reported the elucidation and analysis of ∼115 kb of sequence from the mouse WS region, specifically a segment encompassing the genesLimk1, Eif4h, Wbscr15, and Rfc2. Their analyses of this portion of the mouse WS region are concordant with the results presented here.
Our experience in analyzing the sequence of the mouse WS region once again illustrates the tremendous value of mouse–human sequence comparisons for annotating genes. Simple comparisons of genomic sequences and collections of cDNA-derived (e.g., EST) sequences often fail to detect certain mRNAs (e.g., those expressed at low levels or in a tissue-restricted fashion). In addition, false-positive results are common, typically due to contaminating genomic sequences amongst the ESTs. However, a combined strategy employing both mouse–human genomic sequence comparisons and genomic-cDNA sequence comparisons provides an efficient and effective path toward the construction of accurate gene models. For example, such a combined approach led to our identification of a previously undetected 5′ terminal exon ofHIP1/Hip1, leading to refined information about the structure of this gene beyond that available in RefSeq. In addition, evidence of mouse–human sequence conservation provided critical clues that directly led to the identification of the nine previously unreported genes in the WS region. Once detected, the conserved regions were more carefully compared to available sequence databases, resulting in the identification of matching full-length cDNA sequences in a majority of cases.
PipMaker is now a well-established program for performing the types of routine comparative sequence analyses mentioned above. The new enhancements to PipMaker reported here should further increase the utility of this tool. In particular, PipMakercan now be used to capture and disseminate the large amount of ancillary information that is routinely generated during the comparative analysis of large blocks of genomic sequence, in essence providing an archive of both the underlying data and a detailed account of any analyses performed with it. This is accomplished through the creation of a PDF-based file that contains both the PIP and links from relevant features of the PIP to specific Internet sites. Such a PDF file can serve as an electronic supplement to a publication, which inevitably can only provide highlights of the comparative analyses being reported (e.g., Figs. 2, 3). Indeed, this is just one facet of the expanding synergy between traditional scientific publishing and the Internet. An alternate approach to this problem was recently described (Wilson et al. 2001), which involves the use of a sequence-alignment viewer that is provided as part of the electronic supplement and downloaded automatically by the Web browser when viewing alignments. An advantage of the Wilson et al. strategy is that it provides greater interactivity to the end-user, for example, allowing access to alignments with nucleotide-level resolution. An advantage ofPipMaker is that it only utilizes features of the PDF language, making the supplemental archive much easier to create and to access.
The region of human chromosome 7q11.23 commonly deleted in WS is of great medical and biological interest because of the relative frequency of the disease (∼1:20,000), the complex and intriguing phenotypic features of WS (Burn 1986; Morris et al. 1988; Bellugi et al. 1990,1999; Lashkari et al. 1999; Mervis et al. 1999; Donnai and Karmiloff-Smith 2000; Mervis and Klein-Tasman 2000; Morris and Mervis 2000), and the involvement of large, duplicated blocks of DNA in the deletional events leading to the syndrome (Perez Jurado et al. 1996;Robinson et al. 1996; Baumer et al. 1998). The mouse sequencing efforts reported here should accelerate research aiming to better understand the genetic basis of WS. First, our data provide a comprehensive resource for characterizing the genes residing within and around the interval commonly deleted in WS. This includes information about gene structure as well as valuable clues about potential regulatory regions. The value of this mouse sequence deserves highlighting in light of the difficult-to-generate and, at present, fragmentary nature of the human sequence for the WS region. Second, our comparative analyses have revealed the presence of at least nine genes that were not previously known to reside within the WS region. Importantly, six of these genes are located within the interval commonly deleted in WS, making each an important candidate to evaluate for its possible role in the disorder. Finally, the mouse sequence we generated should aid the creation of mouse models of WS. Specifically, significant efforts are currently ongoing to create mouse strains completely deleted or hemizygous for one or more genes within the WS region. Our efforts have provided a key infrastructure (i.e., complete genomic sequence) that should greatly facilitate the design of appropriate knockout constructs as well as a set of additional gene targets. In light of the difficulty to date in assigning specific genes to WS-associated phenotypic features, the ability to generate mouse models is regarded as key for untangling the complex genetics of WS.
In a slightly different context, our studies provide insight about the evolution of the WS region and the genes residing therein. Based on our comparative mapping and sequence data, this region has undergone extensive evolutionary changes in the human and/or mouse lineages since their last common ancestor. For example, the genomic complexities (with respect to large, closely spaced duplicated segments) encountered in the human and other great apes are not present in more distantly related mammals, such as the mouse (DeSilva et al. 1999). Interestingly, these duplicated segments reside at the breakpoints associated with an evolutionary inversion, such that the interval commonly deleted in WS has an inverted orientation in the human versus the mouse genome. In addition, there is a second evolutionary inversion associated with a genomic segment residing just telomeric to the WS region; this segment is contiguous with the rest of the WS region in mouse but discontiguous in human. It is interesting to contemplate the steps that produced two evolutionary inversions and one breakpoint within the human and mouse lineages, as discussed by Valero et al. (2000). At a sequence level, there is also evidence for significant divergence between the mouse and human WS regions. Indeed, the overall level of mouse–human sequence conservation across the WS region is atypically low; this is particularly the case for the noncoding (and nonrepetitive) sequence (Table 3), but is also evident for some genes (e.g., Wbscr15/WBSCR15 [Doyle et al. 2000;Martindale et al. 2000] and Pom121/POM121; see Table4).
In summary, our studies show how comparative sequence analysis can simultaneously provide valuable data for addressing problems in both human genetics and genome evolution. Based on this experience and the anticipated surge in the acquisition of genomic sequence for numerous other organisms, one can now readily envision a new era of scientific inquiry, in which sequence-based comparisons drive the study of genome structure, function, and evolution.
METHODS
Mouse Genomic Sequencing
The overlapping set of mouse BAC (Shizuya et al. 1992) and PAC (Ioannou et al. 1994) clones shown in Figure 1 and listed in Table 2were selected from either the contig reported previously (DeSilva et al. 1999; specifically, clones 391O16, 92N10, 303E12, and 42J20 isolated from the Research Genetics CITB-CJ7-B [strain 129SV] mouse BAC library [http://www.resgen.com] and clone P510M19 isolated from the RPCI-21 [strain 129SV] mouse PAC library [http://www.chori.org/bacpac]) or one more recently constructed as part of a larger mouse mapping effort (Thomas et al. 2000; specifically, clones with the prefix ‘RP23’ that were isolated from the RPCI-23 [strain C57BL/6J] mouse BAC library [http://www.chori.org/bacpac; Osoegawa et al. 2000]). Colony-pure clone isolates were subjected to restriction enzyme digest-based fingerprint analysis (Marra et al. 1997), and the resulting data were analyzed with the programs Image and FPC(http://www.sanger.ac.uk/Software; Soderlund et al. 1997, 2000) to assemble BAC/PAC contig maps, which in turn were used to guide the selection of overlapping clones for sequencing. Each selected clone was subjected to shotgun sequencing (Wilson and Mardis 1997; Green 2001), essentially as described previously (DeSilva et al. 2000; Ellsworth et al. 2000; Touchman et al. 2000). Sequences were edited and assembled with the Phred/Phrap/Consedsuite of programs (Ewing et al. 1998; Ewing and Green 1998; Gordon et al. 1998).
Comparative Analyses of Mouse and Human Sequences
The generated mouse sequence reported here was subjected to detailed computational analyses, including comparisons with the orthologous human sequence (when available). Genomic sequence from the human WS region was obtained as follows. The available sequence encompassing the LIMK1-RFC2 interval (Martindale et al. 2000) was supplemented with individual sequence records found by searching the NCBI databases (nr and htgs); most often, these records contained draft-level (as opposed to finished) sequence. In some cases, only small sequence contigs were available. For example, the CLDN3 gene could only be found on a ∼1.6-kb stretch of sequence, with the regions immediately flanking the gene not available for comparison with the mouse sequence.
Mouse and human genomic sequences were compared by constructing a percent-identity plot (Hardison et al. 1997; Ellsworth et al. 2000;Schwartz et al. 2000). Specifically, the generated mouse sequence and available human sequence were subjected to repeat masking with theRepeatMasker program (A.F.A. Smit and P. Green, unpubl. data; seehttp://www.genome.washington.edu/UWGC/analysistools/repeatmask.htm). The human sequence was then aligned relative to the mouse sequence using the BLASTZ component of the PipMakerprogram (http://bio.cse.psu.edu; Schwartz et al. 2000). In the resulting PIP, segments that were ≥50% identical between mouse and human were plotted, with other regions appearing blank. Gaps within an alignment appear as discontinuities between adjacent horizontal lines. Representative portions of the PIP generated with the sequences from the mouse and human WS regions are shown in Figures 2 and 3, with a more complete summary of the PipMaker results available athttp://bio.cse.psu.edu/publications/desilva. Additional information about the range of computational analyses performed is also detailed in Tables 3 and 4.
We thank the staff of the NIH Intramural Sequencing Center (NISC) for their dedicated work in generating the mouse sequence reported here, with special thanks to Michelle Walker, Jyoti Gupta, Sirintorn Stantripop, and Quino Maduro for their efforts in sequence finishing. We also thank the Washington University Genome Sequencing Center for generating the human sequence; Amalia Dutra for FISH studies; Jennifer Munsterteiger for editorial assistance; and Elliott Margulies, Matthew Portnoy, and Arjun Prasad for critical review of the manuscript. This work was supported in part by grant HG02238 (W.M.), grant HG02325-01 (L.E.), and funds for mouse sequencing (E.D.G.) from the National Human Genome Research Institute (NIH).
The publication costs of this article were defrayed in part by payment of page charges. This article must therefore be hereby marked “advertisement” in accordance with 18 USC section 1734 solely to indicate this fact.
Notes
[13] These authors contributed equally to this work.
[14] Present addresses: 5Department of Animal Science, Oklahoma State University, Stillwater, OK 74078, USA; 6Celera Genomics, Rockville, MD 20850, USA.
[15] Corresponding author.
Notes
[16] E-MAIL [email protected]; FAX 301-402-4735.
[17] Article and publication are at http://www.genome.org/cgi/doi/10.1101/gr.214802.
REFERENCES
- ↵M.A. Ansari-LariJ.C. OeltjenS. SchwartzZ. ZhangD.M. MuznyJ. LuJ.H. GorrellA.C. ChinaultJ.W. BelmontW. Miller(1998) Comparative sequence analysis of a gene-rich cluster at human chromosome 12p13 and its syntenic region in mouse chromosome 6. Genome Res. 8:29–40.
- ↵F. AntequeraA. Bird(1993) Number of CpG islands and genes in human and mouse. Proc. Natl. Acad. Sci. 90:11995–11999.
- ↵J. BatteyE. JordanD. CoxW. Dove(1999) An action plan for mouse genomics. Nat. Genet. 21:73–75.
- ↵S. BatzoglouL. PachterJ.P. MesirovB. BergerE.S. Lander(2000) Human and mouse gene structure: Comparative analysis and application to exon prediction. Genome Res. 10:950–958.
- ↵A. BaumerF. DutlyD. BalmerM. RiegelT. TukelM. Krajewska-WalasekA.A. Schinzel(1998) High level of unequal meiotic crossovers at the origin of the 22q11.2 and 7q11.23 deletions. Hum. Mol. Genet. 7:887–894.
- ↵D. BayarsaihanF.H. Ruddle(2000) Isolation and characterization of BEN, a member of the TFII-I family of DNA-binding proteins containing distinct helix-loop-helix domains. Proc. Natl. Acad. Sci. 97:7342–7347.
- ↵U. BellugiA. BihrleT. JerniganD. TraunerS. Doherty(1990) Neuropsychological, neurological, and neuroanatomical profile of Williams syndrome. Am. J. Med. Genet. 6:115–125.
- ↵U. BellugiL. LichtenbergerD. MillsA. GalaburdaJ.R. Korenberg(1999) Bridging cognition, the brain and molecular genetics: Evidence from Williams syndrome. Trends Neurosci. 22:197–207.
- ↵J.B. BouckM.L. MetzkerR.A. Gibbs(2000) Shotgun sample sequence comparisons between mouse and human genomes. Nature Genet. 25:31–33.
- ↵J. Burn(1986) Williams syndrome. J. Med. Genet. 23:389–395.
- ↵Chiaromonte, F., Yang, S., Elnitski, L., Yap, V.B., Miller, W., and Hardison, R.C. 2001. Association between divergence and interspersed repeats in mammalian noncoding genomic DNA. Proc. Natl. Acad. Sci., in press..
- ↵P.F. CliftenL.W. HillierL. FultonT. GravesT. MinerW.R. GishR.H. WaterstonM. Johnston(2001) Surveying Saccharomyces genomes to identify functional elements by comparative DNA sequence analysis. Genome Res. 11:1175–1186.
- ↵P. DehalP. PredkiA.S. OlsenA. KobayashiP. FoltaS. LucasM. LandA. TerryC.L. Ecale ZhouS. Rash(2001) Human chromosome 19 and related regions in mouse: Conservative and lineage-specific evolution. Science 293:104–111.
- ↵O. de LuisM.C. ValeroL.A. Perez Jurado(2000) WBSCR14, a putative transcription factor gene deleted in Williams-Beuren syndrome: Complete characterisation of the human gene and the mouse ortholog. Eur. J. Hum. Genet. 8:215–222.
- ↵P. DennyM.J. Justice(2000) Mouse as the measure of man? Trends Genet. 16:283–287.
- ↵U. DeSilvaH. MassaB.J. TraskE.D. Green(1999) Comparative mapping of the region of human chromosome 7 deleted in Williams syndrome. Genome Res. 9:428–436.
- ↵U. DeSilvaE. MillerA. GorlachC.B. FosterE.D. GreenS.J. Chanock(2000) Molecular characterization of the mouse p47-phox (Ncf1) gene and comparative analysis of the mouse p47-phox (Ncf1) gene to the human NCF1 gene. Mol. Cell Biol. Res. Commun. 3:224–230.
- ↵D. DonnaiA. Karmiloff-Smith(2000) Williams syndrome: From genotype through to the cogntive phenotype. Am. J. Med. Genet. 97:164–171.
- ↵J.L. DoyleU. DeSilvaW. MillerE.D. Green(2000) Divergent human and mouse orthologs of a novel gene (WBSCR15/Wbscr15) reside within the genomic interval commonly deleted in Williams syndrome. Cytogenet. Cell Genet. 90:285–290.
- ↵L. DuretP. Bucher(1997) Searching for regulatory elements in human noncoding sequences. Curr. Opin. Struct. Biol 7:399–406.
- ↵R.E. EllsworthD.C. JamisonJ.W. TouchmanS.L. ChissoeV.V. Braden MaduroG.G. BouffardN.L. DietrichS.M. Beckstrom-SternbergL.M. IyerL.A. Weintraub(2000) Comparative genomic sequence analysis of the human and mouse cystic fibrosis transmembrane conductance regulator genes. Proc. Natl. Acad. Sci. 97:1172–1177.
- ↵A.K. EwartC.A. MorrisD. AtkinsonW. JinK. SternesP. SpalloneA.D. StockM. LeppertM.T. Keating(1993) Hemizygosity at the elastin locus in a developmental disorder, Williams syndrome. Nat. Genet. 5:11–16.
- ↵B. EwingP. Green(1998) Base-calling of automated sequencer traces using Phred. II. error probabilities. Genome Res. 8:186–194.
- ↵B. EwingL. HillierM.C. WendlP. Green(1998) Base-calling of automated sequencer traces using Phred. I. accuracy assessment. Genome Res. 8:175–185.
- ↵M.J. FazioM.-G. MatteiE. PassageM.-L. ChuD. BlackE. SolomonJ.M. DavidsonJ. Uitto(1991) Human elastin gene: New evidence for localization to the long arm of chromosome 7. Am. J. Hum. Genet. 48:696–703.
- ↵J. FlintC. TufarelliJ. PedenK. ClarkR.J. DanielsR. HardisonW. MillerS. PhilipsenK.C. Tan-UnT. McMorrow(2001) Comparative genome analysis delimits a chromosomal domain and identifies key regulatory elements in the α globin cluster. Hum. Mol. Genet. 10:371–382.
- ↵T.K. FootzP. Brinkman-MillsG.S. BantingS.A. MaierM. AliriaziM.A. RiaziL. BridglandS. HuB. BirrenS. Minoshima(2001) Analysis of the cat eye syndrome critical region in humans and the region of conserved synteny in mice: A search for candidate genes at or near the human chromosome 22 pericentromere. Genome Res. 11:1053–1070.
- ↵U. Francke(1999) Williams-Beuren syndrome: Genes and mechanisms. Hum. Mol. Genet. 8:1947–1954.
- ↵U. FranckeC.-L. HsiehB.E. FoellmerK.J. LomaxH.L. MalechT.L. Leto(1990) Genes for two autosomal recessive forms of chronic granulomatous disease assigned to 1q25 (NCF2) and 7q11.23 (NCF1). Am. J. Hum. Genet. 47:483–492.
- ↵J.M. FrangiskakisA.K. EwartC.A. MorrisC.B. MervisJ. BertrandB.F. RobinsonB.P. KleinG.J. EnsingL.A. EverettE.D. Green(1996) LIM-kinase1 hemizygosity implicated in impaired visuospatial constructive cognition. Cell 86:59–69.
- Y. FrankeR.J. PeoplesU. Francke(1999) Identification of GTF2IRD1, a putative transcription factor within the Williams-Beuren syndrome deletion at 7q11.23. Cytogenet. Cell Genet. 86:296–304.
- ↵D. GordonC. AbajianP. Green(1998) Consed: A graphical tool for sequence finishing. Genome Res. 8:195–202.
- ↵A. GorlachP.L. LeeJ. RoeslerP.J. HopkinsB. ChristensenE.D. GreenS.J. ChanockJ.T. Curnutte(1997) A p47-phox pseudogene carries the most common mutation causing p47– phox-deficient chronic granulomatous disease. J. Clin. Invest. 100:1907–1918.
- ↵E.D. Green(2001) Strategies for the systematic sequencing of complex genomes. Nat. Rev. Genet. 2:573–583.
- ↵G.G. HabetsR.A. van der KammenV. WillemsenM. BalemansJ. WiegantJ.G. Collard(1992) Sublocalization of an invasion-inducing locus and other genes on human chromosome 7. Cytogenet. Cell Genet. 60:200–205.
- ↵E. HallbergR.W. WozniakG. Blobel(1993) An integral membrane protein of the pore membrane domain of the nuclear envelope contains a nucleoporin-like region. J. Cell. Biol. 122:513–521.
- ↵R.C. Hardison(2000) Conserved noncoding sequences are reliable guides to regulatory elements. Trends Genet. 16:369–372.
- ↵R.C. HardisonJ. OeltjenW. Miller(1997) Long human–mouse sequence alignments reveal novel regulatory elements: A reason to sequence the mouse genome. Genome Res. 7:959–966.
- ↵E.L. HockenhullM.J. CaretteK. MetcalfeD. DonnaiA.P. ReadM. Tassabehji(1999) A complete physical contig and partial transcript map of the Williams syndrome critical region. Genomics 58:138–145.
- ↵C.C. HoogenraadB.H.J. EussenA. LangeveldR. van HaperenS. WinterbergC.H. WoutersF. GrosveldC.I. De ZeeuwN. Galjart(1998) The murine CYLN2 gene: Genomic organization, chromosome localization, and comparison to the human gene that is located within the 7q11.23 Williams syndrome critical region. Genomics 53:348–358.
- ↵International Human Genome Sequencing Consortium (2001) Initial sequencing and analysis of the human genome. Nature 409:860–921.
- ↵P.A. IoannouC.T. AmemiyaJ. GarnesP.M. KroiselH. ShizuyaC. ChenM.A. BatzerP.J. de Jong(1994) A new bacteriophage P1-derived vector for the propagation of large human DNA fragments. Nat. Genet. 6:84–89.
- ↵S.H. JacksonH.L. MalechC.A. KozakK.J. LomaxJ.I. GallinS.M. Holland(1994) Cloning and functional expression of the mouse homologue of p47phox. Immunogenetics 39:272–275.
- ↵D.M. JadayelL.R. OsborneL.J.A. CoignetV.J. ZaniL.-C. TsuiS.W. SchererM.J.S. Dyer(1998) The BCL7 gene family: Deletion of BCL7B in Williams syndrome. Gene 224:35–44.
- ↵N. JareborgR. Durbin(2000) Alfresco—a workbench for comparative genomic sequence analysis. Genome Res. 10:1148–1157.
- ↵N. JareborgE. BirneyR. Durbin(1999) Comparative analysis of noncoding regions of 77 orthologous mouse and human gene pairs. Genome Res. 9:815–824.
- ↵J. KawaiA. ShinagawaK. ShibataM. YoshinoM. ItohY. IshiiT. ArakawaA. HaraY. FukunishiH. Konno(2001) Functional annotation of a full-length mouse cDNA collection. Nature 409:685–690.
- ↵B.F. KoopL. Hood(1994) Striking sequence similarity over almost 100 kilobases of human and mouse T-cell receptor DNA. Nat. Genet. 7:48–53.
- ↵J.R. KorenbergX.-N. ChenH. HirotaZ. LaiU. BellugiD. BurianB. RoeR. Matsuoka(2000) VI. Genome structure and cognitive map of Williams syndrome. J. Cog. Neurosci. 12:89–107.
- ↵J.E. LamerdinS.A. StilwagenM.H. RamirezL. StubbsA.V. Carrano(1996) Sequence analysis of the ERCC2 gene regions in human, mouse, and hamster reveals three linked genes. Genomics 34:399–409.
- ↵A. LashkariA.K. SmithJ.M. Graham Jr.(1999) Williams-Beuren syndrome: An update and review for the primary physician. Clin. Pediatr. 38:189–208.
- ↵Y. LiangA. WangI.A. BelyantsevaD.W. AndersonF.J. ProbstT.D. BarberW. MillerJ.W. TouchmanL. JinS.L. Sullivan(1999) Characterization of the human and mouse unconventional myosin XV genes responsible for hereditary deafness DFNB3 and Shaker 2. Genomics 61:243–258.
- ↵G.G. LootsR.M. LocksleyC.M. BlankespoorZ.E. WangW. MillerE.M. RubinK.A. Frazer(2000) Identification of a coordinate regulator of interleukins 4, 13, and 5 by cross-species sequence comparisons. Science 288:136–140.
- ↵D.J. LoskutoffM. LindersJ. KeijerH. VeermanH. van HeerikhuizenH. Pannekoek(1987) Structure of the human plasminogen activator inhibitor 1 gene: Nonrandom distribution of introns. Biochem. 26:3763–3768.
- ↵X. LuX. MengC.A. MorrisM.T. Keating(1998) A novel human gene, WSTF, is deleted in Williams syndrome. Genomics 54:241–249.
- ↵J. LundF. ChenA. HuaB. RoeM. BudarfB.S. EmanuelR.H. Reeves(2000) Comparative sequence analysis of 634 kb of the mouse chromosome 16 region of conserved synteny with the human velocardiofacial syndrome region on chromosome 22q11.2. Genomics 63:374–383.
- ↵W. MakalowskiM.S. Boguski(1998) Evolutionary parameters of the transcribed mammalian genome: An analysis of 2,820 orthologous rodent and human sequences. Proc. Natl. Acad. Sci. 95:9407–9412.
- ↵W. MakalowskiJ. ZhangM.S. Boguski(1996) Comparative analysis of 1196 orthologous mouse and human full-length mRNA and protein sequences. Genome Res. 6:846–857.
- ↵A.-M. MallonM. Strivens(1998) DNA sequence analysis and comparative sequencing. Methods 14:160–178.
- ↵A.-M. MallonM. PlatzerR. BateG. GloecknerM.R.M. BotcherbyG. NorksiekM.A. StrivensP. KioschisA. DangelD. Cunningham(2000) Comparative genome sequence analysis of the Bpa/Str region in mouse and man. Genome Res. 10:758–775.
- ↵M.A. MarraT.A. KucabaN.L. DietrichE.D. GreenB. BrownsteinR.K. WilsonK.M. McDonaldL.W. HillierJ.D. McPhersonR.H. Waterston(1997) High throughput fingerprint analysis of large-insert clones. Genome Res. 7:1072–1084.
- ↵D.W. MartindaleM.D. WilsonD. WangR.D. BurkeX. ChenV. DuronioB.F. Koop(2000) Comparative genomic sequence analysis of the Williams syndrome region (LIMK1-RFC2) of human chromosome 7q11.23. Mamm. Genome 11:890–898.
- ↵C. MayorM. BrudnoJ.R. SchwartzA. PoliakovE.M. RubinK.A. FrazerL.S. PachterI. Dubchak(2000) VISTA: Visualizing global DNA sequence alignments of arbitrary length. Bioinformatics 16:1046–1047.
- ↵X. MengX. LuZ. LiE.D. GreenH. MassaB.J. TraskC.A. MorrisM.T. Keating(1998a) Complete physical map of the common deletion region in Williams syndrome and identification and characterization of three novel genes. Hum. Genet. 103:590–599.
- ↵X. MengX. LuC.A. MorrisM.T. Keating(1998b) A novel human gene FKBP6 is deleted in Williams syndrome. Genomics 52:130–137.
- ↵C.B. MervisB.P. Klein-Tasman(2000) Williams syndrome: Cognition, personality, and adaptive behavior. Ment. Retard. Dev. Disabil. Res. Rev. 6:148–158.
- ↵C.B. MervisB.F. RobinsonJ.R. Pani(1999) Cognitive and behavioral genetics '99: Visuospatial construction. Am. J. Hum. Genet. 65:1222–1229.
- ↵W. Miller(2000) So many genomes, so little time. Nat. Biotechnol. 18:148–149.
- ↵C.A. MorrisC.B. Mervis(2000) Williams syndrome and related disorders. Annu. Rev. Genomics Hum. Genet. 1:461–484.
- ↵C.A. MorrisS.A. DemseyC.O. LeonardC. DiltsB.L. Blackburn(1988) Natural history of Williams syndrome: Physical characteristics. J. Pediatr. 113:318–326.
- ↵T. NakayamaR. MatsuokaM. KimuraH. HirotaK. MikoshibaY. ShimizuN. ShimizuK. Akagawa(1998) Hemizygous deletion of the HPC-1/syntaxin 1A gene (STX1A) in patients with Williams syndrome. Cytogenet. Cell Genet. 82:49–51.
- ↵J.C. OeltjenT.M. MalleyD.M. MuznyW. MillerR.A. GibbsJ.W. Belmont(1997) Large-scale comparative sequence analysis of the human and murine Bruton's tyrosine kinase loci reveals conserved regulatory domains. Genome Res. 7:315–329.
- ↵P. OnyangoW. MillerJ. LehoczkyC.T. LeungB. BirrenS. WheelanK. DewarA.P. Feinberg(2000) Sequence and comparative analysis of the mouse 1-megabase region orthologous to the human 11p15 imprinted domain. Genome Res. 10:1697–1710.
- ↵L.R. Osborne(1999) Williams-Beuren syndrome: Unraveling the mysteries of a microdeletion disorder. Molec. Genet. Metab. 67:1–10.
- ↵L. OsborneB. Pober(2001) Genetics of childhood disorders: XXVII. genes and cognition in Williams syndrome. J. Am. Acad. Child Adolesc. Psychiatry 40:732–735.
- ↵L.R. OsborneD. MartindaleS.W. SchererX.-M. ShiJ. HuizengaH.H.Q. HengT. CostaB. PoberL. LewJ. Brinkman(1996) Identification of genes from a 500-kb region at 7q11.23 that is commonly deleted in Williams syndrome patients. Genomics 36:328–336.
- ↵L.R. OsborneJ.-A. HerbrickT. GreavetteH.H.Q. HengL.-C. TsuiS.W. Scherer(1997a) PMS2-related genes flank the rearrangement breakpoints associated with Williams syndrome and other diseases on human chromosome 7. Genomics 45:402–406.
- ↵L.R. OsborneS. SoderX.-M. ShiB. PoberT. CostaS.W. SchererL.-C. Tsui(1997b) Hemizygous deletion of the syntaxin 1A gene in individuals with Williams syndrome. Am. J. Hum. Genet. 61:449–452.
- L.R. OsborneT. CampbellA. DaradichS.W. SchererL.-C. Tsui(1999) Identification of a putative transcription factor gene (WBSCR11) that is commonly deleted in Williams-Beuren syndrome. Genomics 57:279–284.
- ↵A. OshimaJ.W. KyleR.D. MillerJ.W. HoffmannP.P. PowellJ.H. GrubbW.S. SlyM. TropakK.S. GuiseR.A. Gravel(1987) Cloning, sequencing, and expression of cDNA for human beta-glucuronidase. Proc. Natl. Acad. Sci. 84:685–689.
- ↵K. OsoegawaM. TatenoP.Y. WoonE. FrengenA.G. MammoserJ.J. CataneseY. HayashizakiP.J. de Jong(2000) Bacterial artificial chromosome libraries for mouse sequencing and functional analysis. Genome Res. 10:116–128.
- ↵T. PapernaR. PeoplesY.-K. WangP. KaplanU. Francke(1998) Genes for the CPE receptor (CPETR1) and the human homolog of RVP1 (CPETR2) are localized within the Williams-Beuren syndrome deletion. Genomics 54:453–459.
- ↵L.A. PennacchioE.M. Rubin(2001) Genomic strategies to identify mammalian regulatory sequences. Nat. Rev. Genet. 2:100–109.
- ↵R. PeoplesL. Perez-JuradoY.-K. WangP. KaplanU. Francke(1996) The gene for replication factor C subunit 2 (RFC2) is within the 7q11.23 Williams syndrome deletion. Am. J. Hum. Genet. 58:1370–1373.
- ↵R.J. PeoplesM.J. CiscoP. KaplanU. Francke(1998) Identification of the WBSCR9 gene, encoding a novel transcriptional regulator, in the Williams-Beuren syndrome deletion at 7q11.23. Cytogenet. Cell Genet. 82:238–246.
- ↵R. PeoplesY. FrankeY.-K. WangL. Perez-JuradoT. PapernaM. CiscoU. Francke(2000) A physical map, including a BAC/PAC clone contig, of the Williams-Beuren syndrome-deletion region at 7q11.23. Am. J. Hum. Genet. 66:47–68.
- ↵L.A. Perez JuradoR. PeoplesP. KaplanB.C.J. HamelU. Francke(1996) Molecular definition of the chromosome 7 deletion in Williams syndrome and parent-of-origin effects on growth. Am. J. Hum. Genet. 59:781–792.
- ↵L.A. Perez JuradoY.-K. WangR. PeoplesA. ColomaJ. CrucesU. Francke(1998) A duplicated gene in the breakpoint regions of the 7q11.23 Williams-Beuren syndrome deletion encodes the initiator binding protein TFII-1 and BAP-135, a phosphorylation target of BTK. Hum. Mol. Genet. 7:325–334.
- ↵L.A. Perez JuradoY.-K. WangU. FranckeJ. Cruces(1999) TBL2, a novel transducin family member in the WBS deletion: Characterization of the complete sequence, genomic structure, transcriptional variants and the mouse ortholog. Cytogenet. Cell Genet. 86:277–284.
- ↵M.T. PletcherT. WiltshireD.E. CabinM. VillanuevaR.H. Reeves(2001) Use of comparative physical and sequence mapping to annotate mouse chromosome 16 and human chromosome 21. Genomics 74:45–54.
- ↵K. ReichwaldJ. ThiesenT. WieheJ. WeitzelW.H. StratlingP. KioschisA. PoustkaA. RosenthalM. Platzer(2000) Comparative sequence analysis of the MECP2-locus in human and mouse reveals new transcribed regions. Mamm. Genome 11:182–190.
- ↵W.P. RobinsonJ. WaslynkaF. BernasconiM. WangD. ClarkD. KotzotA. Schinzel(1996) Delineation of 7q11.2 deletions associated with Williams-Beuren syndrome and mapping of a repetitive sequence to within and to either side of the common deletion. Genomics 34:17–23.
- ↵S.W. SchererE.J. NeufeldP.M. LievensS.H. OrkinJ. KimL.-C. Tsui(1993) Regional localization of the CCAAT displacement protein gene (CUTL1) to 7q22 by analysis of somatic cell hybrids. Genomics 15:695–696.
- ↵S. SchwartzZ. ZhangK.A. FrazerA. SmitC. RiemerJ. BouckR. GibbsR. HardisonW. Miller(2000) PipMaker—A web server for aligning two genomic DNA sequences. Genome Res. 10:577–586.
- ↵E.A. ShephardC.N. PalmerH.J. SegallI.R. Phillips(1992) Quantification of cytochrome P450 reductase gene expression in human tissues. Arch. Biochem. Biophys. 294:168–172.
- ↵T. ShiraishiT. DruckK. MimoriJ. FlomenbergL. BerkH. AlderW. MillerK. HuebnerC.M. Croce(2001) Sequence conservation at human and mouse orthologous common fragile regions, FRA3B/FHIT and Fra14A2/Fhit. Proc. Natl. Acad. Sci. 98:5722–5727.
- ↵H. ShizuyaB. BirrenU.-J. KimV. MancinoT. SlepakY. TachiiriM. Simon(1992) Cloning and stable maintenance of 300-kilobase-pair fragments of human DNA in Escherichia coli using an F-factor-based vector. Proc. Natl. Acad. Sci. 89:8794–8797.
- ↵C. SoderlundI. LongdenR. Mott(1997) FPC: A system for building contigs from restriction fingerprinted clones. Comput. Appl. Biosci. 13:523–535.
- ↵C. SoderlundS. HumphrayA. DunhamL. French(2000) Contigs built with fingerprints, markers, and FPC V4.7. Genome Res. 10:1772–1787.
- ↵N. StojanovicL. FloreaC. RiemerD. GumucioJ. SlightomM. GoodmanW. MillerR. Hardison(1999) Comparison of five methods for finding conserved sequences in multiple alignments of gene regulatory regions. Nucleic Acids Res. 27:3899–3910.
- ↵M. TassabehjiK. MetcalfeW.D. FergussonM.J.A. CaretteJ.K. DoreD. DonnaiA.P. ReadC. ProschelN.J. GutowskiX. Mao(1996) LIM-kinase deleted in Williams syndrome. Nat. Genet. 13:272–273.
- ↵M. TassabehjiM. CaretteC. WilmotD. DonnaiA.P. ReadK. Metcalfe(1999) A transcription factor involved in skeletal muscle gene expression is deleted in patients with Williams syndrome. Eur. J. Hum. Genet. 7:737–747.
- ↵J.W. ThomasT.J. SummersS.-Q. Lee-LinV.V. Braden MaduroJ.R. IdolS.D. MastrianJ.F. RyanD.C. JamisonE.D. Green(2000) Comparative genome mapping in the sequence-based era: Early experience with human chromosome 7. Genome Res. 10:624–633.
- ↵S. ToddJ.R. McGillJ.L. McCombsC.M. MooreI. WeiderS.L. Naylor(1989) cDNA sequence, interspecies comparison, and gene mapping analysis of argininosuccinate lyase. Genomics 4:53–59.
- ↵J.W. TouchmanY. AniksterN.L. DietrichV.V. Braden MaduroG. McDowellV. ShotelersukG.G. BouffardS.M. Beckstrom-SternbergW.A. GahlE.D. Green(2000) The genomic region encompassing the nephropathic cystinosis gene (CTNS): Complete sequencing of a 200-kb segment and discovery of a novel gene within the common cystinosis-causing deletion. Genome Res. 10:165–173.
- ↵J.W. TouchmanA. DehejiaO. Chiba-FalekD.E. CabinJ.R. SchwartzB.M. OrrisonM.H. PolymeropoulosR.L. Nussbaum(2001) Human and mouse α-synuclein genes: Comparative genomic sequence analysis and identification of a novel gene regulatory element. Genome Res. 11:78–86.
- ↵M.C. ValeroO. de LuisJ. CrucesL.A. Perez Jurado(2000) Fine-scale comparative mapping of the human 7q11.23 region and the orthologous region on mouse chromosome 5G: The low-copy repeats that flank the Williams-Beuren syndrome deletion arose at breakpoint sites of an evolutionary inversion(s). Genomics 69:1–13.
- ↵M. van DuinJ.E. PolmanC.C. VerkoelenH. BunschotenJ.H. MeyerinkW. OlijveR.J. Aitken(1992) Cloning and characterization of the human sperm receptor ligand ZP3: Evidence for a second polymorphic allele with a different frequency in the Caucasian and Japanese populations. Genomics 14:1064–1070.
- ↵J.C. VenterM.D. AdamsE.W. MyersP.W. LiR.J. MuralG.G. SuttonH.O. SmithM. YandellC.A. EvansR.A. Holt(2001) The sequence of the human genome. Science 291:1304–1351.
- ↵Y.-K. WangC. Harryman SamosR. PeoplesL.A. Perez-JuradoR. NusseU. Francke(1997) A novel human homologue of the Drosophila frizzled wnt receptor gene binds wingless protein and is in the Williams syndrome deletion at 7q11.23. Hum. Mol. Genet. 6:465–472.
- ↵Y.-K. WangL.A. Perez-JuradoU. Francke(1998) A mouse single-copy gene, Gtf2i, the homolog of human GTF2I, that is duplicated in the Williams-Beuren syndrome deletion region. Genomics 48:163–170.
- ↵Y.-K. WangR. SporleT. PapernaK. SchughartU. Francke(1999) Characterization and expression pattern of the frizzled gene Fzd9, the mouse homolog of FZD9 which is deleted in Williams-Beuren syndrome. Genomics 57:235–248.
- ↵W.W. WassermanM. PalumboW. ThompsonJ.W. FickettC.E. Lawrence(2000) Human–mouse genome comparisons to locate regulatory sites. Nature Genet. 26:225–228.
- ↵N. WedemeyerR. PeoplesH. HimmelbauerH. LehrachU. FranckeE.E. Wanker(1997) Localization of the human HIP1 gene close to the elastin (ELN) locus on 7q11.23. Genomics 46:313–315.
- ↵M.D. WilsonC. RiemberD.W. MartindaleP. SchnupfA.P. BorightT.L. CheungD.M. HardyS. SchwartzS.W. SchererL.-C. Tsui(2001) Comparative analysis of the gene-dense ACHE/TFR2 region on human chromosome 7q22 with the orthologous region on mouse chromosome 5. Nucleic Acids Res. 29:1352–1365.
- ↵R.K. WilsonE.R. Mardis(1997) Shotgun sequencing. in Genome analysis: A laboratory manual. Analyzing DNA, ed B. Birren(Cold Spring Harbor Laboratory Press, Cold Spring Harbor, New York), 1:397–454.
- ↵Q. WuT. ZhangJ.-F. ChengY. KimJ. GrimwoodJ. SchmutzM. DicksonJ.P. NoonanM.Q. ZhangR.M. Myers(2001) Comparative DNA sequence analysis of mouse and human protocadherin gene clusters. Genome Res. 11:389–404.
- ↵K.S. WydnerJ.L. SechlerC.D. BoydH.C. Passmore(1994) Use of an intron length polymorphism to localize the tropoelastin gene to mouse chromosome 5 in a region of linkage conservation with human chromosome 7. Genomics 23:125–131.
- ↵X. YanX. ZhaoM. QianN. GuoX. GongX. Zhu(2000) Characterization and gene structure of a novel retinoblastoma-protein-associated protein similar to the transcription regulator TFII-I. Biochem. J. 345:749–757.
- ↵R.M. YoungerC. AmadouG. BethelA. EhlersK.F. LindahlS. ForbesR. HortonS. MilneA.J. MungallJ. Trowsdale(2001) Characterization of clustered MHC-linked olfactory receptor genes in human and mouse. Genome Res. 10:519–530.