
Abstract
For nearly a century, genetic analysis in Drosophila melanogaster has been a powerful tool for analyzing gene function, yet Drosophila lacks the molecular genetic mapping tools that recently have revolutionized human, mouse, and plant genetics. Here, we describe the systematic characterization of a dense set of molecular markers in Drosophila by using a sequence tagged site-based physical map of the genome. We identify 474 biallelic markers in standard laboratory strains of Drosophila that span the genome. Most of these markers are single nucleotide polymorphisms and sequences for these variants are provided in an accessible format. The average density of the new markers is one per 225 kb on the autosomes and one per megabase on the X chromosome. We include in this survey a set of P-element strains that provide additional use for high-resolution mapping. We show one application of the new markers in a simple set of crosses to map a mutation in the hedgehog gene to an interval of <1 Mb. This new map resource significantly increases the efficiency and resolution of recombination mapping and will be of immediate value to the Drosophila research community.
The development of genome-based tools for genetic mapping has made possible increasingly sophisticated genetic studies in many eukaryotes and has contributed to rapid increases in the rate of discovery of new genes and gene functions. In particular, dense maps of polymorphic markers are in use in humans (Wang et al. 1998; Cargill et al. 1999) and mice (Lindblad-Toh et al. 2000), and currently are being developed in many other vertebrates. Similar resources have been deployed in well-studied and genetically powerful model organisms, including Saccharomyces cerevisiae (Winzeler et al. 1998),Arabidopsis thaliana (Cho et al. 1999), andCaenorhabditis elegans (Koch et al. 2000). It is clear that a dense map of molecular markers is now an important tool for genetic analyses in any organism.
Traditional strategies for meiotic recombination mapping inDrosophila melanogaster rely on a chromosome carrying multiple dominant or recessive marker mutations with visible phenotypes. These visible phenotypes are often laborious to score and may interfere with the phenotype of the mutant of interest. Most importantly, because mutations with easily scored, viable phenotypes are relatively infrequent, the mapping resolution available using this approach is limited. A much higher degree of interstrain variation is available at the molecular level, and modern methods for scoring molecular variants offer the advantages of high throughput and automated scoring (Landegren et al. 1998). In addition, the alleles of such markers are co-dominant and usually phenotypically neutral. Although microsatellites exist in Drosophila, they occur infrequently and show relatively low rates of polymorphism (Schug et al. 1997). By far the most common types of molecular variation are single nucleotide polymorphisms and insertion/deletion polymorphisms, hereafter collectively referred to as single nucleotide polymorphisms (SNPs). The interstrain level of sequence polymorphism in Drosophila is relatively high (Begun and Aquadro 1993; Moriyama and Powell 1996). Thus, sufficient variation exists in Drosophila to develop a high-density map. Recently, a set of 69 SNP markers in a collection of strains used for quantitative trait loci (QTL) mapping purposes was described (Teeter et al. 2000).
We describe here the systematic discovery of a set of genome-wide SNP markers in a collection of commonly used laboratory strains ofDrosophila, and we provide the sequences of these markers in an accessible format that allows immediate use by the research community. We also show the use of this resource by mapping a mutation in the hedgehog gene to a small interval.
RESULTS
Survey of Interstrain Polymorphism
We first evaluated several Drosophila strains for levels of sequence polymorphism. Many strains are in use in theDrosophila research community, and there are no widely used standard mapping strains. We therefore selected a few strains with the aim of identifying strains highly polymorphic relative to each other. The polymorphism rate in Drosophila varies among specific strain pairs, with the greatest variation observed between East African and other populations (Begun and Aquadro 1993). Therefore, strain selection might significantly affect the rate of SNP discovery. We also wanted to use a series of strains containing single mapped P-element insertions for fine-scale mapping (Cutforth and Rubin 1994; Spradling et al. 1995). Thus, another important consideration in our strain selection was the level of sequence polymorphism relative to these P-element strains.
Using genomic DNA from six wild-type strains (Barcelona, Capetown, Hikone, Pyrenees, w;iso2;iso3, and a P-element containing strain) as templates, we compared sequences from 24 third chromosome sequence tagged sites (STSs) from the P1-based physical map of the genome (Kimmerly et al. 1996). The results shown in Table1 indicate that the rate of sequence variation between any two strains ranges from 2.1 per kilobase (1 polymorphism/476 bp) to 5.2 per kilobase (1 polymorphism/192 bp, Table1A), in agreement with previous studies. Although the rate of sequence polymorphism varies depending on the strains compared, much of the observed polymorphism occurs in local clusters, a single STS containing as many as five SNPs. For purposes of genetic mapping, one needs only a single polymorphism per point in the genome. Thus, for the purposes of this study, a better measure of the interstrain polymorphism rate is the percentage of STSs that contain at least one SNP (Table 1B). Although the absolute polymorphism rate observed varies nearly 2.5-fold, from 2.1 differences/kb to 5.2 differences/kb, the percentage of polymorphic STSs varies less than twofold, from 33% to 63%. In addition, the polymorphism rates relative to the P-element containing strain vary less, ranging from 33% to 50%. Because we observed a largely random distribution of sequence variation and similar levels of relative polymorphism among pairwise sets of strains, we chose to focus our genome-wide discovery efforts on three commonly used strains- Canton S, Oregon R, and w; iso2; iso3. We also selected a series of 17 strains that contain single P-element insertions at evenly spaced intervals across the genome.
Analysis of Sequence Variation among Six Wild-Type

|
[i] Twenty-four STSs from the third chromosome were sequenced in the following strains: w;iso2;iso3 (ISO), Barcelona (BAR), Capetown (CAP), Hikone (HIK), Pyrenees (PYR), and a P-element strain (BEP). The total amount of sequence examined was 5.16 kb. Data are represented as (A) total number of polymorphisms per kilobase, and (B) percentage of STSs containing polymorphisms.
Genome-Wide SNP Discovery
We set out to identify a set of SNP markers spanning the genome, with a goal of identifying at least one SNP every 500 kb. We used mapped STSs as a source of genomic sequences (Kimmerly et al. 1996). At the time this project was initiated, these STSs were the only mapped sequence elements with a genome-wide distribution of the required density. The cytological map positions of STSs were inferred from the P1 clones from which they were derived. We chose STSs evenly distributed across each cytological division for screening. We took two approaches to polymorphism identification. First, a set of 1016 STSs was amplified from isogenized versions of Canton S and Oregon R and then sequenced to identify candidate polymorphisms. Second, a partially overlapping set of ∼1050 STSs was screened for polymorphisms between w;iso2;iso3 and the 17 P-element strains by using denaturing high performance liquid chromatography (DHPLC; Underhill et al. 1997). DHPLC is a simple and robust screening tool and is also useful for genotyping SNPs in recombination mapping experiments (see Fig. 2 below;Spiegelman et al. 2000). Polymorphisms identified via DHPLC were verified and characterized by DNA sequencing.
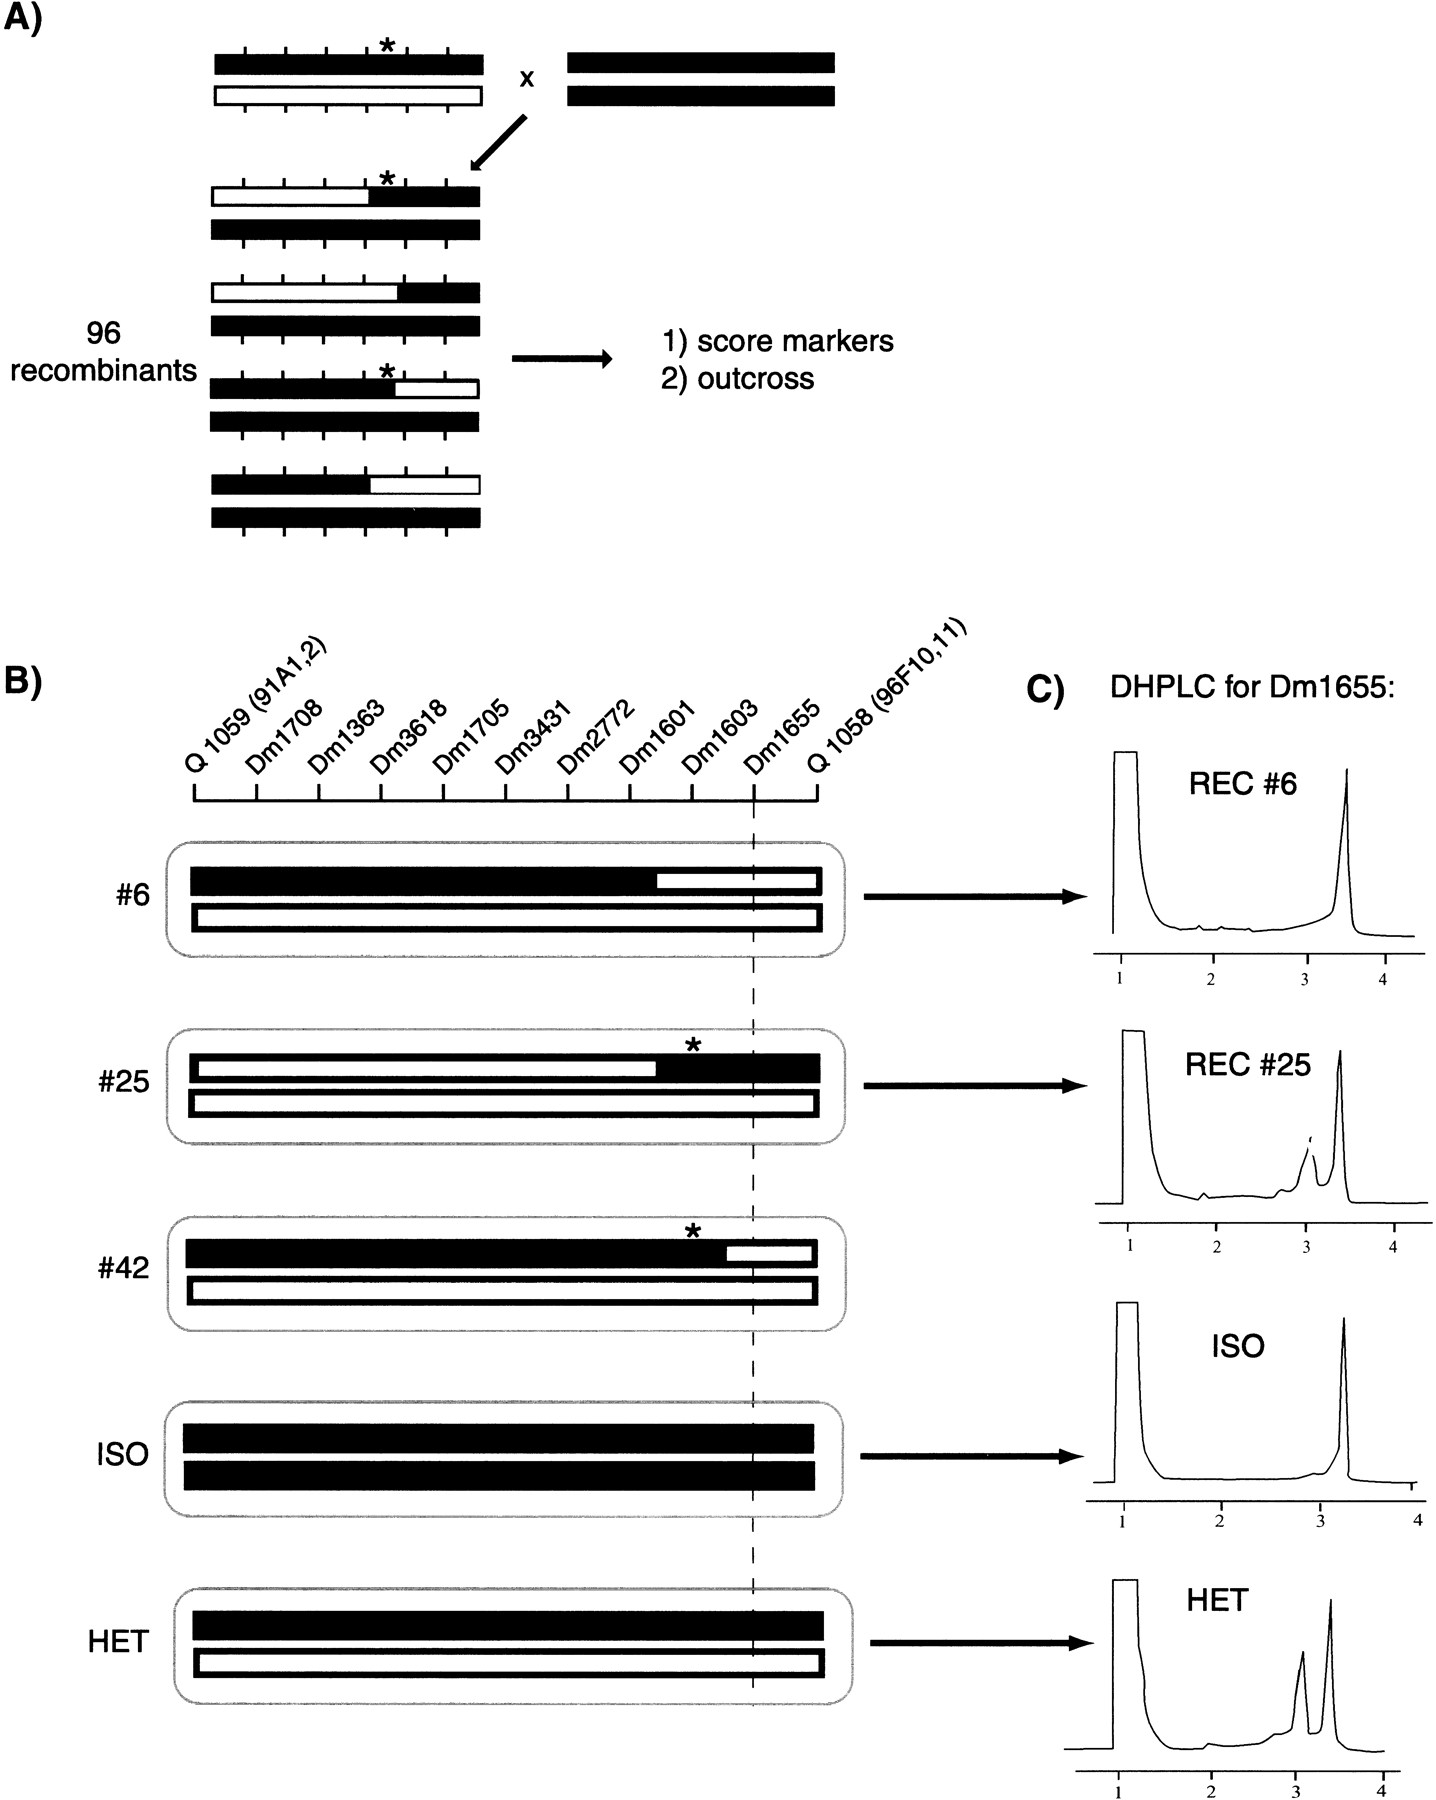
Recombination mapping of a recessive lethal mutation by using SNP markers. Chromosomes (bars) and molecular markers (vertical hatch marks) are shown. The mapping process occurs in two stages. (A) The mutation (asterisk) induced in the w;iso2;iso3 background (black bar) that has been mapped previously to a chromosome and balanced is mapped relative to a polymorphic mapping strain (open bar). Single flies heterozygous for the mutation-carrying chromosome and the mapping chromosome are crossed to flies homozygous for the parental w;iso2;iso3 strain to generate 96 recombinant flies. The four recombinant classes are represented. Each recombinant fly strain is assayed for a low-density set of markers that span the chromosome. These markers can be of any type, including SNPs or P-element insertions. We have typically tested six markers spaced at ∼10-Mb intervals on these 96 recombinants, for a total of 576 assays. Each recombinant also is assayed for presence or absence of the mutation by outcrossing. From the outcross data and initial marker data on this set of 96 recombinants, the mutation can be assigned to an interval of 10–20 Mb. (B) A higher density set of SNPs then is assayed on recombinants from A that break in the appropriate interval. An example of mapping a mutation in the hedgehog gene is shown. SNP markers are indicated by the STSs from which they are derived. Two P elements (Q 1059 and Q 1058) that were used to localize these mutations also are indicated. The chromosomal compositions of three recombinant (#6, #25, and #42) and two control (ISO and HET) flies are represented. Asterisks indicate chromosomes that carry the mutation as defined by outcrossing. The SNP markers shown were scored using DHPLC. The recombinants shown delimit the position of these mutations to between Dm1601 and Dm1655, a region of ∼984 kb. Subsequent complementation testing showed that these mutations are alleles of thehedgehog gene, which lies between Dm1601 and Dm1655. (C) DHPLC scoring of SNPs. PCR products were amplified from recombinants and analyzed under partially denaturing conditions. Data are shown for Dm1655, a C/T dimorphism. Run time in minutes is shown on the X axis and ultraviolet absorbance on the Y axis. Dm1655 was analyzed from the following strains: w;iso2;iso3 (ISO), a w;iso2;iso3/Q1059 heterozygote (HET), and hedgehogrecombinants 6 and 25 (#6 and #25). In this example, the sample from recombinant 25 shows a heteroduplex pattern and therefore is scored as a heterozygote. (DHPLC) denaturing high performance liquid chromatography.
Sequence data from a total of ∼1500 STSs from these two discovery approaches were assembled into a single data set. We identified polymorphisms both by visual inspection and automatically as high-quality discrepancies by using Phred quality scores in the Phrap assembly viewer Consed (Gordon et al. 1998). Table 2displays the sequences of 109 STSs for which sequence was derived from all strains used in the genome-wide survey. In addition, we aligned each consensus STS sequence to the Release 1 version of theDrosophila genome sequence to identify the allele in they;cn bw sp strain (Adams et al. 2000). These data define 279 polymorphisms, of which 225 are single nucleotide substitutions, 17 are small insertion/deletions, 8 are dinucleotide substitutions, and 29 are more complex substitutions. Among the single nucleotide substitutions, transitions outnumber transversions by 55% to 45%, and ∼22% of these substitutions occur at CpG dinucleotides. These data are similar to those observed in human and mouse genomes and may be evidence that similar mutagenic mechanisms are at work in Drosophila(Moriyama and Powell 1996), despite the fact that there is no deficit of CpG dinucleotides and little evidence for cytosine methylation that explains the bias seen in vertebrate genomes (Hacia et al. 1999). Note that the STSs analyzed here represent randomly sampled genomic sequence, so this analysis does not take into account effects of coding versus noncoding sequence. Approximately 40% of these SNPs create restriction site polymorphisms and thus are accessible to scoring by a simple restriction digestion (Table 2). In addition to the sequences provided in Table 2, the sequences for 365 STSs that define an additional ∼750 polymorphisms in pairwise subsets of the strains are available at http://www.fruitfly.org.
List of SNP Sequences Identified
| X CHROMOSOME | ||||||||||
| STS | Cytological location | Flanking sequence | Nucleotide position | Oregon R | Canton S | w:iso2:iso3 | P strain 1 Q1028 | P strain 2 | Release 1 v:cnbwsp | RFLP? |
| Dm3513 | 1F1–1F3 | TCACT−GGAAC | 78 | G(42) | C(42) | G(46) | G(51) | G | ||
| GGACA−CTCAA | 90 | G(42) | A(44) | G(35) | G(35) | G | Alul | |||
| ACCCA−ACACT | 144 | C(42) | A(44) | C(56) | C(56) | C | ||||
| ACAAA−ATGGG | 174 | A(47) | T(44) | A(40) | A(35) | A | ||||
| Dm1729 | 2B8–2B9 | GAGCT−CTCGA | 477 | T(56) | C(56) | T(40) | T(42) | T | Sacl | |
| Dm0127 | 2F1–2F6 | GTCGT−AGGGG | 1447 | C(37)AGT(40) | C(40)AGG(56) | C(30)AGT(42) | (A/C,22)AGG(33) | AAGG | ||
| CGCTC−CGCTC | 1450 | C(56) | T(43) | C(32) | C(35) | C | Acil BsrBl | |||
| Dm0106 | 3A6 | TCTGT−GAACG | 122, 125 | G(37)TGA(37) | A(56)TGG(42) | G(45)TGA(34) | A(35)TGG(34) | ATGG | ||
| Q1028 | 3D–E | Q1028 | Q1034 | |||||||
| Dm3247 | 4C7–4C8 | AGTTT−CTGCG | 1607 | T(42) | C(56) | C(24) | C/T(22) | C/T(11) | T | |
| CAGTC−GTGAA | 1628 | C(37) | G(37) | G(25) | G(28) | C/G(23) | C | |||
| GTGAA−ACGCC | 1634 | C(51) | T(44) | T(25) | C/T(19) | T/C(37) | C | |||
| GTTTT−CCGAA | 1766 | C(56) | T(56) | T(44) | T(42) | T(20) | C | |||
| Dm1954 | 4E1 | ACAAT−ATCGA | 149 | T(45) | A(56) | A(42) | T(56) | T(40) | T | Tsp5091 |
| Dm3001 | 5C1–5C2 | AATTC−GGATC | 695 | G(27) | G(35) | A(41) | G/A(22) | G(30) | G | |
| TCCAA–ACTTT | 704 | T(37) | T(41) | G(50) | T(30) | T(33) | T | |||
| ATTTT−ACAAT | 888 | T(30) | C(56) | T(42) | C(34) | C(42) | C | |||
| Q1034 | 6E | Q1034 | Q1030 | |||||||
| Dm2006 | 7A2–7A5 | CCCAG−ACATG | 582 | T(56) | C(45) | T(30) | T/C(26) | T/C(17) | T | Rsal |
| TACCT−CCCCC | 618 | DEL(56) | C(56) | DEL(98) | DEL(98) | DEL(98) | DEL | |||
| TCTTG−C | 624 | C(37) | C(46) | C(31) | A/C(26) | A/C(33) | C | |||
| C−CAATC | 626 | G(40) | A(45) | G(20) | G(42) | G(42) | G | |||
| ACTCG−CCAGC | 647 | A(40) | A(35) | A(42) | A/T(30) | A/T(29) | A | Taql BspGl | ||
| Dm1849 | 7D10–7D16 | GGTT−TCCCT | 180 | A(30) | A(51) | T(28) | T(28) | T(28) | A | |
| Dm0426 | 8C1–8C2 | CATAT−TA | 1223 | A(51) | A(51) | A(42) | G/A(24) | G/A(28) | A | |
| TA−GTACA | 1226–7 | T(51)G(42) | T(51)G(42) | T(44)G(42) | T/C(17), G/A(17) | T/C(18), G/A(18) | TA | |||
| ACATA−GTACT | 1234 | T(56) | T(56) | T(48) | C/T(17) | C/T(11) | T | Ndel Rsal SnaBl | ||
| TACTT−ATGTTG | 1241 | G(42) | A(51) | G(42) | A(40) | A(42) | A | Msel | ||
| ACAAC−TACAA | 1352 | T(40) | T(40) | T(42) | A/T(23) | A/T(14) | T | |||
| Dm3169 | 8D1–8D5 | GCCGC−CACGA | 1280 | T(45) | T(40) | T(44) | C/T(13) | C/T(19) | T | BsrBl |
| CCCGT−TGCTC | 1373 | G(37) | A(29) | G/A(37) | G/A(30) | G/A(39) | G | |||
| Dm1980 | 9B1–9B2 | GGTGA−TTCAC | 35 | A(48) | C(40) | C(40) | C(40) | C(40) | C | EcoRl Tsp5091 |
| ATCTA−CAAAA | 62 | A(51) | A(43) | T(40) | A(40) | A(45) | T | |||
| GCAAA−CATAA | 95, 98, 101 | A(51)TTA(51)AAG(56) | C(45)TTC(51)AAA(56) | C(35)TTC(40)AAA(40) | C(29)TTC(34)AAA(25) | C(29)TTC(27)AAA(27) | CTTCAAA | Msel Tsp5091 | ||
| Q1030 | 10E | Q1030 | Q1035 | |||||||
| Dm3746 | 10F7–10F8 | TACAC−TCTCT | 79–80 | G(51)C(51) | A(51)A(51) | G(40)C(40) | A(45)A(46) | A(35)A(35) | AA | |
| TCACA−CCGTA | 137 | G(42) | T(43) | G(35) | T(44) | T(37) | T | |||
| Dm2024 | 11B1–11B2 | GAAC(A)9−(A)5GAT | 172 | A(47) | C(44) | A | C(56) | C(42) | C | |
| Q1035 | 13E9 | Q1035 | ||||||||
| Dm0478 | 13A8–13A9 | TGGCA−TTGGC | 70 | A(40) | A(51) | G(35) | A(39) | A | Munl Tsp5091 | |
| AGACT−TAGTT | 145 | A(45) | A(45) | C(35) | A(37) | A | Bfal | |||
| STS | Cytological location | Flanking sequence | Relative nucleotide position | Oregon R | Canton S | w:iso2:iso3 | P strain 1 Q1028 | P strain 2 | Release 1 v:cnbwsp | RFLP? |
| Dm3491 | 13D1–E4 | CATTG−CCGCC | 60 | T(46) | T(46) | C(46) | T(39) | T | Ecll | |
| CACTG−ACGAG | 170 | A(56) | G(40) | A(35) | A(35) | A | BspGl | |||
| Dm1911 | 14B3–14B4 | TGAAT−GAATG | 1134 | A(46)C(42) | A(40)C(37) | G(43)T(40) | G(21)T/C(21) | GT | ||
| Dm3790 | 15B1–15B2 | TGTGC−CTTAA | 106 | C(44) | A(45) | A(37) | C(50) | C | ApaLl CviRl | |
| ACTAT−CGCCT | 221 | C(40) | T(40) | T(40) | T(45) | T | Acil Ecil | |||
| Dm0509 | 16F5–16F8 | GAGGG−CCGCT | 58 | G(37) | T(45) | G(37) | T(40) | T | Haelll Siml | |
| Q1035 | 17C | |||||||||
| Dm1846 | 17A1–17A2 | ATTTC−ACTTG | 2150 | A(37) | C(45) | A(42) | A(46) | C | ||
| Dm2754 | 17B5–17C4 | AGTAG−GTATG | 402 | C(35) | C(38) | C(56) | T(34) | C | ||
| CATTT−CAGCG | 423 | C(33) | T(42) | C(40) | T(22) | C | ||||
| TGCGG−TTCTC | 444 | G(42) | T(38) | G(40) | T/G(34) | GT | ||||
| CAAAA−ACCGG | 465 | A(34) | A(34) | T(56) | T(26) | T | ||||
| CCGTT−GCTAA | 512 | T(27) | T(35) | T(40) | C(51) | C | ||||
| Dm0505 | 19E1–19E3 | GCTGC−TGGCT | 90 | A(42) | A(42) | A(30) | A(30) | A | CviRl NIallI | |
| CGGAG−ATATG | 170 | C(44) | T(56) | C(56) | C(37) | C | Ndel | |||
| ATATA−TATTG | 190 | A(56) | A(42) | A(42) | A(42) | A | ||||
| Dm0529 | 20B1–20B2 | GGCTC−GTGTC | 837 | G(45) | T(45) | T(42) | G(56) | G | ||
| 2nd Chromosome | ||||||||||
| STS | Cytological location | Flanking sequence | Relative nucleotide position | Oregon R | Canton S | w:iso2:iso3 | P strain 1 Q1037 | P strain 2 | Release 1 y:cnbwsp | RFLP? |
| Dm0447 | 21D1–21D2 | TCTCT−ACGGC | 449 | C(37) | C(40) | C(42) | T(17) | C | ||
| TCTCT−GACCT | 485, 487 | C(32)TT(32) | *(98)T*(98) | *(98)T*(98) | *(98)T*(98) | CTT | ||||
| Dm0375 | 21E3–21F3 | TACGG−AGTGT | 32 | A(29) | A(27) | G(30) | A(27) | A | BscGl | |
| GTCGC−CTGGT | 103 | C(32) | C(33) | A(21) | C(37) | C | ||||
| Q1037 | 22D1–D2 | Q1037 | Q1040 | |||||||
| Dm2641 | 23A1–23A3 | ACTTG−CCCAG | 32 | A(40) | A(51) | G(56) | A(47) | A(42) | G | Siml Haelll |
| TCCAT−AAGAA | 107 | G(56) | G(56) | A(48) | A(48) | A(46) | G | Nialll | ||
| GGCCA−CGGCT | 174 | G(35) | A(40) | G(37) | G(37) | G(35) | A | Acil | ||
| Dm0611 | 23E1–23E4 | ACAAA−CTTTA | 133, 135 | A(56)AC(42) | T(45)AG(40) | T(51)AG(45) | T(45)AG(45) | T(51)AG(51) | TAG | Alul |
| ATCTT−TATAG | 153 | C(48) | C(46) | T(56) | C(46) | C(46) | C | |||
| ACTCG−TGTGT | 169 | C(51) | C(51) | C(27) | G(56) | G(56) | C | |||
| GCCAC−CAGTT | 186 | T(45)G(45) | C(51)C(51) | T(34)G(34) | T(40)G(45) | T(51)G(51) | CC | CviRl Pstl | ||
| Dm2235 | 25A3 | TATTA−AAATC | 141 | ND | ND | G(48) | A(42) | A(37) | A | Msel |
| CATAT−GATAT | 156–163 | DEL(98) | DEL(98) | DEL(98) | TATAATAT(42) | TATAATAT(42) | TATAATAT | Ndel | ||
| GTAAT−ATTGT | 174 | A(40) | T(35) | T(56) | A(40) | A(42) | A | |||
| ATTGG−TTG | 233 | T(56) | T(56) | T(56) | C(44) | C(56) | T | |||
| TTG−AGTAA | 237–238 | G(56)A(56) | G(56)A(56) | G(56)A(56) | T(42)T(40) | T(42)T(40) | GA | |||
| Dm2207 | 26D1–26D2 | TCCGT−TCCAG | 28 | G(51) | G(51) | G(40) | A(45) | A(45) | G | BspGl |
| TCTTC−GT | 118 | G(56) | T(56) | T(42) | G(44) | G(43) | G | |||
| GT−TAGTT | 121 | G(51) | A(56) | A(37) | G(35) | G(40) | G | |||
| CGTCC−AGACG | 148 | T(51) | C(51) | C(40) | C(46) | C(46) | T | Bfal | ||
| AGGTA−TCGTT | 163 | G(40) | G(45) | G(40) | C(40) | C(45) | G | Rsal | ||
| Dm3015 | 29A2 | AACTG−CTTTT | 23 | T(40) | C(56) | T(34) | T(35) | C(42) | C | |
| TGTTT−AAAGT | 114 | A(56) | G(56) | A(44) | A(56) | G(56) | G | Dral Msel | ||
| AACAC−CGGTT | 147 | T(39) | A(56) | T(35) | T(39) | A(38) | A | |||
| CAACC−GGTGC | 171 | T(31) | A(32) | A/T(14) | A(56) | A(42) | A | |||
| Dm0274 | 29A5–29B4 | GGTAC−CGGTA | 741 | G(29) | G(35) | G(38) | T(42) | G(37) | Acil Thal | |
| TTAAT−CAATT | 805 | G(40) | G(42) | G(51) | A(44) | G(42) | CviRl | |||
| GCCGA−AGGTG | 832 | C(40) | C(40) | C(42) | T(46) | C(56) | T | |||
| STS | Cytological location | Flanking sequence | Relative nucleotide position | Oregon R | Canton S | w:iso2:iso3 | P strain 1 | P strain 2 | Release 1 y:cnbwsp | RFLP? |
| Q1040 | 29C1–C2 | Q1040 | Q1042 | |||||||
| Dm0434 | 30A3–30A6 | TTTTT−AACAT | 73–75 | A(35)A(35)A(35) | T(35)A(35)A(34) | A(21)A(27)A(27) | T(21)T(27)T(29) | T(4)T(4)T(4) | TAA | |
| TAGGC−AAAAA | 113–114 | A(56)A(56) | A(47)C(47) | A(13)A(13) | DEL(98) | DEL(98) | AC | |||
| Dm0652 | 31F3–32A1 | AGCAA−CGAAA | 742–743 | C(9)A(9) | C(37)A(37) | C(24)A(24) | T(46)T(33) | C(24)A(25) | CA | Bsbl |
| AGTTT−AACGA | 821 | A(51) | A(51) | A(42) | G(42) | A(26) | A | Dral Msel Pmel | ||
| TTATG−AATGC | 900 | G(51) | G(56) | G(44) | C(37) | G(42) | G | CviRl | ||
| TACAA−TTGTC | 929 | C(51) | T(56) | T(48) | T(13) | T(44) | T | Tsp5091 | ||
| Dm4048 | 32A1–32A2 | CATAC−TTAGA | 113 | T(56) | A(56) | A(42) | A(35) | T(42) | A | |
| GGTTG−CGATA | 168 | C(46) | G(42) | G(37) | G(35) | C(35) | G | |||
| Dm3374 | 33A1–33A2 | GATAT−GCAGT | 733 | T(51) | G(40) | G(44) | G(42) | T(44) | G | CviRl |
| TCCCA−CGGAT | 758–759 | A(29)A(42) | G(34)T(42) | G(42)T(42) | G(26)T(35) | A(24)A(46) | GT | |||
| TAAAA−GAAAT | 769 | T(47) | C(51) | C(56) | C(42) | T(44) | C | |||
| GCATT−ACACA | 802 | G(40) | A(51) | A(56) | A(33) | G(33) | A | Msel | ||
| CACAG−GAA | 809 | C(37) | T(56) | T(44) | T(42) | C(33) | T | |||
| GAA−GTACG | 813 | T(42) | A(56) | A(42) | A(51) | T(42) | A | |||
| Dm2112 | 33A1–33A2 | TAAAA−TTATG | 67 | T(35) | G(42) | T(56) | T(56) | G(45) | T | Tsp5091 |
| AACAT−AATCG | 104 | A(42) | T(45) | A(56) | A(56) | A(42) | A | |||
| GAGAA−AGCGG | 125 | A(56) | G(51) | A(42) | A(46) | G(42) | A | BsrBl | ||
| Dm0240 | 33A3–33A8 | ATGTG−GTGCA | 514 | C(24) | C(24) | T(56) | C(37) | C(47) | T | |
| CATAT−TTTGG | 546 | DEL(27) | DEL(52) | DEL(48) | GTAT(44) | DEL(33) | DEL | Ndel | ||
| Dm2479 | 33D4 | ATAGT−GGCAA | 75 | A(17) | A(40) | A(40) | A(45) | T(40) | ||
| TTTTC−CATTG | 110 | G(37) | G(56) | G(44) | G(56) | T(44) | G | |||
| Dm3635 | 34C1–34C2 | CCGCA−AATGC | 1494 | C(27) | C(27) | T(40) | C(44) | C(42) | T | |
| GCTTG−ATAAA | 1552 | A(27) | G(14) | A(42) | A(56) | G(42) | A | |||
| AAAAT−TAAGA | 1560 | G(33) | T(13) | G(56) | G(44) | T(29) | G | Msel Tsp5091 | ||
| Dm0393 | 34D1–34D6 | TAACA−TAATT | 50 | A(42) | A(42) | T(37) | A(33) | A(37) | A | Msel Vspl |
| ACTGC−GTGAG | 191–192 | T(46)C(33) | A(42)A(42) | A(48)A(56) | A(29)A(29) | T(38)C(38) | TC | BssSl CvlRl | ||
| Dm0012 | 35A1–35A2 | AATTT−TAAAG | 74 | T(42) | G(23) | T(42) | G(51) | T(44) | T | Dral Msel |
| Q1042 | 35E1–E2 | Q1042 | Q1805 | |||||||
| Dm0043 | 35F1–35F2 | GATGG−CAGTC | 60 | A(30) | A | A(35) | A(40) | T(37) | A | |
| Dm2451 | 36B3–36C1 | TCCTT−AGACA | 108 | G(40) | A(45) | G(44) | A(56) | A(32) | G | Aflll Msel |
| AGAAT−AA | 125 | T(51) | C(45) | T(40) | C(56) | C(56) | T | |||
| AA−AGT | 128, 130 | A(40)AT(40) | T(45)AA(51) | A(45)AT(56) | T(56)AA(51) | T(56)AA(40) | AAT | |||
| AGT−AAT | 134 | T(40) | C(56) | T(45) | C(51) | C(38) | T | |||
| AAT−CCCAA | 138–139, 141, 143, 145 |
*(98)G(56)T*(98)T*
(98)TC(40) | A(45)T(45)TA(45) TA(51)TT(56) |
*(98)G(56)T*(98)T*
(98)TC(56) | A(45)T(45)TA(51) TA(40)TT(40) | A(56)T(56)TA(46) TA(38)TT(40) | *GT*T*TC | |||
| TCAAA−GTGAA | 157 | C(42) | T(56) | C(51) | T(56) | T(56) | C | Tall | ||
| GTGAA−GTACT | 163–164 | A(42)T(42) | *(38)*(38) | A(56)T(56) | *(98)*(98) | *(98)*(98) | AT | Scal | ||
| Dm0353 | 39A3–39A7 | CTGCT−CAGCT | 26 | G(40) | A(51) | G(40) | A(42) | A(42) | G | CvlRl Patl |
| TTCCG−GTATC | 41 | A(51) | C(40) | C(42) | C(42) | C(37) | C | Acil Thal | ||
| CTCGA−ACAGC | 60 | C(47) | T(45) | C(40) | C(42) | C/T(21) | C | |||
| CTGTG−TTTTC | 85 | G(51) | A(42) | A(51) | A(51) | A(56) | A | |||
| TGGGA−AAATC | 212 | A(56) | A(56) | A(56) | T(42) | A(47) | A | |||
| Dm0627 | 40A6–40B2 | GCAAT−TCTGA | 304 | A(33) | T(56) | T(25) | T(51) | T(40) | T | Tsp5091 |
| Dm0975 | 41C1–41C6 | GCGTG−CGTGC | 140–143 | *** *(40) | *** *(40) | CGTG(51) | *** *(51) | *** *(40) | *** * | |
| Dm3495 | 42A1–42A2 | CGGGG–CTTGT | 83 | G(56) | T(37) | G(35) | G(51) | G/T(17) | T | Siml |
| CGAGA−GTCAG | 132 | T(45) | C(46) | T(20) | C(16) | C(19) | C | Aatll Tall | ||
| Dm2609 | 42A8–42A16 | TTTTT−AAATT | 77–78 | *(43)A(40) | T(47)A(40) | T(56)A(56) | T(56)T(56) | T(56)A(23) | *A | |
| Dm2106 | 42B4–42C2 | ACCGA−GCTAC | 114 | A(56) | G(45) | G(39) | G(25) | A(22) | A | Alul |
| AGTTT−TAAGC | 140 | C(51) | C(51) | T(56) | C(56) | C(56) | C | Msel | ||
| AGCAG−AGTCC | 148 | G(56) | G(56) | A(34) | G(34) | G(32) | G | |||
| TGCGA−GGAGA | 160 | C(46) | C(46) | T(35) | C(34) | C(35) | C | Bccl | ||
| GCTTT−ACAGG | 176 | C(42) | C(51) | T(39) | C(40) | C(40) | C |
| STS | Cytological location | Flanking sequence | Relative nucleotide position | Oregon R | Canton S | w:iso2:iso3 | P strain 1 | P strain 2 | Release 1 v:cnbwsp | RFLP? |
| Q1805 | 43E9 | Q1805 | Q1049 | |||||||
| Dm0735 | 43E12–43F2 | CCAAG−TGCGC | 74 | C(51) | T(40) | C(40) | T(34) | T(34) | T | Alul |
| ATCTA−GACAT | 97 | C(42) | T(46) | C(40) | C(45) | C(36) | T | Pfl1108l | ||
| Dm0746 | 44B1 | GTATC−GTTCT | 140–145 | GCACGG(51) | *** **T(56) | GCACGG(33) | GCACGG(40) | GCACGG(51) | GCACGG | BscGl |
| Dm2209 | 44D1–44D2 | CAATA−AAGTA | 128 | A(45) | G(51) | A(26) | G/A(10) | G(29) | G | |
| TATCA−AACAT | 155 | A(46) | G(40) | A(35) | G/A(16) | G(32) | G | |||
| Dm0722 | 44D5–44E2 | CACCG−TTACT | 101, 104 | G(56)TTT(51) | *(41)TTC(45) | G(32)TTC(14) | G/*(11)TTC/T(11) | *(39)TTC(40) | *TTC | Mspl PinAl |
| Dm3845 | 46B1–46B2 | TTTTT−AATAC | 159 | A(39) | C(51) | A(51) | C(35) | C | Dral Msel | |
| Dm0340 | 47D6–47E2 | GCGAA−TTTTA | 205 | T(28) | A(32) | T(37) | T(40) | T(40) | T | |
| Dm0084 | 48C5–48D2 | CTCAT−CAGCT | 762 | T(56) | T(51) | T(56) | C(35) | T(49) | T | |
| TTATT−GAGAG | 772 | C(51) | C(56) | A(44) | C(42) | C(47) | C | Taql | ||
| TAAGT−ATTTC | 808 | A(51) | G(51) | G(40) | G(40) | G(40) | A | Tsp509l | ||
| TGAGA−GCCGA | 866 | C(51) | C(51) | C(40) | C(42) | T(40) | C | |||
| Q1049 | 49D1–D3 | Q1049 | Q1047 | |||||||
| Dm2480 | 50A3–50A4 | CCTAA−GACGT | 1032 | A(51) | DEL(51) | DEL(53) | A(35) | A(33) | A | |
| TATCC−ACAAC | 1060 | C(37) | T(37) | T(51) | C(44) | C(42) | C | |||
| Dm0064 | 50C23–50D1 | TTTAC−TTTCT | 119 | A(37) | T(31) | A(40) | A(31) | A(37) | A | |
| GCTAA−TTACT | 140 | G(33) | A(29) | G(40) | A(40) | A(40) | G | Tsp509l | ||
| TATTA−TACAT | 154 | T(40) | A(30) | T(43) | A(35) | A(42) | T | Msel Vspl | ||
| TTTTT−AAAAA | 164 | G(9)T(13) | A(36)A(36) | G(35)T(50) | G(27)A(44) | G(42)A(44) | GT | Dral Msel | ||
| Dm3709 | 51E10–51E11 | AGAAT−GAATC | 83, 85, 87–90 | C(35)AG(35)AATAA(42) | *(98)A*(98)A*** *(98) | *A*A*** * | C(31)AG(29)AATAA(35) | C(35)AG(35)AATAA(37) | CAGAATAA | |
| Dm0788 | 51E5–51E8 | AAAAA−CAACA | 1012 | C(40) | T(51) | T(33) | C(26) | C(42) | C | |
| Dm2663 | 51E5–51E8 | TCATT−TTTTT | 156 | A(42) | G(22) | G(36) | A(42) | A(42) | A | |
| Dm0754 | 52B1–52B2 | AATCA−ATATA | 916 | C(33) | T(51) | T(37) | T(44) | T(46) | C | |
| Dm2192 | 54A2–54B1 | AAATG−TGGTT | 608 | T(56) | G(56) | T(42) | G(37) | G(51) | T | |
| ATTTC−GGAAT | 639 | G(51) | C(42) | G(32) | G(48) | G(51) | G | BspEl Mspl | ||
| Dm2427 | 54C3–54C11 | TCGCT−CCTAC | 185 | T(42) | A(53) | T(36) | T(45) | T(40) | T | |
| Dm3490 | 54E8–54F2 | AGTGT−TTTTT | 169 | T(44) | *(56) | T(56) | T(56) | T(46) | A | |
| Dm0851 | 55A2–55B1 | GAGTT−CGAGT | 737 | G(56) | A(42) | A(35) | A(40) | A(17) | A | |
| Dm1720 | 55A2–55B1 | ACTGG−GAAAA | 251 | G(56) | A(48) | G(35) | G(27) | G(14) | G | |
| TAAGT−TGCCA | 271 | C(40) | C(45) | C(21) | G(35) | G(38) | C | |||
| Dm2631 | 55A2–55B1 | TTTTA−TTGCG | 161 | T(46) | T(51) | T(20) | G(56) | G/T(11) | T | |
| TGCCA−CATCG | 179 | T(40) | C(37) | T(34) | T(34) | T/C(28) | T | |||
| Q1047 | 57A3 | Q1047 | ||||||||
| Dm0602 | 56B1–56B2 | ATCCC−CCGGT | 80 | T(44) | G(40) | T(23) | T(44) | T | Acil | |
| GGATT−CTC | 95 | A(37) | G(56) | A(35) | A(33) | A | ||||
| CTC−TTCT | 99 | T(33) | C(56) | T(42) | T(33) | T | ||||
| TTCT−GGCAG | 104 | T(56) | G(56) | T(42) | T(35) | T | ||||
| GGTGT−TTCCG | 152 | A(56) | G(56) | A(50) | A(40) | A | ||||
| CTGGG−CACCT | 178 | C(40) | A(56) | C(42) | C(40) | C | Haeill | |||
| AGTTC−GTTTG | 221 | T(56) | C(56) | T(37) | T(17) | T | ||||
| Dm0800 | 56B1–56B2 | AAAA−TAAAA | 1298 | T(42) | T(40) | A(51) | T(45) | A | ||
| TTTAT−AAGTG | 1319 | T(31) | A(42) | T(45) | T(33) | T | Msel | |||
| CTAGG−AATAT | 1336, 1339 | A(29)TAC(25) | A(43)TAC(17) | T(40)TAA(51) | A(12)TAC(24) | TTAA | Msel | |||
| AATAT−ATATA | 1345 | G(32) | C(35) | G(51) | G(29) | G | ||||
| ATAGT−GCAAC | 1364 | A(10) | A(29) | G(45) | A(15) | G | ||||
| Dm0824 | 57A4–57A6 | GAGCT−GGCGC | 64 | G(42) | T(42) | G(44) | T(42) | T | ||
| TATAT−CAGCT | 198, 200 | A(51)TT(42) | *(51)T*(51) | A(51)TT(51) | *(98)T*(98) | *T* | ||||
| Dm0063 | 57E2–57E8 | TTAGC−TAAAC | G(35) | G(45) | G(34) | G |
| STS | Cytological location | Flanking sequence | Relative nucleotide position | Oregon R | Canton S | w:iso2:iso3 | P strain 1 | P strain 2 | Release 1 y:cnbwsp | RFLP? |
| Q1047 | 57A3 | Q1047 | ||||||||
| Dm2274 | 58A4 | CCCCC−TTTTC | 129–138 | TATTTTCCCG(42) | GA*** *** **(56) | AATTTTCTCG(56) | GA*** *** **(30) | T | BscGl | |
| Dm1544 | 58B10–58C4 | GGTGA−GGTAT | 99 | C(19) | C(51) | C(42) | C/T(13) | C | Bccl | |
| GTGGT−AACGA | 144 | A(33) | A(56) | G(56) | G/A(17) | A | ||||
| Dm1639 | 58F2–58F7 | TTCCA−CGGAT | 87, 90 | A(40)ATC(39) | G(35)ATT(56) | A(35)ATC(37) | A(40)ATC(40) | AATC | BspEl Mspl | |
| ATGAT−GGTTT | 175 | C(40) | G(56) | C(56) | C(30) | C | Dpnl Sau3Al Bccl | |||
| Dm2101 | 59A1–59A3 | AGTAA−TAGAA | 690 | T(11) | T(45) | G(42) | A(37) | T | Tsp509l | |
| ACTTC−TTACT | 811 | A(40) | G(51) | T(42) | G(42) | |||||
| CAGCC−CTGGA | 858 | G(22) | T(37) | G(40) | T(32) | G | Acll | |||
| Dm2487 | 59F2 | TATCT−ATACT | 49 | A(40) | G(45) | A(40) | A(33) | A | ||
| ATTCC−AACAA | 71 | A(46) | A(45) | G(51) | A(30) | G | ||||
| AGGCA−GCGAT | 107 | T(51) | C(39) | T(42) | T(42) | T | Niaill Sphl Thal | |||
| CAGAC−CCGCA | 173 | A(40) | G(35) | G(40) | G(35) | G | ||||
| CAGCA−ACGGA | 182 | G(33) | C(43) | C(56) | C(42) | C | ||||
| Dm0327 | 60B2–60B10 | TATGTGTG−TGTGTGCT | 100–101 | T(39)A(39) | DEL(98) | DEL(98) | DEL(98) | TA | ||
| Dm2247 | 60D10–60D11 | TTCGG−GGGCG | 158 | C(42) | T(56) | T(44) | T(42) | C | Acll | |
| 3rd Chromosome | ||||||||||
| STS | Cytological location | Flanking sequence | Relative nucleotide position | Oregon R | Canton S | w:iso2:iso3 | P strain 1Q1050 | P strain 2 | Release 1 y:cnbwsp | RFLP? |
| Dm2467 | 61C1–61C2 | ATCTT−ACTGG | 219 | T(45) | T(46) | T(29) | A(22) | A | Msel | |
| CTGTC−TTTTT | 235 | *(56) | T(48) | T(27) | T(30) | |||||
| Dm0688 | 61D1–61D2 | AATTT−GGAGA | 203 | A(51) | C(56) | A | C | A | ||
| AGAAT−TGGAA | 252 | G(51) | C(51) | G | C | G | ||||
| Q1050 | 62B4–62B5 | Q1050 | Q1052 | |||||||
| Dm3835 | 62F1–62F2 | CAACA−GCTAA | 202 | G(40) | G(42) | G(42) | A(44) | A(42) | G | |
| Dm2200 | 6303 | GCCGC−TTCCC | 151 | C(45) | T(45) | C(29) | T(30) | T(42) | C | |
| TTCCC−CCCTC | 157 | A(45) | G(51) | A(44) | G(42) | G(37) | G | Acll | ||
| Dm2086 | 65A6–65A10 | TACGA−AAGCT | 35 | T(33) | C(37) | C(47) | T(38) | T | T | |
| TATTT−AAA | 85–86 | C(35)A(12) | *(98)A(51) | *(98)C(56) | C(15)A/C(11) | CA | CA | |||
| AAA−TTTAA | 90–94 | TTT(51)AA(45) | ***(98)A*(98) | ***(98)A*(98) | TTT(24)AA(28) | TTTAA | TTTAA | |||
| TTAAT−TTATA | 101–110 | ATATATTTAA(48) | *T*TA***A*(98) | *T*TA***A*(98) | ATATATTTAA(33) | ATATATTTAA | ATATATTTAA | |||
| TTATA−GTATT | 116–128 | TATATAATATATA(56) | *(98) | *(98) | TATATAATATATA(28) | TATATAATATATA | TATATAATATATA | |||
| ATTAA−GTATA | 136 | T(42) | C(40) | C(42) | T(42) | T | T | Vspl Tall | ||
| Dm0929 | 67A1–67A2 | TAATG−GTTT | 508 | T(56) | C(56) | C(42) | C(18) | C(42) | C | |
| GTTT−GTGGT | 513 | A(40) | T(42) | A(40) | T(24) | T(44) | T | |||
| Dm2202 | 67C10–67D1 | CATTT−CCGAA | 880 | G(42) | A(40) | G(40) | A(37) | A(35) | G | |
| Q1052 | 68A1–68A2 | Q1052 | Q1060 | |||||||
| Dm2215 | 68B1–68B2 | ATTCA−CTAAT | 593, 596 | G(40)TTC(38) | G(42)TTC(38) | T(56)TTT(40) | G(35)TTC(28) | G(42)TTC(40) | GTTC | |
| TTCCC−TATCC | 607 | T(42) | T(37) | A(42) | T(42) | T(46) | T | |||
| TTCAC−AATA | 619 | A(45) | A(37) | G(30) | A(42) | A(42) | A | |||
| ATAA−AAC | 624 | G(47) | G(42) | A(44) | G(42) | G(44) | G | |||
| AAC−TTCAC | 628 | A(47) | A(44) | T(47) | A(42) | A(42) | A | |||
| TCAAC−ATTTT | 641 | T(45) | T(40) | C(42) | T(38) | T(40) | T | |||
| GTTTT−GTGGG | 753 | T(45) | T(40) | C(42) | T(42) | T(42) | T | |||
| Dm2544 | 69D1 | TACTT−CGCTG | 642 | G(27) | G(40) | G(40) | A(51) | A(40) | G | Hhal |
| STS | Cytological location | Flanking sequence | Relative nucleotide position | Oregon R | Canton S | w:iso2:iso3 | P strain 1 | P strain 2 | Release 1 v:cnbwsp | RFLP? |
| Dm3239 | 71F1–71F2 | AGAGC−GAACT | 73 | C(40) | C(37) | T(35) | T(35) | C(40) | T | Alul |
| GTGTG−GAGAT | 88 | G(46) | G(51) | A(30) | A(42) | G(40) | G | |||
| AATTC−TCCTA | 114–132 |
**T***
*A**G *** *** *G*(56) |
**T***
*A**G *** ***G*(44) | AATTTTTAATGT TTCTAGG(33) | AATTTTTAATGT TTCTAGG(37) |
**T***
*A**G *** ***G*(35) | AATTTTTAATGT TTCTAGG | Bfal Msel Tsp509l | ||
| Dm1809 | 72C1–72D6 | AGGCG−AGGAT | 714 | C(40) | C(39) | A(19) | A | C | C | Hhal |
| Q1060 | 73A1–A4 | Q1060 | Q1056 | |||||||
| Dm3626 | 74F4–75A2 | AGTGG–AAAGC | 1267 | A(30) | A(56) | G(56) | A(33) | A(56) | A | |
| ATGGG−GGTGG | 1301 | A(22) | T(51) | T(56) | A(42) | T(47) | T | |||
| Dm2220 | 76B6–76B10 | GCAAT−CCGAT | 124 | T(16) | T(29) | G(33) | T(22) | T(42) | G | Tsp509l |
| Dm3089 | 76C3 | CGATG−TTTAT | 51 | *(98) | *(98) | T(51) | *(98) | *(98) | T | |
| AATAT−TA | 156, 158 | A(51)TG(51) | A(45)TG(45) | G(44)TA(44) | A(40)TG(45) | A(56)TG(56) | GTA | |||
| TA−TATAT | 161–167 | TATGTAG(45) | TATGTAG(45) | CTACGTA(56) | TATGTAG(42) | TATGTAG(37) | CTACGTA | |||
| Q1056 | 83A7–A8 | Q1056 | Q1058 | |||||||
| Dm1568 | 86A5 | TTGCA−CAAGA | 155 | A(51) | A(38) | C(27) | A(33) | A(30) | A | |
| AACTC−TCCAC | 165 | C(56) | A(46) | C(31) | A(35) | C(42) | A | |||
| Dm3326 | 87F13−88A1 | GCTGG−AAATA | 71–91 | ACATGAACTTAT TCAGCA ACG(35) |
***
***
***
*
*** *** *** *(98) | ACATGAACTTAT TCAGCAACG(31) |
***
***
*** *** ***(98) |
***
***
*** *** **(98) | ACATGAACTTAT TCAGCAACG(31) | BspGl |
| Dm3478 | 88A1 | TCCGT−CAGCA | 90 | G(37) | G(35) | A(37) | G(37) | G(40) | A | CviRl Rsal |
| Dm0337 | 89C2–89C5 | TCCTG−TATAT | 856 | C(51) | G(56) | G(31) | C(40) | C(42) | G | |
| Dm2709 | 89D2–89D4 | CAGGG−GATGA | 668 | A(15) | G(56) | A(42) | A(48) | A(44) | A | |
| GAGCT−TCCAT | 677, 680, 683 | C(27)CTG (46)TAT(39) | G(30)CTC(33) TAC(42) | A(42)CTG(38) TAT(38) | C(56)CTG(42) TAT(56) | C(42)CTG(46) TAT(42) | ACTGTAT | Sacl | ||
| ATGAT−CCGCG | 692 | A(37) | T(56) | A(34) | A(42) | A(35) | A | |||
| CCGCG−CCCAT | 698 | A(37) | G(35) | A(30) | A(37) | A(31) | A | Haelll Sacll Siml | ||
| GCCGA−GAATG | 710–711 | G(42)C(42) | A(41)A(41) | G(38)C(38) | G(46)G(46) | G(42)C(42) | GC | |||
| GAATG–AGCGA | 717, 720–722 | A(41)GAA(56) A(56)G(56) | C(27)GAC(38) T(38)C(38) | A(42)GAA(46) A(42)G(44) | A(42)GAA(56) A(56)G(51) | A(42)GAA(56) A(56)G(46) | A | |||
| AGCGA−CAGAG | 731, 734, 737, 740 | G(32)GAG(44) CAC(45) GTG(45) TGT(45) | A(48)GAA(37) CAG(45) GTT(51)TGC(45) | G(46)GAG(37) CAC(42) GTG(44)TGT(42) | G(51)GAG(46) CAC(44) GTG(40)TGT(51) | G(56)GAG(48) CAC(37) GTG(45)TGT(56) | GGAGCACGTGTGT | Pmll Tall | ||
| Dm2494 | 89F4–90A2 | GGATG−CATCC | 503 | C(38) | C(20) | C(56) | T(44) | C(42) | C | Bccl |
| TCGGG−TACTA | 623 | C(37) | A(51) | C(39) | A(40) | C(35) | C | |||
| GATTT−CAACT | 659 | G(45) | G(45) | G(42) | C(29) | G(35) | G | CvlRl | ||
| ATGCT−AGCTA | 678 | T(45) | A(51) | T(38) | A(30) | T(42) | T | |||
| Dm3952 | 90D1–90E2 | AATTC−TTTTT | 717 | T(27) | T(30) | T(44) | *(98) | *(98) | * | |
| Q1059 | 91A1–A2 | Q1058 | Q1059 | |||||||
| Dm3293 | 92D1–91D2 | TTGTG−GACCC | 94 | T(51) | C(40) | C(35) | C(42) | T(42) | C | |
| CTGAG−ACTGA | 112 | G(56) | C(42) | C(38) | C(42) | G(35) | C | |||
| GGAAT−AGAAT | 183 | T(40) | C(45) | C(35) | C(35) | T(33) | C | Tsp509l | ||
| Dm1705 | 92D1–92D2 | GATAT−CCAAT | 473 | C(51) | C(42) | T(42) | T(42) | C(28) | C | EcoRV |
| TCATA−AAG | 518 | C(33) | C(28) | A(42) | A(33) | C(28) | C | |||
| AAG−CGGAT | 522 | C(42) | C(56) | A(37) | A(44) | C(42) | C | |||
| TGCGG−AGATC | 617 | T(45) | G(51) | G(26) | G(17) | G(32) | G | |||
| Dm2772 | 94C1–94C5 | CATTT−GGCGG | 409 | C(45) | C(40) | T(40) | T(42) | C(42) | C |
| STS | Cytological location | Flanking sequence | Relative nucleotide position | Oregon R | Canton S | w:iso2:iso3 | P strain 1 | P strain 2 | Release 1 v:cnbwsp | RFLP? |
| Dm1690 | 94E6–94E12 | AGTTT−GGATT | 802 | G(56) | G(56) | T(56) | G(33) | G(9) | G | |
| TAAAT−TGGAA | 872 | T(44) | T(45) | T(42) | G(36) | G(9) | T | Tsp509l | ||
| AACAT–TCTGA | 902–903 | A(44)T(48) | A(51)T(51) | A(40)T(45) | T(42)A(42) | T(9)A(9) | TA | |||
| TCTTT−GCCTG | 916 | T(56) | C(40) | C(40) | C(44) | C/T(9) | T | |||
| GCCTG−TTATT | 922 | T(56) | A(56) | A(45) | A(40) | T(9) | T | |||
| TTATT−AAGTG | 940–950 | *** *** *A***(98) | *** *** *A***(98) | *** *** *A***(98) | TGTTCTTATTG(37) | TGTTCTTATTG(11) | *** ***A*** | Msel | ||
| AGTGA−ATTGT | 957 | C(51) | T(56) | T(44) | T(27) | T(11) | C | |||
| GTATT−TTCAA | 966 | C(56) | C(56) | C(56) | T(42) | T(20) | C | |||
| AATAA−TTAGT | 996 | T(45) | T(43) | T(40) | A(17) | A(16) | T | |||
| TTAGT−TATAT | 1002 | A(51) | A(51) | A(40) | T(42) | T(33) | A | |||
| TATAT−TAAAC | 1008 | A(51) | A(51) | C(40) | C(17) | C(20) | C | |||
| Dm1592 | 95D1–95D6 | AGACA−TTCAC | 911 | C(56) | T(44) | T(31) | C(56) | C(56) | C | |
| Dm0667 | 98E11–98F3 | TTTAA−ATTTC | 1032 | C(29) | G(35) | G(56) | G(42) | C(30) | G | |
| CTAGC−TTGAA | 1042 | C(51) | T(56) | T(46) | T(37) | C(35) | G | Alul | ||
| GTCCG−CGA | 1081 | A(29) | A/G(21) | A(26) | G(33) | A(14) | G | |||
| CGA−TTTAG | 1085–1100 |
**T*T***A***G(36) A**(45) | GGTATGGCAT TCTATG(37) | GGTATGGCAT TCTATG(48) | GGTATGGCAT TCTATG(42) |
**T*T***A***
G(42)A**(98) | GGTATGGCAT TCTATG(48) | |||
| AAACT−TTTTT | 1138, 1142 | T(56)ATTG(37) | G(56)ATTA(51) | G(44)ATTA(45) | G(37)ATTA(37) | T(22)ATTG(15) | GATTA | |||
| CAGAA−ATTGA | 1156 | A(56) | T(51) | T(30) | T(29) | A(40) | T | Tsp509l Sspl | ||
| TTGGC−AAAAT | 1170 | C(42) | A(51) | A(44) | A(44) | C(26) | A | Haelil Mscl | ||
| AAAAT−TATTT | 1176, 1178 | A(38)CG(40) | G(56)CA(56) | G(50)CA(37) | G(30)CA(35) | A(32)CA(21) | GCA | SnaBl Tall CvlRl Nsil | ||
| Q1058 | 96F10–F11 | Q1058 | Q1059 | |||||||
| Dm1657 | 97C1–97C3 | CATGG−CGCAT | 968 | C(37) | C(40) | A(30) | C(38) | C(24) | C | Acil Haelil |
| AGTTT−TGTTT | 1024 | G(56) | T(56) | G(56) | G(37) | G(37) | T | |||
| GCCCC−CCATC | 1049 | G(40) | A(40) | A(40) | A(37) | G(40) | A | Acll | ||
| Dm2473 | 99D1–99D2 | GTCGC−GAATC | 1029 | *(19) | T(40) | T(30) | T(40) | C(40) | C | Nrul Thal |
| ATTGG−CCGGA | 1049–1049, 1052 | C*(11)T(11)CAG(22) | T(40)T(40)CAA(40) | T(23)T(25)CAA(23) | T(38)T(37)CAA(33) | T(35)C(35)CAG(33) | CTTCAA | Drdll | ||
| Dm2288 | 100C1–100C4 | CTGCT−CATTT | 1040 | C(42) | T(44) | T(47) | C(21) | C(29) | C | |
| TTGGC−GTTCC | 1110–1113, 1116 | *** *GG*(98) | GTTT(40)GGT(40) | GTTT(42)GGT(38) | *** *GG*(98) | *** *GG*(98) | ATTTGGT | Acil | ||
| CAAAG−TGCGT | 1139 | T(51) | C(37) | C(42) | T(42) | T(56) | C | Alul |
[i] List of SNP sequences identified among CS, OreR, w;iso2;iso3, y;cnbwsp, and pairwise combinations of 17 single P-element insertion strains. Identified SNPs are listed according to the STS from which they were derived. For each SNP entry, the approximate cytological location and ∼10 bp of sequence flanking the polymorphic site are indicated. Cytological locations are derived from the P1-based genome physical map (Kimmerly et al. 1996) and confirmed by comparison of the STS sequence to a database of Release 1 genome sequences with associated cytological locations (Adams et al. 2000). “Nucleotide Position” refers to nucleotide positions within sequence assemblies and is included to provide relative, rather than absolute, positions for each polymorphism. The identity of the dimorphic base for each SNP is listed for each strain, and the corresponding Phredquality score of that base in the sequence trace is listed parenthetically. Sequences from the y;cn bw sp strain were derived from the Release 1 sequence, where available. Restriction endonucleases listed under “RFLP?” are those for which the recognition site is present in one allele and absent in the other. The location of P-element insertions (designated as Q1040, etc.) is indicated; SNP sequences are listed between each pairwise set of P-element strains that can be used for eye-color-based selection of recombinants in that interval. All polymorphisms between the w;iso2;iso3 and P-element strains were initially detected by Denaturing HPLC. For additional data, see http://www.fruitfly.org/SNP/index.html.
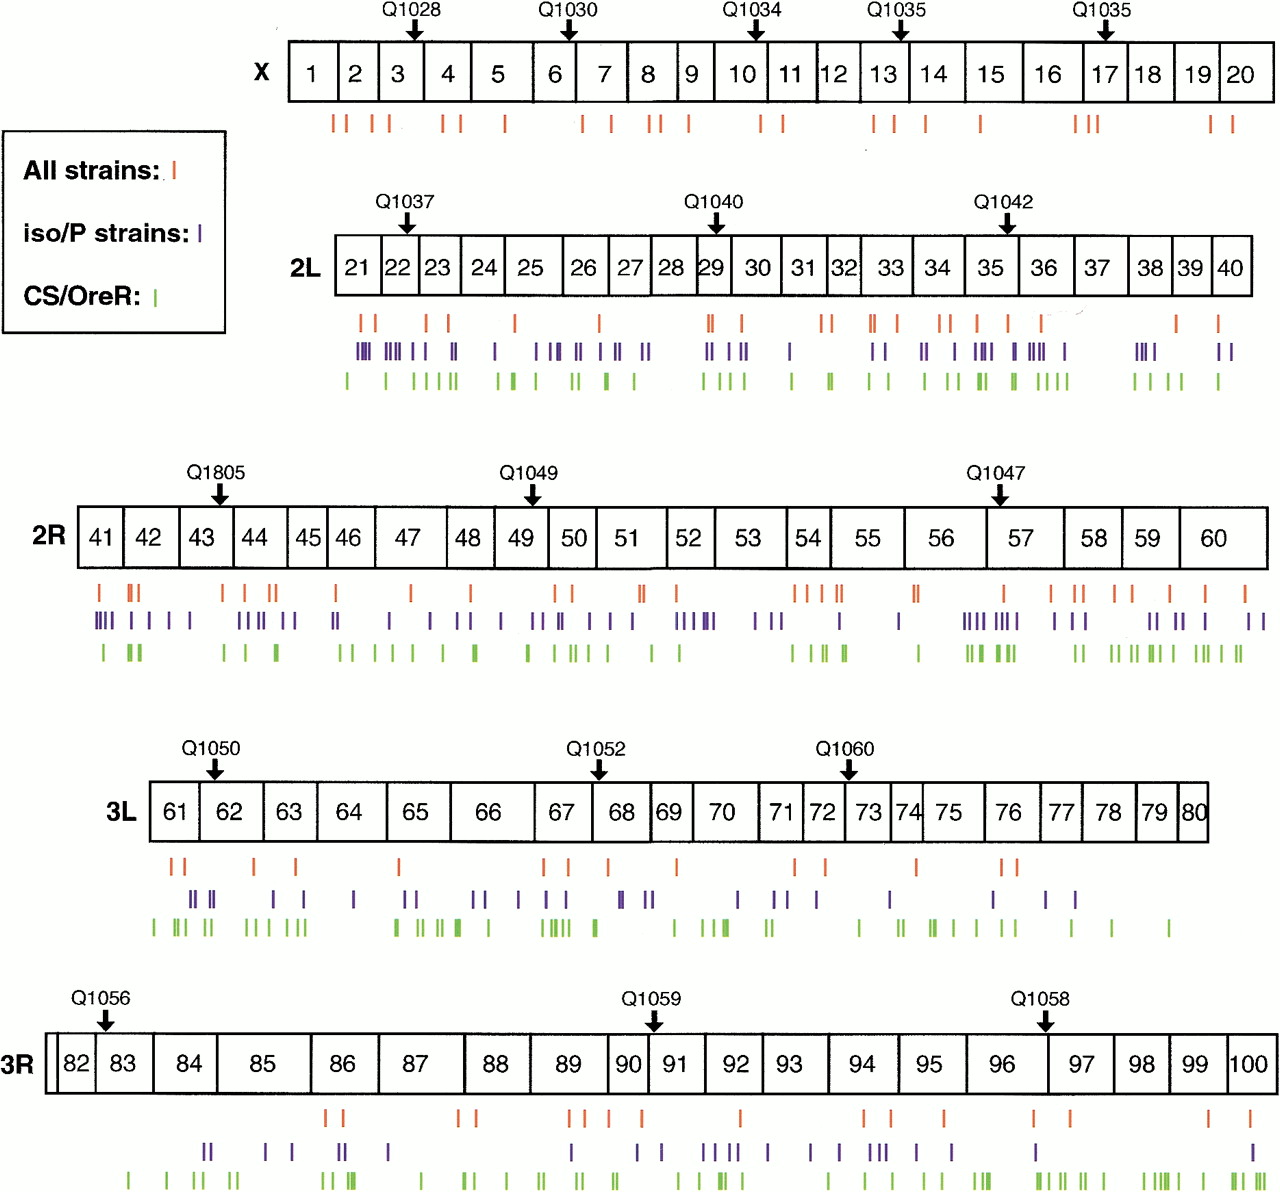
The chromosome-wide distribution of the polymorphisms identified in this study is represented in Figure 1. The distribution is relatively even across the genome, with an average density of one SNP marker per 225 kb on the autosomes and one per megabase on the X chromosome. The lower density of SNPs discovered on the X chromosome is due primarily to a lower density of available STSs. The region flanking the centromere of chromosome 3, including cytological divisions 77 through 83, contains far fewer polymorphisms per kilobase than the rest of the genome. All available STSs in this region were screened in the w;iso2;iso3/P-element strain comparison, and additional comparison of nearly 100 kb of sequence revealed a lack of polymorphism between these strains (data not shown). This observation is consistent with previous studies indicating that levels of sequence polymorphism correlate with recombination rates inDrosophila (Begun and Aquadro 1992; Charlesworth 1996). However, we do not observe a similar reduction of variation near the centromere of chromosome 2.
Distribution in the Drosophila genome of SNPs identified in this study. The euchromatic portion of the genome is represented by horizontal bars, with the extent of each cytological division representing the genomic extent as estimated by Sorsa (1988). The positions of SNP markers identified in this study are represented by vertical hatch marks: SNPs for which sequence has been determined in all strains are represented by red hatch marks; those that were identified in pairwise subsets of strains are indicated by blue or green. The distribution is relatively even throughout the genome, with the exception of cytological divisions 78–83 near the centromere of chromosome 3. Strain designations (e.g., Q1040) and a small downward arrow indicate the positions of P elements useful for fine-scale mapping.
Mapping with SNPs
Having identified a sufficiently dense set of SNPs, we designed a simple strategy to use these markers for mapping single gene mutations (Fig. 2). This strategy requires two to four generations and informative assays for 10–20 SNPs. In the first step, the mutation of interest is mapped relative to six markers that span the chromosome at 8–10 Mb intervals (Fig. 2A), by using 96 unselected, chromosome-wide recombinants. These markers can be SNPs, transposon insertions, or visible markers. Once the interval in which the mutation lies is defined, SNPs are tested on the appropriate recombinants to further refine the position of the gene (Fig. 2B,C). Using this strategy, we mapped two independent recessive lethal mutations isolated in a screen for suppressors of a human p21 overexpression phenotype. These mutations were placed between the STSs Dm1601 and Dm1655 on chromosome 3, an interval of <1 Mb (Fig. 2C) and subsequently were shown to be alleles of the hedgehoggene (Tabata and Kornberg 1994).
To achieve the high-resolution mapping suitable for positional cloning, we have used the P-element strains listed in Table 2 in a strategy to select many white (−) recombinants in a small region (Cutforth and Rubin 1994; Spradling et al. 1995; see Discussion).
Discussion
Determining the locations of mutations in the genome is a critical component of genetic analysis. We have identified a set of 474 SNP markers spanning the Drosophila genome and showed their use as a new and powerful resource for genetic mapping. The density of available SNPs is high, so the mapping resolution achievable with SNPs is much greater than with traditional, phenotypic markers. With the example of the mutations in hedgehog, we show the ease with which mutations can be localized to intervals of ∼1 Mb, and we routinely use this approach to map genes to inter-vals of <500 kb. If the mutation is mapped relative to a P-element insertion in the initial mapping, a chromosome that contains the P element linked to the muta tion can be used for finer scale localization. For instance, a useful approach is to generate many recombinants between the P[w +] elements shown in Table 2, which can be selected easily using the white eye color phenotype (Cutforth and Rubin 1994; Spradling et al. 1995). In a P[w +] interval of ∼10 Mb, 500 selected recombinants result in one recombination event every 20 kb on average. Using this approach and a combination of the SNPs reported here and newly discovered SNPs in a selected interval, we have localized a single mutation to <25 kb, an interval in which DNA sequencing is a realistic method for identifying mutations (D.A. Ruddy and M.C. Ellis, unpubl.).
Although the paucity of molecular variation and recombination events near the centromeres is currently a limitation for recombination mapping, new techniques based on male-specific recombination for mapping relative to P-element insertion sites may provide a solution (Chen et al. 1998). A commonly used but relatively low-resolution approach to mapping mutations is complementation testing with chromosomal deficiencies, which sometimes can be confounded by synthetic interactions. Existing large collections of P-element insertion mutants also can be used in complementation tests with new, unmapped mutations, an approach that sometimes will obviate the need for high-resolution recombination mapping (Spradling et al. 1999). However, the spectrum of genes that can be recovered by insertional mutagenesis is limited by insertion site biases. Point mutations are useful for many genetic analyses and are recoverable only by chemical mutagenesis. A combined approach that makes use of both recombination mapping with SNPs and analysis of transposon insertions in candidate genes is an efficient approach to positional cloning.
Another advantage of SNPs as markers is the ability to use standardized and scalable genotyping methods. We have found DHPLC to be a useful technology for SNP scoring, as it is a technically simple and robust technology that is inexpensive to operate and well suited to detection of heteroduplex DNA molecules derived from heterozygous individuals. Assay technologies that do not require specialized instrumentation, such as PCR followed by restriction site polymorphism analysis, can be applied to many of the polymorphisms identified in this study. This approach has been shown to be effective for SNP mapping in C. elegans (S. Wicks, pers. comm.). A vast array of technologies for genotyping SNPs has been developed, a partial sampling of which includes systems based on primer extension, oligonucleotide ligation, or nuclease assays (Landegren et al. 1998), and various microarray formats (Hirschhorn et al. 2000; Pastinen et al. 2000).
The set of SNPs described here can be used in mapping crosses involving any strain. For example, a mutation in an unknown genetic background could be mapped in two sets of crosses to any two of the isogenic strains described here, using SNP markers that distinguish the two mapping strains. Because SNP markers are biallelic, essentially all SNPs will distinguish the unknown strain from one or the other mapping strain, so essentially all markers will be informative in one cross or the other. Furthermore, genotyping assays can be used to identify a subset of the SNPs presented here that differentiate two unknown strains. However, the development of standardized Drosophilamapping resources may benefit from the selection of standardized strains and a standard set of SNPs that can be scored using a widely available and easily accessible scoring technology.
With the complete genomic sequence now available, we can look toward rapid developments in genomics-based approaches to biological problems in Drosophila. For example, a higher density set of SNPs could be developed to enable even higher resolution mapping strategies. Additional large-scale SNP discovery is now very straightforward using the reference Drosophila genome sequence as a guide. SNPs will be useful in other mapping applications, including characterization of complex traits, QTL mapping, and loss-of-heterozygosity approaches to defining deletion end points. SNPs also may be useful asDrosophila strain identifiers. Finally, SNPs may have use in genomic sequence-based screening approaches, whereby randomly mutagenized chromosomes are screened for molecular lesions (Bentley et al. 2000).
METHODS
Drosophila Strains
Wild-type Drosophila strains were obtained from the Bloomington Stock Center. Canton S and Oregon R were obtained from the laboratory of G.M. Rubin; single P-element insertion strains were obtained from C. Goodman and G.M. Rubin and were derived from an enhancer trap screen performed in their laboratories. Canton S, Oregon R, and w;iso2;iso3 were made isogenic for the indicated chromosomes (X, 2, or 3) according to standard techniques, with the exception of Canton S and Oregon R isogenic chromosome 2 stocks, which were obtained from T. Laverty and G.M. Rubin. All P-element strains and newly isogenized wild-type strains are available from the Bloomington Stock Center.
Molecular Biology
Drosophila genomic DNA was isolated either from adult populations or single recombinant flies according to standard techniques. STSs were amplified from genomic DNA preparations using either standard or touchdown PCR (Don et al. 1991) to facilitate amplification of most STSs under a single set of conditions.
Identification of Sequence Variants
The STSs used in this study were developed by the BerkeleyDrosophila Genome Project (BDGP; Kimmerly et al. 1996), and were selected based on map position inferred from the P1 clones and contigs with which they are associated. STS sequences, primer sequences, and PCR conditions are available on the BDGP Web site (http://www.fruitfly.org). STS sequences were compared among different strains by using the two approaches discussed below.
DNA sequencing
One thousand sixteen STSs were selected for sequencing in the Canton S and Oregon R strains based on the following criteria: primer annealing temperature of 58°C, PCR product length of >180 bp, and reliable amplification in STS content mapping experiments. STSs were PCR amplified with AmpliTaq Gold polymerase (Applied Biosystems) by using PCR conditions described in individual STS reports available athttp://www.fruitfly.org. PCR products were treated with exonuclease I and shrimp alkaline phosphatase to degrade primers and free nucleotides (Werle et al. 1994). Treated products were sequenced using the PCR primers and BigDye terminator sequencing chemistry (Applied Biosystems) and analyzed on ABI 377 sequencing machines. Sequences were assembled using the Phred/Phrap/Consedpackage (Ewing and Green 1998; Gordon et al. 1998;http://genome.washington.edu). Candidate polymorphisms were detected both by inspection of traces and by automated detection of high-quality sequence discrepancies in Consed. High-quality sequence was obtained from 796 of the 1016 STSs, and 309 of these contained at least one polymorphism. The sequences in Canton S and Oregon R of 49 of these polymorphic STSs have been reported previously (Teeter et al. 2000).
DHPLC
Approximately 1050 STSs between 180 and 200 bp in size were selected and amplified by PCR from the P-element and w; iso2; iso3 strains. Successful amplification was confirmed by gel electrophoresis. For each STS, the products amplified from the two strains were mixed in a 1 : 1 (v/v) ratio. The mixed products were denatured for 5 min at 95°C and reannealed slowly to create heteroduplex molecules. Presence or absence of heterozygosity was analyzed using DHPLC (Oefner and Underhill 1998) under the following conditions: Samples were run on a metal-free HPLC system (Varian Chromatography Systems) and fitted with a column capable of high-resolution DNA separations; the Eclipse and Helix columns (Varian Chromatography Systems) or the DNASep column (Transgenomic, Inc.) were used. Chromatographic separations were performed using a uniform gradient (1.8% acetonitrile/min for DNAsep columns, 4%/min for other columns), and all STSs were screened at 52°C, 54°C, 56°C, 58°C, and 60°C to determine the optimum temperature for heteroduplex detection. STSs positive for heterozygosity were DHPLC-analyzed in the homozygous strains and sequenced to identify the variant base.
Sequences from both approaches were assembled usingPhred and Phrap and analyzed inConsed to generate the sequences represented in Table 2and at http://www.fruitfly.org. All STSs containing SNPs were sequenced on both strands; in some cases, this resulted in single-stranded coverage of SNPs near the ends of STSs. The SNPs listed in Table 2 were sequenced in the strains that contain the two flanking P elements to identify those useful for fine-scale mapping.
Recombination Mapping
Alleles of the hedgehog gene were isolated in a screen for ethyl methanesulfonate-induced mutants that suppress a p21 overexpression phenotype. These mutations were induced in a w;iso2;iso3 strain, and balanced mutant stocks were established over TM3 or TM6 by standard methods. The mutations were localized initially by crossing to a mapping chromosome that contained six molecular polymorphisms at evenly spaced intervals. By analyzing 96 random recombinants for both (1) the allele at each marker, and (2) the presence or absence of the mutant gene, the position of the mutation along the chromosome can be established to within a 10–20-Mb interval of the chromosome between the molecular markers. SNP markers in the appropriate interval were amplified from each recombinant and analyzed using DHPLC to generate the haplotypes shown in Figure 2.
We thank Brett Milash for establishing an STS location database at Exelixis, Ross Buchholz and Wes Miyazaki for generatinghedgehog recombinants, the Exelixis sequencing group for sequencing support, Bruce Kimmel and Mike Palazzolo for advice and discussions, and Gerald M. Rubin for support on NIH grant P50-HG00750. This work was funded in part by grant BG94-206 to E.M.R., and from Rhone-Poulenc to R.A.H.
The publication costs of this article were defrayed in part by payment of page charges. This article must therefore be hereby marked “advertisement” in accordance with 18 USC section 1734 solely to indicate this fact.
Notes
[3] Corresponding authors.
[4] E-MAIL ; FAX (510) 486-6798.
[5] E-MAIL ; FAX (650) 837-7220.
Notes
[6] Article published on-line before print: Genome Res., 10.1101/gr.178001.
[7] Article and publication are at www.genome.org/cgi/doi/10.1101/gr.178001.
REFERENCES
- ↵M.D. AdamsS.E. CelnikerR.A. HoltC.A. EvansJ.D. GocayneP.G. AmanatidesS.E. SchererP.W. LiR.A. HoskinsR.F. Galle(2000) The genome sequence of Drosophila melanogaster. Science 287:2185–2195.
- ↵D.J. BegunC.F. Aquadro(1992) Levels of naturally occurring DNA polymorphism correlate with recombination rates in D. melanogaster. Nature 356:519–520.
- ↵(1993) African and North American populations of Drosophila melanogaster are very different at the DNA level. Nature 365:548–550, ibid.
- ↵A. BentleyB. MacLennanJ. CalvoC.R. Dearolf(2000) Targeted recovery of mutations in Drosophila. Genetics 156:1169–1173.
- ↵M. CargillD. AltshulerJ. IrelandP. SklarK. ArdlieN. PatilN. ShawC.R. LaneE.P. LimN. Kalyanaraman(1999) Characterization of single-nucleotide polymorphisms in coding regions of human genes. Nat. Genet. 22:231–238.
- ↵B. Charlesworth(1996) Background selection and patterns of genetic diversity in Drosophila melanogaster. Genet. Res. 68:131–149.
- ↵B. ChenT. ChuE. HarmsJ.P. GergenS. Strickland(1998) Mapping of Drosophila mutations using site-specific male recombination. Genetics 149:157–163.
- ↵R.J. ChoM. MindrinosD.R. RichardsR.J. SapolskyM. AndersonE. DrenkardJ. DewdneyT.L. ReuberM. StammersN. Federspiel(1999) Genome-wide mapping with biallelic markers in Arabidopsis thaliana. Nat. Genet. 23:203–207.
- ↵T. CutforthG.M. Rubin(1994) Mutations in Hsp83 and cdc37 impair signaling by the sevenless receptor tyrosine kinase in Drosophila. Cell 77:1027–1036.
- ↵R.H. DonP.T. CoxB.J. WainwrightK. BakerJ.S. Mattick(1991) “Touchdown” PCR to circumvent spurious priming during gene amplification. Nucleic Acids Res. 19:4008.
- ↵B. EwingP. Green(1998) Base-calling of automated sequencer traces using Phred. II. Error probabilities. Genome Res. 8:186–194.
- ↵D. GordonC. AbajianP. Green(1998) Consed: A graphical tool for sequence finishing. Genome Res. 8:195–202.
- ↵J.G. HaciaJ.B. FanO. RyderL. JinK. EdgemonG. GhandourR.A. MayerB. SunL. HsieC.M. Robbins(1999) Determination of ancestral alleles for human single-nucleotide polymorphisms using high-density oligonucleotide arrays. Nat. Genet. 22:164–167.
- ↵J.N. HirschhornP. SklarK. Lindblad-TohY.M. LimM. Ruiz-GutierrezS. BolkB. LanghorstS. SchaffnerE. WinchesterE.S. Lander(2000) SBE-TAGS: An array-based method for efficient single-nucleotide polymorphism genotyping. Proc. Natl. Acad. Sci. 97:12164–12169.
- ↵W. KimmerlyK. StultzS. LewisK. LewisV. LustreR. RomeroJ. BenkeD. SunG. ShirleyC. Martin(1996) A P1-based physical map of the Drosophila euchromatic genome. Genome Res. 6:414–430.
- ↵R. KochH.G.A.M. van LuenenM. van der HorstK.L. ThijssenR.H.A. Plasterk(2000) Single nucleotide polymorphisms in wild isolates of Caenorhabditis elegans. Genome Res. 10:1690–1696.
- ↵U. LandegrenM. NilssonP.Y. Kwok(1998) Reading bits of genetic information: Methods for single-nucleotide polymorphism analysis. Genome Res. 8:769–776.
- ↵K. Lindblad-TohE. WinchesterM.J. DalyD.G. WangJ.N. HirschhornJ.P. LavioletteK. ArdlieD.E. ReichE. RobinsonP. Sklar(2000) Large-scale discovery and genotyping of single-nucleotide polymorphisms in the mouse. Nat. Genet. 24:381–386.
- ↵E.N. MoriyamaJ.R. Powell(1996) Intraspecific nuclear DNA variation in Drosophila. Mol. Biol. Evol. 13:261–277.
- ↵P.J. OefnerP.A. Underhill(1998) DNA mutation detection using denaturing high-performance liquid chromatography (DHPLC). in Current protocols in human genetics. ed N.C. Dracopoli(Wiley, New York), Supplement 19:7.10.1–7.10.12.
- ↵T. PastinenM. RaitioK. LindroosP. TainolaL. PeltonenA.C. Syvanen(2000) A system for specific, high-throughput genotyping by allele-specific primer extension on microarrays. Genome Res. 10:1031–1042.
- ↵M.D. SchugT.F. MackayC.F. Aquadro(1997) Low mutation rates of microsatellite loci in Drosophila melanogaster. Nat. Genet. 15:99–102.
- ↵V. Sorsa(1988) Chromosome maps of Drosophila. (CRC Press, Boca Raton, FL), II.
- ↵J.I. SpiegelmanM.N. MindrinosC. FankhauserD. RichardsJ. LutesJ. ChoryP.J. Oefner(2000) Cloning of the Arabidopsis RSF1 gene using a mapping strategy based on high density DNA arrays and denaturing high performance liquid chromatography. Plant Cell 12:2485–2498.
- ↵A.C. SpradlingD.M. SternI. KissJ. RooteT. LavertyG.M. Rubin(1995) Gene disruptions using P transposable elements: An integral component of the Drosophila genome project. Proc. Natl. Acad. Sci. 92:10824–10830.
- ↵A.C. SpradlingD. SternA. BeatonE.J. RhemT. LavertyN. MozdenS. MisraG.M. Rubin(1999) The Berkeley Drosophila Genome Project gene disruption project: Single P-element insertions mutating 25% of vital Drosophila genes. Genetics 153:135–177.
- ↵T. TabataT.B. Kornberg(1994) Hedgehog is a signaling protein with a key role in patterning Drosophila imaginal discs. Cell 76:89–102.
- ↵K. TeeterM. NaeemuddinR. GasperiniE. ZimmermanK.P. WhiteR. HoskinsG. Gibson(2000) Haplotype dimorphism in a SNP collection from Drosophila melanogaster. J. Exp. Zool. 288:63–75.
- ↵P.A. UnderhillL. JinA.A. LinS.Q. MehdiT. JenkinsD. VollrathR.W. DavisL.L. Cavalli-SforzaP.J. Oefner(1997) Detection of numerous Y chromosome biallelic polymorphisms by denaturing high-performance liquid chromatography. Genome Res. 7:996–1005.
- ↵D.G. WangJ.B. FanC.J. SiaoA. BernoP. YoungR. SapolskyG. GhandourN. PerkinsE. WinchesterJ. Spencer(1998) Large-scale identification, mapping, and genotyping of single- nucleotide polymorphisms in the human genome. Science 280:1077–1082.
- ↵E. WerleC. SchneiderM. RennerM. VolkerW. Fiehn(1994) Convenient single-step, one tube purification of PCR products for direct sequencing. Nucleic Acids Res. 22:4354–4355.
- ↵E.A. WinzelerD.R. RichardsA.R. ConwayA.L. GoldsteinS. KalmanM.J. McCulloughJ.H. McCuskerD.A. StevensL. WodickaD.J. Lockhart(1998) Direct allelic variation scanning of the yeast genome. Science 281:1194–1197.