Abstract
Transfer RNAs (tRNAs) are central to protein synthesis and are increasingly recognized as dynamic regulators of gene expression whose abundance and chemical modifications are subject to precise biological control. Here, we systematically investigate how two distinct dietary interventions, low-protein and high-fat diets, reshape the tRNA landscape across multiple mouse tissues, using RNA mass spectrometry and ordered two-template relay sequencing (OTTR-seq) to comprehensively profile cytosolic and mitochondrial tRNAs at single-nucleotide resolution. We reveal pronounced tissue-specific biases in tRNA isodecoder expression, including the unexpected presence of full-length cytosolic tRNAs in mature sperm with a distinct isotype composition. In somatic tissues such as liver and heart, dietary conditions alter both tRNA abundance and key modifications known to regulate decoding efficiency, whereas in reproductive tissues diet primarily affects the abundance of select tRNAs with comparatively limited changes in modification profiles. We further demonstrate that mitochondrial tRNAs are subject to diet-responsive changes in both abundance and modification status and that even subtle differences in dietary fat composition are sufficient to alter tRNA modification signatures. Together, these findings establish the tRNA epitranscriptome as a sensitive and tissue-specific sensor of nutritional state and provide a resource for understanding how dietary cues interface with translational regulation in somatic and reproductive tissues.
Transfer RNAs (tRNAs) play a central role in protein synthesis by decoding messenger RNA (mRNA) information into corresponding amino acid sequences, thereby translating the genetic code into functional proteins. Eukaryotes have two pools of tRNAs: cytosolic tRNAs encoded by the nuclear genome and 22 mitochondrial tRNAs (mt-tRNAs) encoded by the mitochondrial genes. Notably, most cytosolic tRNAs are encoded by multiple genes, expanding the repertoire of tRNA molecules available for each type and allowing for fine-tuned regulation of translational dynamics. Accordingly, tRNAs are broadly categorized into isotypes (each charged with one of the 20 standard amino acids), isoacceptors (tRNAs with different anticodons that carry the same amino acid), and isodecoders (tRNAs sharing the same anticodon but differing in sequence elsewhere in the molecule). tRNAs are also among the most extensively modified RNA species in the cell, with more than 100 distinct chemical modifications identified to date and an average of about 13 modifications per tRNA molecule (Zhang et al. 2022). These post-transcriptional modifications are essential for proper tRNA folding, structural stability, and accurate decoding during translation.
Recent studies report that tRNA abundance varies across different mouse tissues (Dittmar et al. 2006; Torres et al. 2019; Pinkard et al. 2020; Yu et al. 2023). Furthermore, many tRNA-modifying enzymes are expressed in a tissue-specific manner. Comparative analysis of the expression of RNA-modifying proteins across various tissues revealed that certain proteins are specifically expressed in the reproductive tract (Begik et al. 2020), including the testis and the epididymis, an organ in which sperm undergo posttesticular maturation and become motile. For example, NSUN7, a 5-methylcytosine (m5C) modifying enzyme, is expressed during the late stages of spermatogenesis in the spermatocytes and spermatids (Begik et al. 2020) and is required for male fertility (Harris et al. 2007). Another member of the family, NSUN2, is also required for the meiotic progression of germ cells in the testis (Hussain et al. 2013). NSUN2 and NSUN7 are enriched in the proximal region of the epididymis (caput epididymis) but not in the distal epididymis (cauda epididymis), indicating segment-specific expression of these proteins in the epididymis. Moreover, the epididymis was reported to be specifically enriched in two additional tRNA modifying enzymes: TRDMT1 (previously known as DNMT2), a m5C methyltransferase known to modify position 38 in specific tRNAs, and METTL1, a N7-methylguanosine (m7G) tRNA methyltransferase (Begik et al. 2020). Whether reproductive tract tissues have differential tRNA modification profiles compared with other tissues remains unknown.
Stress and other external factors can also influence tRNA abundance and modifications (Chan et al. 2010; Pang et al. 2014; Huang and Hopper 2016). For instance, high reactive oxygen species conditions in Escherichia coli cells can lead to elevated tRNA Tyr-QUA-II m5C levels at position 49 (Valesyan et al. 2024). The addition of hydrogen peroxide (H2O2) to yeast cells has been shown to increase the levels of specific posttranscriptional modifications, including m5C, N², N²-dimethylguanosine (m²,²G), and 2′-O-methylcytidine (Cm) (Chan et al. 2010). Similarly, arsenite exposure increased queuosine levels, which were associated with the upregulation of proteins encoded by codon-biased genes involved in energy metabolism (Huber et al. 2022). tRNA thiolation is downregulated in response to sulfur starvation (Laxman et al. 2013). Moreover, the gut microbiome has been reported to regulate tRNA abundance and modifications in the host in a tissue-specific manner (Huang et al. 2021). Conversely, diet can influence tRNA abundance and modifications in the gut microbiome communities (Schwartz et al. 2018). In addition to their role in translation, tRNAs can be cleaved to generate tRNA-derived RNAs (tDRs) (Holmes et al. 2023), also known as tRNA-derived small RNAs (tsRNAs) or tRNA fragments (tRFs), which have been proposed to play key roles in various cellular processes (Anderson and Ivanov 2014; Magee and Rigoutsos 2020). Exposure to low-protein (LP) or high-fat (HF) diets leads to alterations in the levels of specific tDRs in sperm (Chen et al. 2016; Sharma et al. 2016). Whether diet alters the levels and modifications of mature tRNAs has not been examined systematically. Determining the effects of various internal and external factors on tRNAs is important as alterations in tRNA abundance and/or modifications can lead to selective translation of codon-biased mRNAs (Chan et al. 2010).
Major advancements in identifying and understanding the dynamic nature of tRNA modifications were made possible through the development of liquid chromatography–tandem mass spectrometry (LC-MS/MS) methods to measure RNA nucleotide modifications accurately (Thüring et al. 2016; Wetzel and Limbach 2016). Despite these advances, MS-based methods cannot provide single-molecule-level information. Similarly, accurate measurement of more than 400 distinct mouse tRNA molecules by deep sequencing has been challenging owing to the extensive structural and chemical modifications in tRNAs and an inability to distinguish between isodecoders. However, overcoming these challenges, various new methods for mature tRNA sequencing and analysis have been developed recently (Padhiar et al. 2024), including demethylase-thermostable group II intron reverse transcriptase (TGIRT) tRNA sequencing (DM-tRNA-seq) (Zheng et al. 2015), AlkB-facilitated RNA methylation sequencing (ARM-seq) (Cozen et al. 2015), hydrolysis-based tRNA sequencing (Hydro-tRNAseq) (Gogakos et al. 2017), Y-shaped adapter-ligated mature tRNA sequencing (YAMAT-seq) (Shigematsu et al. 2017), long hairpin oligonucleotide-based tRNA high-throughput sequencing (LOTTE tRNAseq) (Erber et al. 2020), quantitative mature tRNA sequencing (QuantM-tRNAseq) (Pinkard et al. 2020), modification-induced misincorporation tRNA sequencing (mim-tRNAseq) (Behrens et al. 2021), Nanopore-based tRNA sequencing (Nano-tRNAseq) (Lucas et al. 2024), and ligation-independent detection of all types of RNA (LIDAR-seq) (Scacchetti et al. 2024).
Some of the above methods use enzymatic treatment to remove modifications that pause or stop reverse transcription, including N1-methyladenosine (m1A), N3-methylcytidine (m3C), and N1-methylguanosine (m1G) (Cozen et al. 2015; Zheng et al. 2015; Pinkard et al. 2020; Shi et al. 2021; Scheepbouwer et al. 2023). In addition, high processivity reverse transcriptase (RT) enzymes have been used to allow sequencing of highly modified tRNAs. High processivity RT enzymes often misincorporate nucleotides at certain modified bases, thus providing single-nucleotide resolution of putative modified positions in tRNAs. One such method, DM-tRNA-seq, involves treating tRNA with the E. coli demethylase AlkB in combination with the TGIRT enzyme to allow more efficient full-length tRNA sequencing (Zheng et al. 2015). Recently, ordered two-template relay sequencing (OTTR-seq) was developed, which uses an engineered recombinant non-LTR retroelement RT that adds both adaptors to the cDNA in a single reverse transcription step by template jumping (Upton et al. 2021), allowing the generation of low-bias small RNA (sRNA) sequencing libraries. This method has been successfully applied to sequence full-length tRNAs from yeast and mice (Gustafsson et al. 2025). Importantly, OTTR-seq provides site-specific information on modified nucleotides through RT misincorporation signatures, overcoming prior technical challenges owing to extensive base modifications in tRNAs and the difficulty of adapter ligation (Upton et al. 2021; Gustafsson et al. 2025).
Although it is increasingly appreciated that various internal and external factors alter tRNA abundance and modifications, the influence of dietary alterations on cellular tRNAs has largely remained unexplored. Here, we systematically examine how dietary inputs shape tRNA abundance and modification landscapes across mouse tissues. We first use LC-MS/MS to assess whether tRNA modifications are dynamic, varying across tissues and in response to dietary perturbation. Building on these observations, we then apply OTTR-seq to generate a comprehensive, tissue-resolved resource of tRNA abundance and modification-associated signatures across LP and HF dietary conditions. Together, these data provide a rich resource for understanding how environmental cues interface with tRNA biology across somatic and reproductive tissues.
Results
Mass spectrometric analysis reveals dynamic changes in tRNA modifications across tissues and upon dietary perturbation
To examine whether tRNA modifications are regulated in a tissue-specific manner, we quantified specific RNA modifications at the level of individual modified nucleosides (mononucleotides), following enzymatic digestion of bulk tRNAs and sRNAs isolated from epididymis and liver tissues, using LC-MS/MS (Fig. 1A). We focused on these two tissues to compare RNA modifications in reproductive and nonreproductive tract tissues, given that specific RNA-modifying enzymes are more abundant in the reproductive tissues (Begik et al. 2020). sRNAs ranging from 16 to 40 nucleotides (nt; primarily consisting of tDRs) and RNAs ranging from 70 to 90 nt (corresponding to mature tRNAs) were isolated from total RNA by size fractionation on a polyacrylamide gel (Supplemental Fig. S1A,B) and processed for RNA nucleotide modification analysis using LC-MS/MS for 24 known RNA modifications (Supplemental Fig. S1C). Nine out of 24 (36%) modifications were differentially abundant between the two tissues (significance cutoff used: P-value ≤ 0.05, fold change ≥1.5, two-sample t-test). For example, in the sRNA fraction, the levels of m2,2G were higher in the liver, whereas m3U were higher in the epididymis (Fig. 1B). In the 70–90 nt fraction, which was primarily composed of mature tRNAs as determined by DM-tRNA-seq (Supplemental Fig. S1D), galactosyl-queuosine (galQ) and 2′-O-methyladenosine (Am) were higher in the epididymis, and 5,2′-O-dimethyluridine (m5Um) was relatively more abundant in the liver (Fig. 1C). The differences in modification levels between the two tissues may reflect the distinct tRNA composition of each tissue (Supplemental Fig. S1E), as individual tRNAs can carry unique combinations of modifications. However, in the case of galQ modification, higher galQ levels in the epididymis were not correlated with tRNA-Tyr abundance (the only tRNA known to have this modification) (Supplemental Fig. S1F; Zhang et al. 2020).
Liver and epididymis exhibit alterations in specific tRNA modifications in response to dietary alterations. (A) Schematic of the experimental design. Three-week-old male mice were fed one of three diets for 7 weeks: low-protein (LP), high-fat (HF), or control (C). Liver and epididymis (Epi) tissues were collected for downstream analyses. (B) Volcano plot of sRNA (16–40 nt) modification levels in the epididymis relative to the liver. Modifications detected at significantly differential levels between the two tissues are labeled on the plot (modifications that showed log2FC ≥ 0.585 and −log10(P-value) > 1.3). The color scale represents the fold change. Dot size reflects the −log10(P-value). n = 6 replicates. (C) Volcano plot showing significantly altered tRNA modifications (70–90 nt) in the epididymis relative to the liver (n = 6). (D–G) Volcano plots illustrating RNA modifications significantly altered by LP or HF diets in the liver and epididymis tissues (HF sample n = 3; control and LP sample n = 6). (H) Schematic of tissue-specific and diet-sensitive tRNA modifications identified by LC-MS/MS, annotated with positional information on the tRNA.
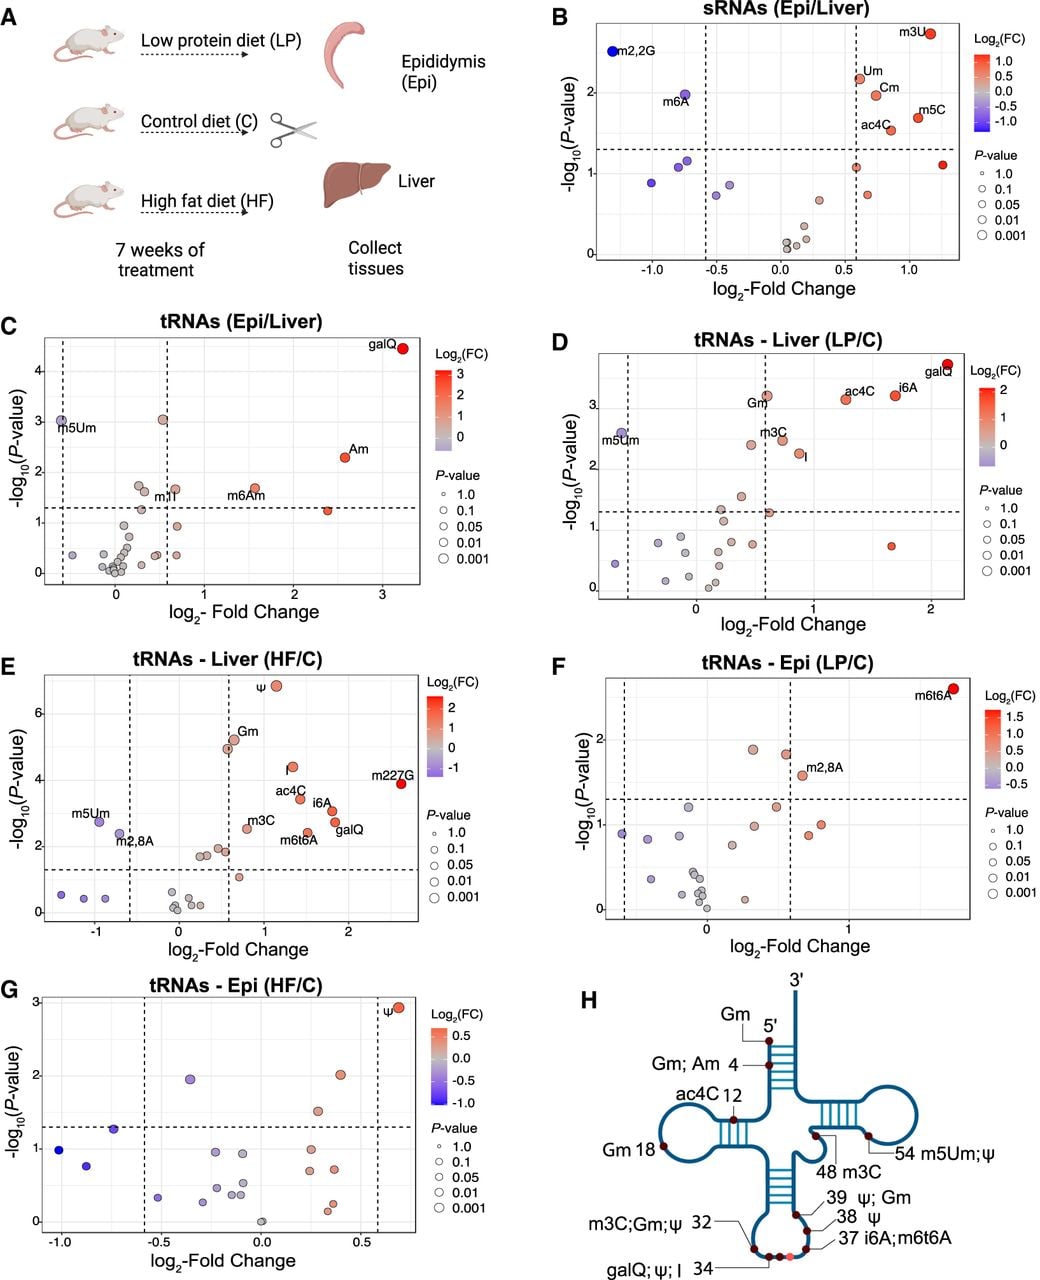
Next, we examined whether diet can alter the levels of RNA modifications in the liver and epididymis tissues. We fed male mice either a LP diet (10% protein), a HF diet (60% fat), or a control (C) diet (18% protein, 7.1% fat) from weaning until 10 weeks of age (Fig. 1A). As expected, mice fed a HF diet gained significant weight by the end of the intervention (Supplemental Fig. S1G), with no change in the weight of LP diet-fed mice, consistent with previous observations (Sharma et al. 2016). Modification levels in 16–40 nt sRNAs were primarily unaffected by either LP or HF diets (Supplemental Fig. S2A–D). In contrast, in full-length tRNAs, 46% of modifications (11 out of 24) exhibited diet-induced alterations (significance cutoff used: P-value ≤ 0.05, fold change ≥1.5, two-sample t-test) (Fig. 1D–G). The liver showed robust changes in response to dietary alterations, consistent with its central role in metabolism, digestion, and nutrient storage (Fig. 1D,E). Several RNA modifications were altered similarly under the two dietary conditions in the liver: galQ, N4-acetylcytidine (ac4C), N6-methyl-threonylcarbamoyl adenosine (m6t6A), m3C, 2′-O-methylguanosine (Gm), inosine (I), and N6-isopentenyladenosine (i6A) were upregulated, and m5Um was downregulated (Fig. 1D,E). In addition to these shared changes with LP diet, HF livers also showed an increase in pseudouridine (Ψ) and N2, N2, N7-trimethylguanosine (m2,2,7G) and downregulation of 2,8-dimethyladenosine (m2,8A) (Fig. 1E). These findings suggest that LP and HF diets impact overlapping and distinct pathways, leading to shared and unique alterations in hepatic tRNA modification landscapes. Additionally, the detection of alterations in m2,8A and m2,2,7G, which are typically enriched in rRNAs (Giessing et al. 2009) and snRNAs (Cheng et al. 2020), respectively, suggests that dietary interventions may influence RNA modifications across multiple RNA species not just tRNAs. The epididymis exhibited a modest response to dietary changes compared with the liver, with an increase in m6t6A and m2,8A levels in the LP condition and Ψ levels in the HF condition (Fig. 1F,G). As Ψ was upregulated in both the epididymis and liver tissues under HF and m6t6A upon LP dietary challenge, these diets potentially drive systemic changes in some tRNA modifications and may regulate key metabolic processes.
As shown in Figure 1H, many tRNA modifications altered by tissue type or dietary conditions have been reported to regulate translation fidelity and efficiency, whereas others play important roles in tRNA structural stability (Suzuki 2021). Together, these findings indicate that dietary metabolites can drive systemic and tissue-specific changes in modification levels.
Reproductive tract tissues and sperm show unique cytosolic and mitochondrial tRNA profiles
Although LC-MS/MS remains the gold standard for quantifying RNA modifications with high sensitivity and precision, it does not provide information on the specific tRNA species that are differentially modified, limiting insight into the transcript-level resolution of these changes. Therefore, to comprehensively profile tRNA abundance and modification status at single-nucleotide resolution, we sequenced tRNAs from various tissues using OTTR-seq (Gustafsson et al. 2025). To more robustly capture diet-induced changes, we further refined our experimental design for OTTR-seq (Fig. 2A). First, we extended dietary exposure to 6 months to better reflect long-term nutritional effects. Second, we introduced a more appropriate control for the HF diet, ensuring that the HF diet and its corresponding control diet (C_HF) differed only in fat content. Third, rather than analyzing the epididymis as a whole (as done in LC-MS/MS analysis), we separately examined the proximal caput and distal cauda segments of the epididymis, which are known to exhibit distinct gene expression patterns, including differential expression of RNA-modifying enzymes, and to play specialized roles in sperm maturation (Johnston et al. 2005; Begik et al. 2020; James et al. 2020; Rinaldi et al. 2020). Fourth, we broadened the scope of our tRNA expression and modification analysis to include additional tissues, namely, the heart, testis, and mature sperm, to assess systemic and tissue-specific responses to dietary interventions.
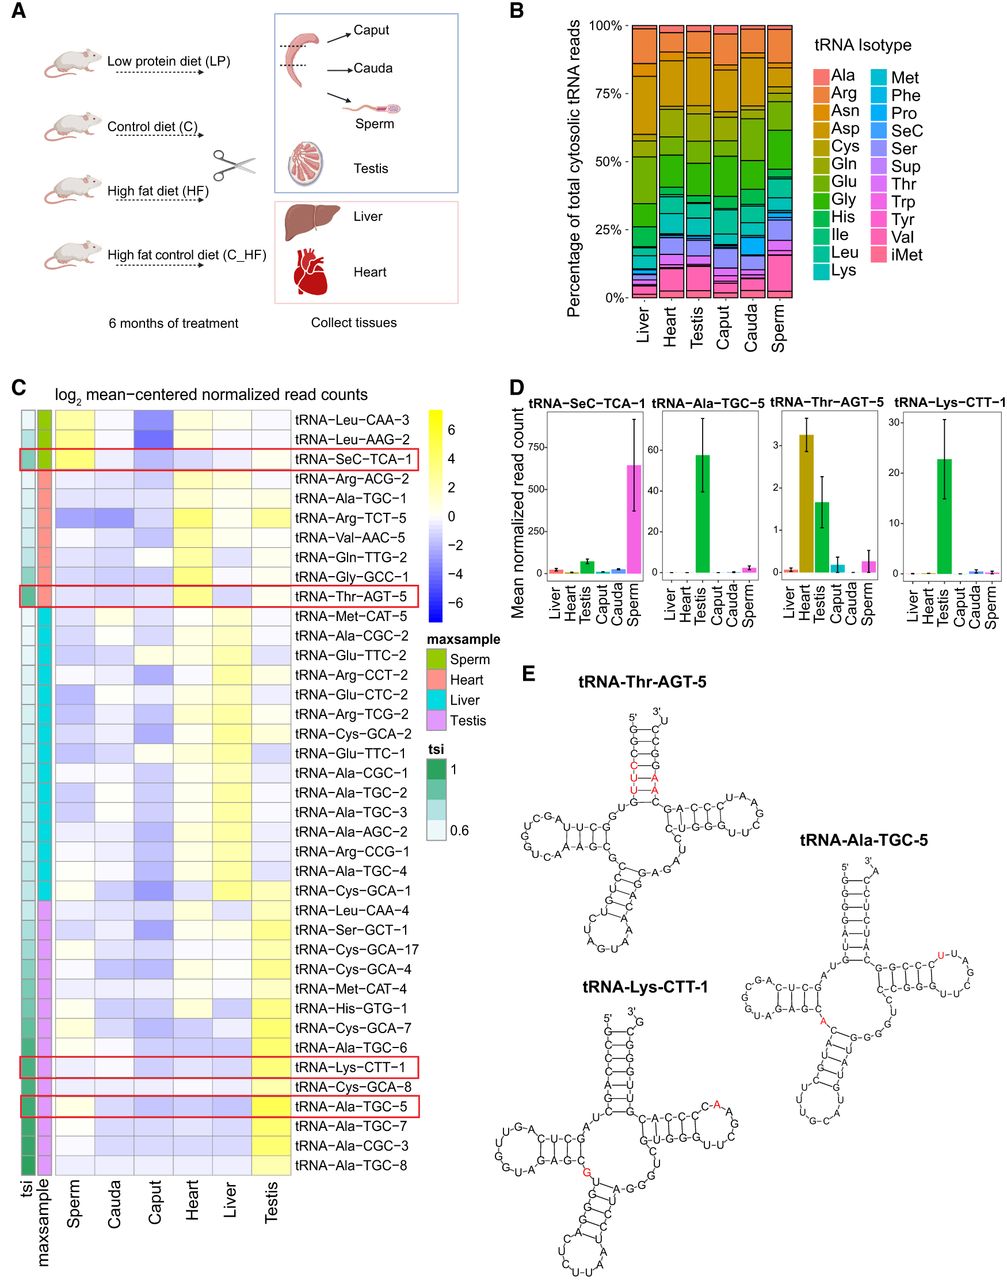
Tissue-specific expression of specific tRNAs. (A) Schematic of the experimental design. (B) Bar plot showing the percentage of read counts (>65 nt reads) for isotypes across tissues, with different isotypes color-coded. (C) Heatmap displaying log2 mean-centered tRNA-normalized read counts for the top 40 most sample-biased isodecoders along with their tissue specificity index (tsi) score and maximally abundant sample (maxsample). tRNAs are labeled by anticodon (5′–3′) throughout the figure, not by the corresponding mRNA codon. (D) Mean normalized read counts with standard error of a subset of tissue-biased tRNA isodecoders. (E) Secondary structure of a subset of top tissue-biased tRNAs. tRNA-Thr-AGT-5 is heart biased, and red bases in its structure highlight bases unique to that isodecoder of AGT tRNAs. In the secondary structure of tRNA-Ala-TGC-5, red bases highlight those that are only and always found in that tRNA as well as the tRNA isodecoders tRNA-Ala-TGC-6, tRNA-Ala-TGC-7, and tRNA-Ala-TGC-8 (other testis-biased isodecoders). Secondary structure of tRNA-Lys-CTT-1, highlighting in red bases that are unique to that isodecoder of CTT tRNA.
Mice were subjected to the dietary interventions described above; total RNA was isolated from tissues; and sequencing libraries were generated using OTTR-seq. OTTR-seq data were analyzed using tRNA analysis of expression (tRAX), an analytical pipeline designed for comprehensive profiling of tRNAs and modified nucleotides (Supplemental Table S1; Supplemental Fig. S3A,B; Chan et al. 2025). The relative abundance of different RNA types differed markedly across tissues (Supplemental Fig. S3C), with piRNAs being most enriched in the testis, consistent with their known germline-specific expression (Aravin et al. 2006; Girard et al. 2006; Kirino and Mourelatos 2007). Cauda epididymides showed the highest percentage of fragments of rRNAs (rsRNAs), as reported previously (Sharma et al. 2018; Shi et al. 2021). The most striking difference was in mt-tRNAs, with heart tissues exhibiting the highest proportion of mt-tRNA reads. This enrichment aligns with prior studies (Pinkard et al. 2020; He et al. 2021; Yu et al. 2023; Ando et al. 2025) and reflects the heart's high mitochondrial demand. At the level of specific sRNAs, OTTR-seq captured well-established tissue-specific miRNA expression patterns (Supplemental Fig. S3D). For example, miR-122 and miR-192 were highly enriched in liver tissue (Raut and Khanna 2016), whereas miR-499 and miR-1a-1 were detected exclusively in the heart (Dong et al. 2009). Likewise, miR-465 (Wang et al. 2020) and miR-34c (Bao et al. 2012) were most abundant in the testis, consistent with previous findings. Together, these results validated the sensitivity and accuracy of OTTR-seq in detecting tissue-specific sRNA expression.
To investigate tissue-specific and diet-induced changes in tRNA abundance and modification, we focused on >65 nt reads mapping to tRNAs, which comprise full-length and near-full-length tRNAs, hereafter referred to as tRNAs. For clarity, individual tRNAs are labeled throughout according to their anticodon sequence (written 5′–3′) rather than to the corresponding decoded mRNA codon. tRNA reads were summed by their respective amino acid decoding pool into 22 amino acid classes (tRNA isotypes) (Fig. 2B), and coverage of reads along the length of the tRNAs was examined (Supplemental Fig. S4A). Next, to count isoacceptors, although not double-counting genes, tRNA reads for which all mappings belonged to the same isoacceptor were counted toward that isoacceptor, yielding read counts per isoacceptor, and their relative abundance across tissues was measured (Supplemental Fig. S4B). These analyses revealed differential isoacceptor abundance among these tissues, suggesting tissue-specific translational tuning.
We focused on the tissue-specific expression patterns of tRNAs that share an anticodon but differ in the sequence outside of the anticodon (tRNA isodecoders) to determine whether these additional tRNAs could serve tissue-specialized roles. A tissue specificity index (tsi) score (Yanai et al. 2005) was calculated, revealing the distinct tissue-biased abundance of several tRNA isodecoders (Fig. 2C,D). The testis exhibited the most and highest-scoring tissue-biased tRNAs. These findings are consistent with the testis being a tissue with uniquely high gene expression diversity and specificity (Soumillon et al. 2013; Djureinovic et al. 2014). Moreover, previously identified brain-specific isodecoders of tRNA-alanine (tRNA-Ala-TGC-5, -6, -7, and -8) (Pinkard et al. 2020) showed the highest testis-biased expression. These results corroborate previous studies highlighting molecular and biochemical similarities between the brain and testis (Guo et al. 2005; Matos et al. 2021).
To examine sequence features distinguishing tissue-enriched tRNAs, we analyzed the predicted secondary structures of a subset of isodecoders displaying tissue-specific expression (Fig. 2E). tRNA-Thr-AGT-5, which is highly expressed in the heart (Fig. 2C,D), exists as a single orphan copy in the mouse genome. This tRNA contains several unique nucleotides within the acceptor stem that are not present in other AGT isodecoders (Fig. 2E, highlighted in red), suggesting potential effects on tRNA folding stability or structural dynamics. Alanine TGC isodecoders, tRNA-Ala-TGC-5, tRNA-Ala-TGC-6, tRNA-Ala-TGC-7, and tRNA-Ala-TGC-8, are enriched in the testis (Fig. 2C,D). These tRNAs share distinctive sequence features among alanine tRNAs, including an adenosine at position 26 and a uridine at position 60 (Fig. 2E). The presence of A26 prevents formation of the m²,²G modification at position 26, a modification otherwise present in other TGC tRNAs and many other isoacceptors, suggesting that these testis-enriched TGC tRNAs may be selectively excluded from this modification pathway. We also examined tRNA-Lys-CTT-1, another testis-enriched tRNA that exists as a single-copy gene in the mouse genome (Fig. 2C). This tRNA contains several unique nucleotides relative to other CTT isodecoders, including a G at position 26, which permits the presence of the m²,²G modification, in contrast to the change in alanine TGC tRNAs in the same tissue described above. In addition, an A at position 59 is unique in this isodecoder (Fig. 2E). Together, these structural features highlight sequence variation among tissue-enriched tRNA isodecoders that may influence tRNA folding and modification potential, suggesting a possible mechanism for tissue-specific regulation of tRNA function.
Following protamination, it is believed the paternal genome becomes transcriptionally and translationally inert and gets tightly compacted within the sperm nucleus (Gardiner-Garden et al. 1998; Wykes and Krawetz 2003). In the absence of cytosolic translational activity, it is expected that sperm lack mature tRNAs. However, we detected multiple full-length tRNAs in sperm (Supplemental Fig. S4A), with the isotype composition of sperm tRNAs notably distinct from somatic and other reproductive tissues (Fig. 2B). Studies have detected nuclear-encoded mRNAs in mature sperm, likely transcribed during spermatogenesis (Ostermeier et al. 2004; Sun et al. 2021). Moreover, a prior study revealed that mitochondrial ribosomes direct the translation of nuclear-encoded genes in sperm; inhibition of this pathway leads to substantial reductions in sperm motility, actin polymerization, the acrosome reaction, and in vitro fertilization efficiency (Gur and Breitbart 2006). Thus, our findings of full-length tRNAs in mature sperm suggest that these tRNAs could be involved in translation of proteins important for proper sperm function. tRNA-Sec-TCA-1 showed the highest sperm-biased expression (Fig. 2C,D). This tRNA is responsible for incorporating selenocysteine into selenoproteins. Selenoproteins have been implicated in maintaining sperm quality and male fertility, particularly by protecting sperm from oxidative stress during spermatogenesis (Watanabe and Endo 1991; Kaur and Bansal 2005; Qazi et al. 2019). The elevated levels of tRNA-Sec-TCA-1 in sperm may reflect a heightened demand for selenoprotein biosynthesis, supporting a specialized antioxidant environment crucial for maintaining sperm viability and function.
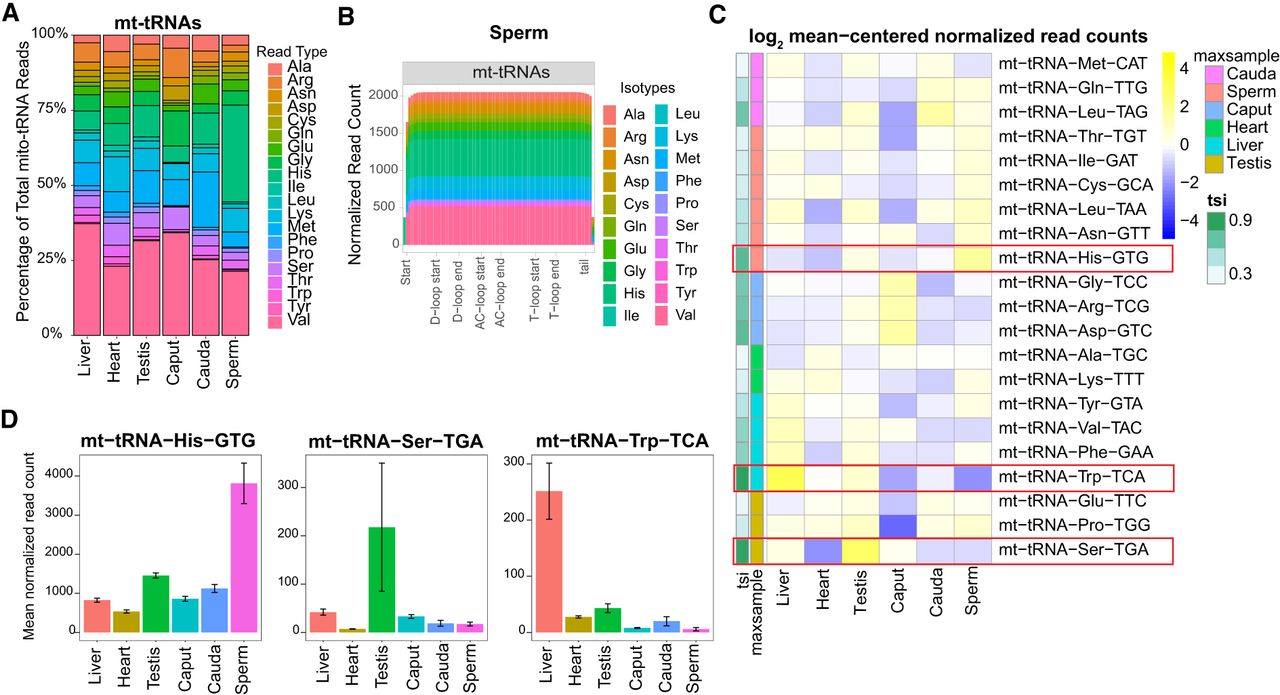
We also observed tissue-biased expression of specific mt-tRNAs (Fig. 3A–C) and detected full-length mt-tRNAs in sperm (Fig. 3B), consistent with recent reports (Scacchetti et al. 2024; Tomar et al. 2024). mt-tRNA-Trp-TCA showed liver-biased expression, and mt-tRNA-Ser-TGA exhibited testis-biased expression (Fig. 3C,D). Although sperm and cauda generally showed similar tRNA expression patterns (Supplemental Fig. S5), mt-tRNA-His-GTG displayed sperm-biased expression (Fig. 3A–D). As mitochondrial ribosomes are actively involved in protein translation (Gur and Breitbart 2006; Gur and Breitbart 2008), a high abundance of mt-tRNA-His-GTG in sperm suggests a potential role in regulating sperm mitochondrial biology. Histidine supplementation has been reported to protect against lead-induced reproductive toxicity by stabilizing mitochondrial function (Ommati et al. 2019). Higher levels of mt-tRNA-His-GTG could enhance mitochondrial protein synthesis, aiding the cellular response to oxidative stress and preserving sperm function. Taken together, these data demonstrate the presence of mature, full-length cytosolic and mitochondrial tRNAs in sperm and reveal a distinct expression profile that warrants further investigation for its potential role in sperm biology.
Diverse expression of mitochondrial tRNAs (mt-tRNAs) across tissues. (A) Bar graph showing the percentage of read counts for >60 nt mt-tRNA isotypes across tissues, with different isotypes color-coded. (B) Read coverage plots for >60 nt reads mapped to mt-tRNA genes in sperm. The x-axis indicates nucleotide positions on tRNA genes, and the y-axis represents normalized read counts. Different tRNA isotypes are color-coded. (C) Heatmap showing log2 mean-centered normalized read counts of mt-tRNAs across all tissue samples with their specificity score (tsi) and the maximally abundant samples (maxsample). mt-tRNA-His-GTG is highlighted in a red box as it shows sperm-biased expression. (D) Mean normalized read counts of top tissue-biased mt-tRNAs.
Tissue-specific signatures of tRNA modifications revealed by mismatch profiling
The RT used in OTTR-seq can read through certain modified nucleotides more efficiently than other enzymes, which often stall at these sites. However, it frequently introduces errors by incorporating incorrect nucleotides or skipping bases at those positions. These misincorporation signatures in the sequencing reads can be used to infer the presence and location of specific tRNA modifications (Kuksa et al. 2017). Indeed, we detected misincorporations at known tRNA modification sites (Mathlin et al. 2020; Behrens et al. 2021; Suzuki 2021; Lucas et al. 2024), including at positions 9 (m1G), 26 (m2,2G), 34 (m3C and I), 37 (m1G, m1I, and others), and 58 (m1A) (Fig. 4A). We also detected misincorporations at previously reported mt-tRNA modification sites (Suzuki et al. 2020) and new, previously uncharacterized modified nucleotides (Fig. 4B). Notably, the m1A9 modification has been identified in most mt-tRNAs (Suzuki et al. 2020) and is crucial for proper tRNA folding (Helm et al. 1999). Consistent with these reports, we detected mismatch signatures at position 9 in most mt-tRNAs (Fig. 4B). We also detected misincorporation at positions 26, 32, and 37 in a subset of mt-tRNAs previously reported to be modified in humans (Fig. 4B; Supplemental Fig. S6; Suzuki et al. 2020). For instance, mt-tRNA-Pro and mt-tRNA-Leu, which harbor m1G at position 37 in humans, showed clear mismatch signals in mouse tissues (Supplemental Fig. S6). Similarly, mt-tRNA-Tyr, -Trp, and -Phe, known to carry ms2i6A at position 37 in humans, exhibited misincorporation at this site. At position 32, mismatches were observed exclusively in mt-tRNA-Ser and -Thr, consistent with reported m³C modifications in humans. In contrast, position 26 showed broader misincorporation across mt-tRNA-Gln, -Glu, -Leu, and -Lys in our mouse data, whereas human data identified m²G or m²,²G modifications primarily in mt-tRNA-Ala, -Glu, -Arg, and -Ile. These results suggest species-specific differences exist in the modification landscape, whereas many mt-tRNA modification sites are conserved.
tRNA modification levels differ across mouse tissues. (A,B) Plots showing misincorporation rates across all positions (x-axis) of cytosolic tRNAs (A) and mitochondrial tRNAs (B), color-coded by isotype. Previously characterized modified positions are highlighted in bold. Plots showing maximum misincorporation rates for all samples for each tRNA. (C) Number of modifications in each tRNA isodecoder detected. (D) Misincorporation plot showing mismatch rates at position 58 on tRNA-Glu-CTC-1 across all tissue types. The plot compares the percentage of each nucleotide or deleted (skipped) base detected at this position. As described in the key, A is the reference base, and A to C, A to G, A to T, or deletion are the misincorporation signatures. (E) Misincorporation plot showing mismatch rates at position 9 on tRNA-Gly-TCC-1 across all tissue types. The plot compares the percentage of each nucleotide or deleted (skipped) base detected at this position. (F) Heatmap showing average mismatch levels at each position for glutamic acid tRNAs. (G) Heatmap showing average mismatch levels at each position for a subset of tRNA-Gly isodecoders.
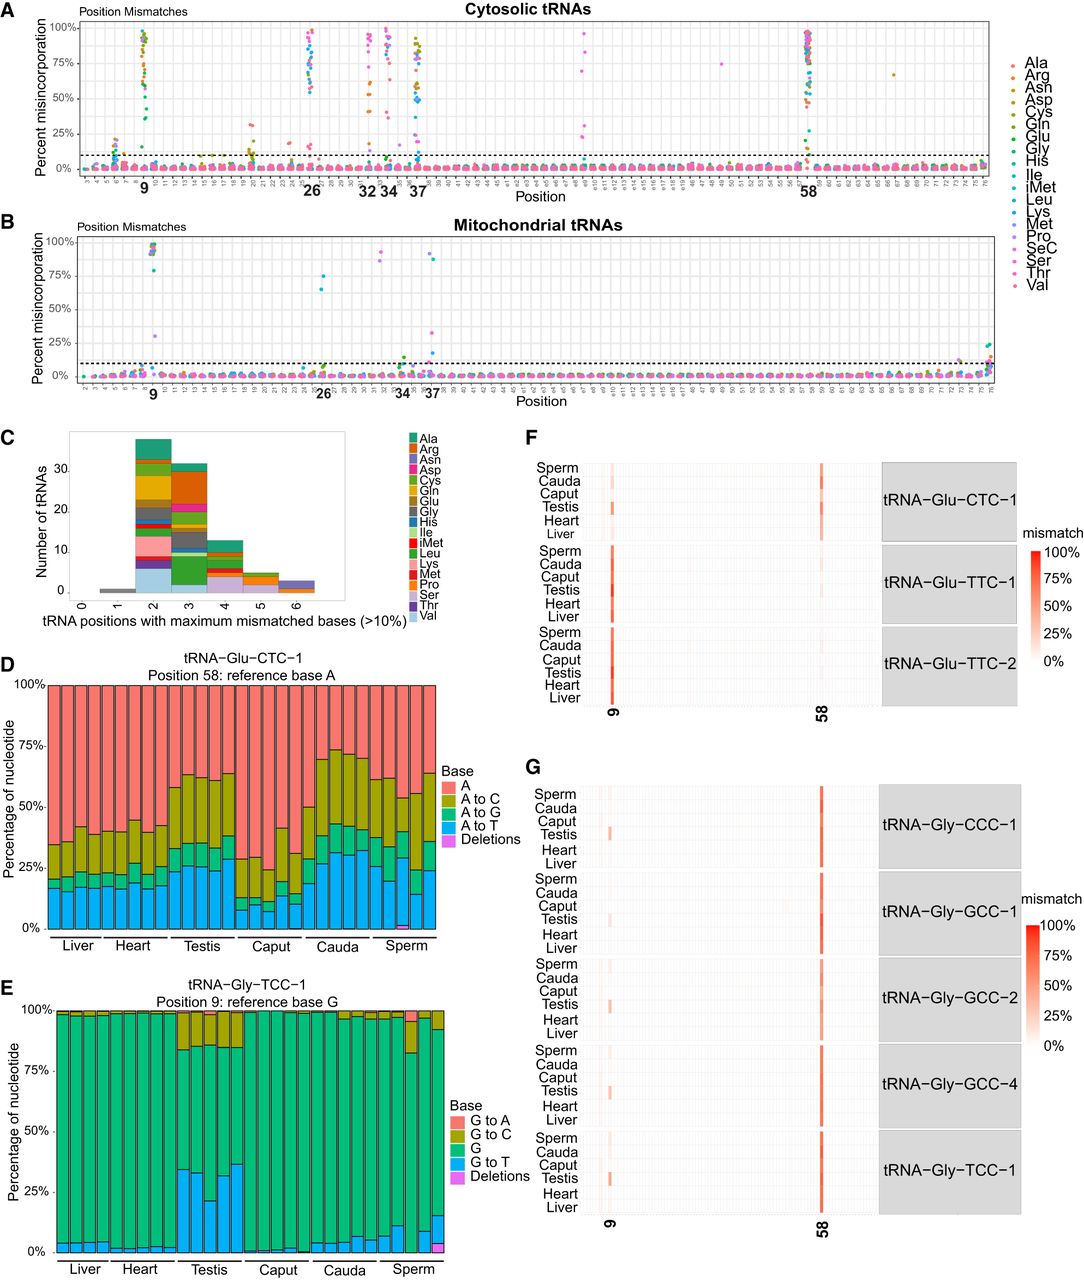
Examination of modified positions per tRNA revealed that although the majority of tRNAs have two modified bases, a few had as many as six modified bases (Fig. 4C), indicating substantial heterogeneity in modification density across tRNAs. As the specific misincorporation pattern at modified bases depends on the sequence context, the type of RT enzyme used, and other influencing factors (Hauenschild et al. 2015), absolute modification levels cannot be inferred solely from mismatch frequency. However, relative differences in base misincorporation across samples can be used to examine changes in modification status at specific positions. A comparison of misincorporation levels across tissues revealed 31 unique tRNA positions with differential misincorporation rates between tissues (significance cutoff used: P-value < 0.05, Mann–Whitney U test) (Supplemental Table S2). For instance, an unmodified adenosine at position 58 is read correctly as “A” with near-perfect accuracy, whereas a m1A modification typically results in a mismatch (A to T, A to C, or A to G) or deletion. In some cases, however, RT reads through the modification and incorporates an “A,” leading a subset of reads to still report A at fully modified bases. We observed tissue-specific variation in the mismatch signature at A58 (Fig. 4D,F; Supplemental Fig. S7A–D), including modest differences across isoacceptors such as tRNA-Val-CAC and tRNA-Val-TCA (Supplemental Fig. S7A,B). For example, the misincorporation rate in tRNA-Glu-CTC-1 at A58 was significantly higher in testis and cauda epididymis (Fig. 4D,F). In contrast, tRNA-Glu-TTC-1 and tRNA-Glu-TTC-2 were minimally modified at A58 and highly modified at position 9 (Fig. 4F), revealing isoacceptor-specific modifications in this tRNA.
In addition to position A58, we observed tissue-specific misincorporation signatures at other known modification sites, including position 9 (m1G) (Fig. 4E–G). In tRNA-Glu-CTC-1, the mismatch rate at position 9G was markedly higher in the testis compared with other tissues (Fig. 4F). Similarly, for tRNA-Gly, we detected high levels of misincorporation at position 9 in testis tissue; however, unlike tRNA-Glu, this pattern was observed across all sequenced isoacceptors (Fig. 4E,G). This pattern is consistent with previously reported high expression levels of the m1G methyltransferase enzyme TRMT10A in the testis, suggesting a potential link between enzyme expression and tRNA modification at this site (Guo et al. 2023). We also observed tissue-specific mismatch profile at nine unique mt-tRNA positions (Supplemental Table S3). For example, sperm exhibited the lowest levels of m1A at position 9 in mt-tRNA-His-GTG compared with other tissues (Supplemental Fig. S7E). These tissue-specific modification signatures could regulate translation, tRNA stability, biogenesis of fragments, or interactions with other proteins in a tissue-specific manner.
To explore whether misincorporation levels, which reflect underlying tRNA modifications, are associated with the abundance of the corresponding tRNA molecules, we examined the correlation between mismatch rates and tRNA expression levels at frequently modified positions: positions 9, 26, 32, 34, 37, and 58. This analysis revealed that although some tRNAs show correlation between misincorporation frequency and tRNA abundance, the majority do not exhibit such a correlation across tissues (Supplemental Fig. S8). This analysis indicates that most of the observed changes in modifications are not simply explained by altered transcript abundance but rather reflect regulation at the level of modification itself. Although the possibility that such relationships may exist at the single-molecule level cannot be ruled out, this suggests that distinct mechanisms likely govern tRNA abundance versus modification and that modifications can be selectively regulated independent of the transcript levels, likely via tissue-specific expression of RNA-modifying enzymes.
Dietary composition modulates tRNA abundance in a tissue specific manner
Next, we assessed the impact of dietary interventions on tRNA expression. Overall, liver and heart tissues showed a more robust response to dietary changes compared with reproductive tract tissue (DESeq2 analysis, significance cutoff: fold change >1.5 and adjusted P-value < 0.05) (Fig. 5), likely reflecting the central metabolic roles of these organs and their heightened sensitivity to dietary nutrient availability. A LP diet led to decrease in expression of tRNA genes in most tissues, except for caput, in which numerous tRNAs were upregulated (Fig. 5A–F). A HF diet, on the other hand, led to increased tRNA expression in all tissues, except for sperm, which showed downregulation of specific tRNAs (Fig. 5G–L). Moreover, some of these changes led to overall alteration at the tRNA isoacceptors (Supplemental Fig. S9), changing the anticodon pool and potentially translational output. For example, there is an overall reduced abundance of tRNA-CAC, tRNA-AAC, and tRNA-TAC in LP heart tissue, corresponding with reduced levels of tRNA-Val-CAC-2, tRNA-Val-AAC-1, tRNA-Val-AAC-5, and tRNA-Val-TAC-1 isodecoders in this tissue. In other cases, although the levels of a specific isodecoder are altered (e.g., tRNA-Arg-CCG-3 is down in both LP liver and heart), those changes do not result in changes in tRNAs isoacceptor levels, indicating translation-independent downstream effects.
Dietary alterations influence tRNA abundance. (A–F) Volcano plots showing significantly altered tRNAs in low-protein diet (LP) condition relative to the control diet (C). (G–L) Volcano plots showing significantly altered tRNAs in high-fat diet (HF) condition relative to control for high-fat diet (C-HF). Differentially expressed tRNAs are highlighted in red (upregulated) and blue (downregulated), with the top 10 differentially expressed tRNAs labeled. The significant changes were determined using DESeq2 analysis with a cutoff of a log2 fold change of >1.5 and adjusted P-values < 0.05.
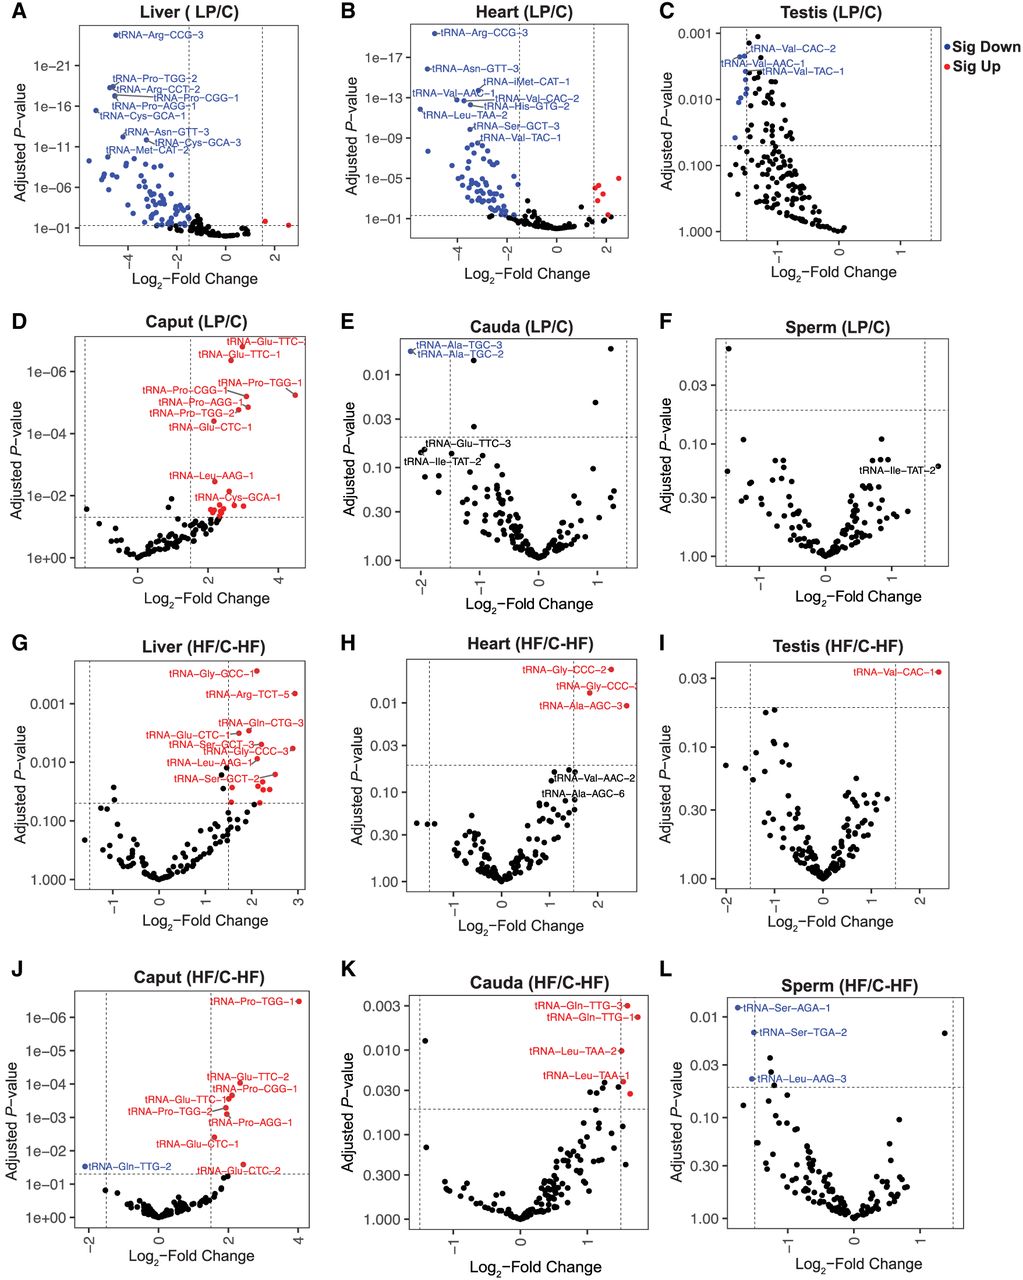
Among the reproductive tissues, caput exhibited the most changes in response to dietary challenge, with several tRNAs consistently upregulated in both LP and HF caput tissues: tRNA-Glu-CTC-1, tRNA-Glu-CTC-2, tRNA-Glu-TTC-1, tRNA-Glu-TTC-2, tRNA-Pro-AGG-1, tRNA-Pro-CGG-1, tRNA-Pro-TGG-1, and tRNA-Pro-TGG-2 (Fig. 5D,J). These alterations at the isodecoder level contributed to an overall increase in tRNA isoacceptors containing CTC, TTC, CGG, and TCC anticodons in both LP and HF diet groups relative to controls (Supplemental Fig. S9D,J). These shared changes suggest activation of common molecular pathways in response to both nutritional challenges, irrespective of the challenge. Testis, cauda, and sperm showed only a few changes in response to these dietary challenges, but these changes were not consistent across diets and did not lead to isoacceptor-level changes. Together, these findings highlight the caput as the most diet-sensitive reproductive tissue in our analysis and suggest that in addition to regulating sperm fertility it may also play a role in sensing metabolic status.
Diet alters tRNA-mismatch signature across mouse tissues
To identify tRNA modification changes in response to dietary challenges, we next analyzed misincorporation rates among tissues from the LP and HF groups relative to their controls. Analysis of mismatch rates at individual tRNA positions identified 17 unique tRNA sites with significantly altered misincorporation rates in response to dietary challenges (Mann–Whitney U test comparing mismatch rates across replicates between conditions; P < 0.05) (Supplemental Table S2). The most frequently affected modification was m1A at position 58, which is known to be present in the majority of tRNAs. For example, in the liver and heart tissues, tRNA-iMet-CAT-1 exhibited a lower misincorporation rate at A58 (reflecting lower m1A58 levels) in LP compared with the control group (Fig. 6A). In the LP heart tissues, there was also a significant decrease in the levels of misincorporation at A58 in tRNA-Glu-CTC-1, tRNA-Asp-GTC-2, tRNA-Gly-CCC-1, tRNA-Gly-GCC-1, tRNA-Gly-GCC-2, and tRNA-Gly-TCC-1 (Fig. 6B). Given that m1A58 modification in tRNA-Glu-CTC-1 is also regulated in a tissue-specific manner (Fig. 4D,F), it is tempting to speculate that this site is highly dynamic and can be controlled by intrinsic and extrinsic factors. Moreover, as we detected reduced m1A58 in initiator tRNA-iMet-CAT-1 in both tissues, dietary challenge potentially leads to a systemic effect on translation initiation (Anderson et al. 1998; Kadaba et al. 2004; Liu et al. 2016). m1A58 and m1G9 modifications contribute to stabilizing tRNA structure and, thereby, its stability (Helm et al. 1999; Voigts-Hoffmann et al. 2007). Thus, a reduction in these modifications in response to dietary protein restriction may compromise tRNA structure, potentially affecting translation efficiency and fidelity.
Dietary alterations impact tRNA modification levels. (A) Mismatch rates at position 58 of tRNA-iMet-CAT-1 in C and LP liver and heart samples, with nucleotide percentages represented by different colors and reference bases as A. Liver_C_1 was excluded from analyses owing to insufficient coverage (fewer than 20 reads at position 58). (B) Heatmap showing mismatch rates at all positions in specific tRNA isodecoders in heart tissues under LP and C diet conditions. (C,D) Histograms show the number of tRNAs and the difference in median mismatch rates at position 9 in LP tissues relative to C (C) and HF tissues relative to C_HF (D). (E,F) Histograms show the number of tRNAs and their median mismatch rates at position 58 in LP tissues relative to C (E) and HF tissues relative to C_HF (F). A Wilcoxon signed-rank test comparing median mismatch rates across tRNAs between dietary conditions and matched controls was performed to identify significant changes (P < 0.05).
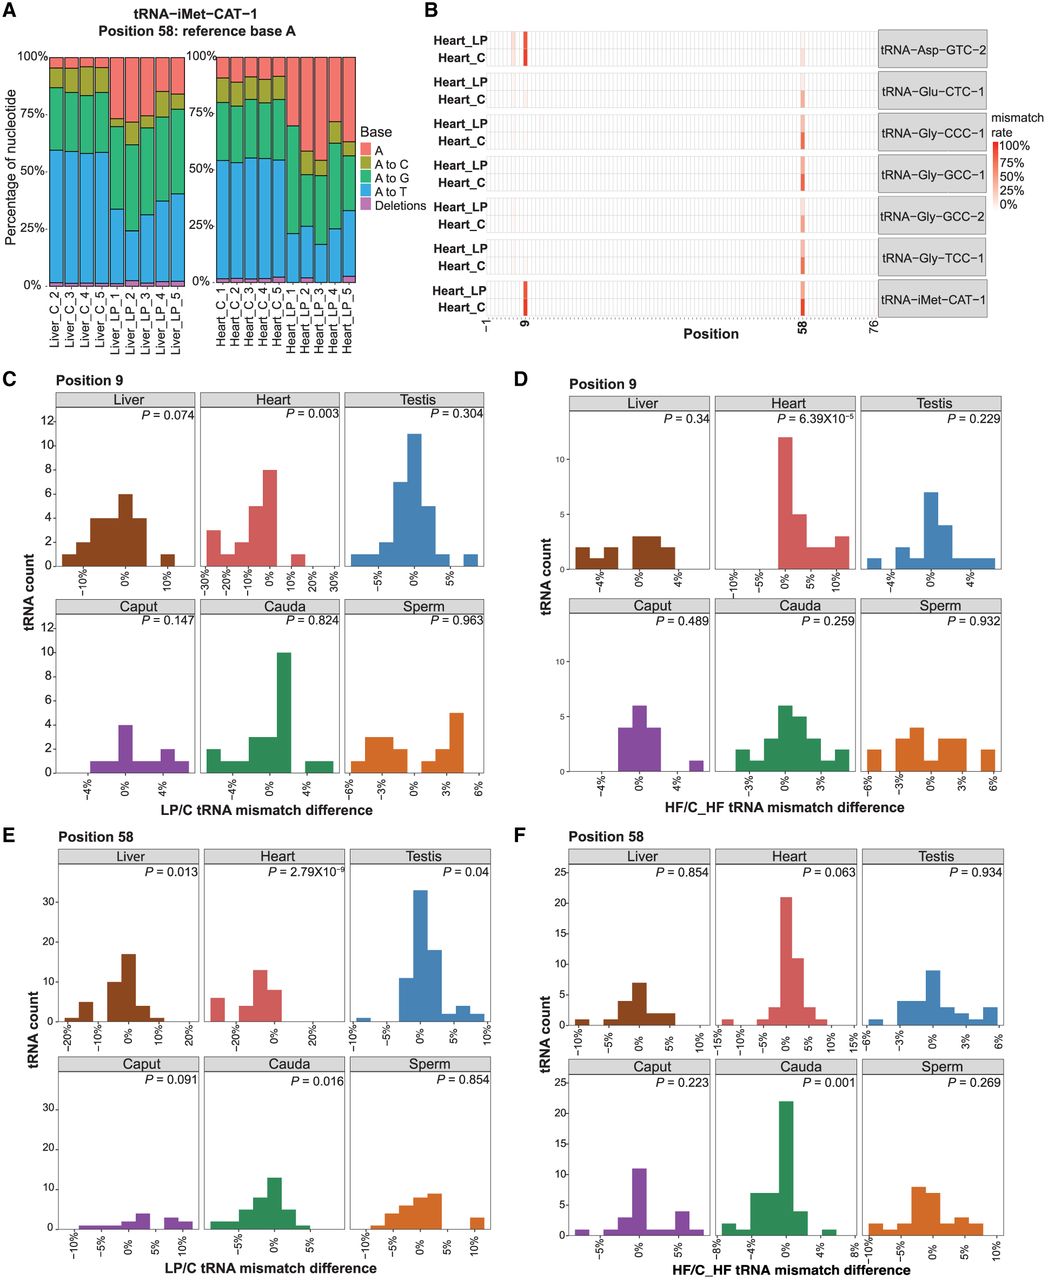
As modest but coordinated shifts across multiple tRNAs may not reach significance in site-specific analyses when effect sizes are small relative to interreplicate variability, we next assessed global mismatch patterns across tRNAs in response to dietary alterations at positions 9 and 58. For each tRNA position, we calculated the median mismatch rate across replicates for LP and HF conditions relative to their respective controls. This analysis revealed widespread changes in mismatch signatures, with broad shifts observed in the heart at position 9 under LP and HF conditions (Wilcoxon signed-rank test comparing median mismatch rates across tRNAs between dietary conditions and matched controls, P < 0.05) (Fig. 6C,D). At position 58, heart, liver, testis, and cauda tissues showed significant changes in mismatch rate in response to the LP diet (Fig. 6E) and cauda tissue under HF conditions (Fig. 6F). We found that tissues from animals exposed to the two control diets (C and C_HF) also showed differences in modification levels at position 9 and 58 (Supplemental Fig. S10), indicating that the two control diets differ in their impact on tRNA modifications. A comparison of their compositions revealed substantial differences in both fat source and fatty acid profile: The C diet is soybean oil based and rich in polyunsaturated fatty acids, whereas C_HF contains lard as its primary fat source, resulting in higher levels of saturated and monounsaturated fatty acids. Importantly, each dietary intervention was compared exclusively against its matched control diet, ensuring that the LP versus C and HF versus C_HF comparisons remain internally valid and properly controlled. The observation that these compositional differences alone are sufficient to alter tRNA modification signatures demonstrates that the tRNA epitranscriptome is exquisitely sensitive to dietary fat quality and not just overall macronutrient quantity, even in the absence of an overt dietary challenge. Together with the LP and HF diet comparisons above, these findings reveal that tRNA modifications respond to a broad spectrum of nutritional inputs.
Dietary conditions alter mitochondrial-tRNA abundance and modifications
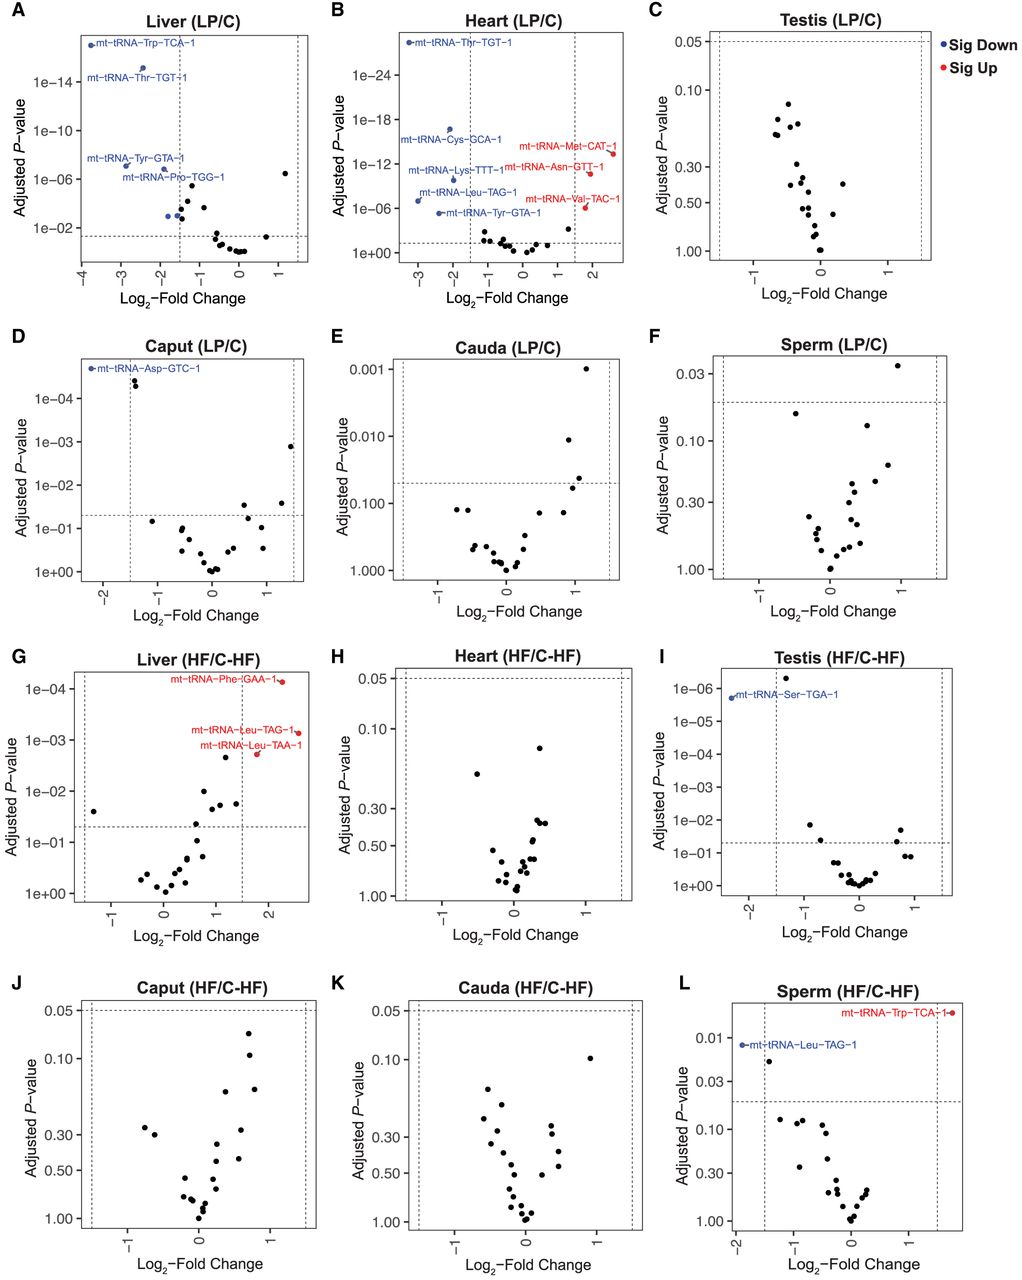
Given the observed alterations in cytosolic tRNAs, we next investigated whether mt-tRNA levels and modifications are also affected by dietary changes. The mitochondrial genome encodes 22 distinct tRNAs, each representing a unique isotype (D'Souza and Minczuk 2018). Similar to cytosolic tRNAs, liver and heart tissues showed the most pronounced diet-induced changes in mt-tRNA abundance in response to the LP diet (Fig. 7A,B,G,H). Notably, several tRNAs, including mt-tRNA-Thr-TGT and mt-tRNA-Tyr-GTA, were consistently downregulated in both LP liver and LP heart, suggesting shared metabolic responses to protein restriction (as observed for a subset of cytosolic tRNAs). Although the cytosolic tRNA-Val-TAC was downregulated in the LP heart (Fig. 5B,D,F), mt-tRNA-Val-TAC was upregulated in this tissue (Fig. 7B). These data suggest differential control of tRNA levels for pairs of isoacceptors partitioned between mitochondria and the nucleus, as observed previously in response to cellular stress (Pang et al. 2014). Differential abundance of the same isoacceptors in the cytosol and mitochondria may enable distinct translational regulation of protein restriction response in each compartment. In contrast to the liver and heart, reproductive tissues exhibited limited changes in mt-tRNA expression in response to dietary interventions (Fig. 7C–F,I–L). Specifically, mt-tRNA-Ser-TGA was downregulated in HF testis (Fig. 7I), mt-tRNA-Asp-GTC was downregulated in the LP caput (Fig. 7D), and mt-tRNA-Leu-TAG was down, whereas mt-tRNA-Trp-TCA increased in HF sperm (Fig. 7L). Although the functional significance of these alterations remains to be investigated, previous studies have implicated mt-tRNAs in transmission of paternal HF dietary effects to offspring (Tomar et al. 2024).
Diet-induced changes in mitochondrial-tRNA abundance. (A–F) Volcano plots showing significantly altered mt-tRNAs in low-protein diet (LP) condition relative to the control diet (C). (G–L) Volcano plots showing significantly altered mt-tRNAs in high-fat diet (HF) condition relative to control for high-fat diet (C-HF). Differentially expressed mt-tRNAs are highlighted in red (upregulated) and blue (downregulated), with the top 10 differentially expressed tRNAs labeled. The significant changes were determined using DESeq2 analysis with a cutoff of a log2 fold change of >1.5 and adjusted P-values < 0.05.
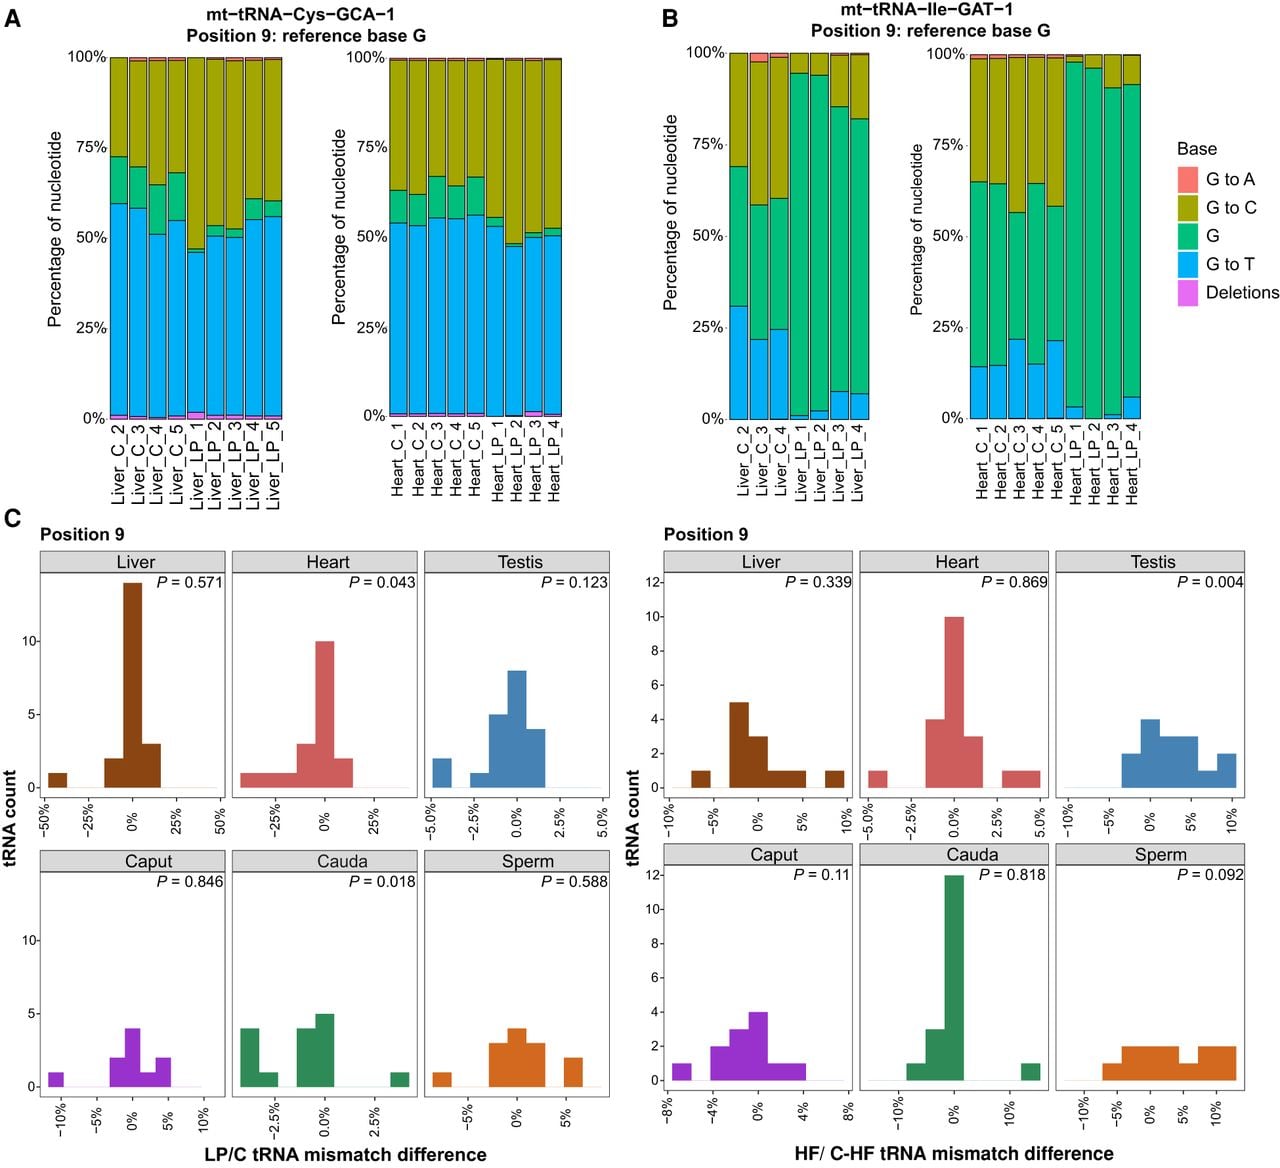
Next, we examined mismatch signatures in mt-tRNAs to assess the impact of dietary perturbations. Analysis of mismatch rates at individual tRNA positions identified six mt-tRNA sites with significantly altered misincorporation rates in response to dietary challenges (Mann–Whitney U test comparing mismatch rates across replicates between conditions; P < 0.05) (Fig. 8A,B; Supplemental Fig. S11; Supplemental Table S3). For instance, the LP diet led to increased m1G at position 9 in mt-tRNA-Cys-GCA and decreased m1G9 levels in mt-tRNA-Ile-GAT in both liver and heart tissues (Fig. 8A,B). To detect subtle coordinated shifts across mt-tRNAs, we next analyzed global mismatch patterns. For each tRNA position, we calculated the median mismatch rate across replicates for LP and HF conditions relative to their respective controls. This analysis revealed widespread changes in mismatch signatures at position 9, with broad shifts observed in the heart and cauda epididymis under LP conditions, as well as alterations in the testis under HF exposure (Wilcoxon signed-rank test comparing median mismatch rates across mt-tRNAs between dietary conditions and matched controls, P < 0.05) (Fig. 8C). Together, these findings indicate that, akin to cytosolic tRNAs, dietary composition modulates mt-tRNA abundance and modification status.
Dietary challenges modulate mt-tRNA modifications. (A,B) The mismatch incorporation rates (y-axis) for position 9 for mt-tRNA-Cys-GCA (A) and mt-tRNA-Ile-GAT (B), comparing C and LP diet conditions in heart and liver tissues. Heart_LP_5 sample is omitted from the plots because it had fewer than 20 reads covering position 9. Similarly, because of insufficient read coverage at position 9 for the mt-tRNA, Liver_C_1 is excluded from both plots for mt-tRNA-Cys-GCA and mt-tRNA-Ile-GAT, and Liver_LP5 is excluded from the mt-tRNA-Ile-GAT plot. In all cases, at least three replicates are analyzed. (C) Histograms show number of mt-tRNAs and the difference in median mismatch rates at position 9 in LP tissues relative to C tissues and HF tissues relative to C_HF tissues. A Wilcoxon signed-rank test comparing median mismatch rates across tRNAs between dietary conditions and matched controls was performed to identify significant changes (P < 0.05).
Discussion
Using LC-MS/MS for bulk modification quantification and OTTR-seq for single-nucleotide resolution profiling, we provide a comprehensive, tissue-resolved map of both cytosolic and mitochondrial tRNA expression and modification landscapes across somatic and reproductive tissues and demonstrate that both are reshaped by dietary composition.
Pioneering work from many groups has established that tRNA abundance and modifications are highly dynamic under both healthy and disease states (Zaborske et al. 2009; Goodarzi et al. 2016; Pinkard et al. 2020; Huber et al. 2022; Zhang et al. 2022; Scacchetti et al. 2024; Gustafsson et al. 2025), and recent studies have begun to uncover the tRNA landscape of specific mouse tissues (Dittmar et al. 2006; Pinkard et al. 2020; Scacchetti et al. 2024; Gustafsson et al. 2025). Here, we extend this foundation by comprehensively profiling tRNAs across multiple somatic and reproductive tissues, including the liver, heart, testis, caput and cauda epididymis, and mature sperm, adding to the growing appreciation of the unique tRNA profiles in the male reproductive tract (Scacchetti et al. 2024; Gustafsson et al. 2025). Among the tissues examined, the testis showed the highest number of tissue-biased tRNA isodecoders, including expression of brain-specific isodecoders of tRNA-alanine (tRNA-Ala-TGC-5, tRNA-Ala-TGC-6, tRNA-Ala-TGC-7, and tRNA-Ala-TGC-8) (Pinkard et al. 2020), consistent with the well-documented molecular similarities between these two tissues (Guo et al. 2005; Matos et al. 2021).
A particularly striking observation was the detection of multiple full-length cytosolic tRNAs in mature sperm by OTTR-seq, despite sperm being transcriptionally and translationally inactive. This is consistent with numerous studies demonstrating that sperm retain a complex and selectively regulated RNA complement, including mRNAs, miRNAs, piRNAs, and tRNA- and rRNA-derived fragments, established during spermatogenesis and further remodeled during epididymal maturation (Ostermeier et al. 2002, 2004; Peng et al. 2012; Sharma et al. 2016; Sun et al. 2021). The detection of multiple tRNA species in sperm, together with a distinct isotype composition of sperm tRNAs relative to somatic and other reproductive tissues, likely reflects selective retention or differential stability of specific tRNA species rather than residual translational activity and may contribute to sperm maturation or postfertilization processes. Notably, tRNA-SeC-TCA-1 showed the highest sperm-biased expression among all examined tRNAs, which may be related to the role of selenoproteins in protecting sperm from oxidative stress (Kaur and Bansal 2005; Qazi et al. 2019). Selenocysteine incorporation into proteins is a highly specialized and tightly regulated process that requires a SECIS element in the 3′ UTR together with dedicated elongation factors and accessory proteins, ensuring selective recoding of UGA codons and limiting inappropriate stop codon readthrough (Forchhammer et al. 1989; Zinoni et al. 1990; Berry et al. 1991; Hubert et al. 1996). In this framework, the elevated abundance of tRNA-SeC-TCA-1 observed in sperm is most parsimoniously interpreted as supporting the known requirement for robust selenoprotein synthesis during spermatogenesis, in which selenoproteins play established roles in protecting germ cells from oxidative stress and maintaining sperm quality. Together, these data add to the growing body of evidence that sperm RNA content is highly structured and nonrandom, and they provide a reference for future studies aimed at defining the origin, regulation, and potential significance of full-length tRNAs in mature sperm.
In addition to tissue-specific tRNA abundance patterns, we identified tissue-enriched tRNA modification signatures using both LC-MS/MS and OTTR-seq mismatch profiling. LC-MS/MS data revealed that galQ modification is higher in the epididymis relative to the liver. Given that Q modification has been reported to suppress oxidative stress (Pathak et al. 2008), elevated galQ in the epididymis may reflect the heightened antioxidant requirements of this tissue during sperm maturation, although its precise function warrants further investigation. OTTR-seq further revealed that m1A58 and m1G9 levels are elevated in an isodecoder-specific manner in the testis relative to other tissues, suggesting that tissue-specific expression of tRNA-modifying enzymes contributes to a distinct modification landscape that may support the unique translational demands of spermatogenesis.
The role of diet in shaping gene expression is well established (Farris et al. 2024; Rashad and Marahleh 2025); our findings extend this observation and highlight tRNA regulation as a potentially critical mediator of tissue-specific translational-dependent and -independent adaptation to dietary inputs. The liver and heart showed the most pronounced changes in tRNA abundance in response to dietary alterations, consistent with the central metabolic roles of these organs and their heightened sensitivity to fluctuations in amino acid supply and lipid availability. Both tissues must rapidly adjust protein synthesis programs in response to changing nutrient availability, and the observed alterations in tRNA pools, including changes in specific isoacceptors that shift the overall anticodon repertoire, provide a plausible mechanism through which dietary composition could influence translational output in a codon-specific manner. Significant alterations were also detected in specific tRNAs in the caput epididymis in response to different diets, with limited effects in the testis, cauda epididymis, and sperm. The caput epididymis represents a highly specialized segment of the male reproductive tract that has a transcriptional profile that is distinct from the cauda epididymis and plays a central role in early sperm maturation (Rinaldi et al. 2020). In this context, the selective sensitivity of proximal caput epididymal tRNA profiles to dietary perturbation may reflect the unique cellular composition and metabolic responsiveness of this region (Rinaldi et al. 2020). For example, in a HF diet model, increased expression of the tRNA methyltransferase TRDMT1 was observed specifically in the caput epididymis, but not in cauda or testis, in association with diet-induced alterations in sperm sRNA profiles (Zhang et al. 2018). Similarly, sRNA changes in response to HF diet were observed in the epididymal but not testicular germ cells (Tomar et al. 2024). A more comprehensive investigation is needed to understand the biological consequences of these alterations on sperm function.
We observed that tRNA abundance was predominantly downregulated under LP conditions across tissues, whereas a HF diet led to increased levels of specific tRNAs. These opposing directional responses are consistent with the distinct nutrient-sensing pathways engaged by each dietary challenge. Under protein restriction, reduced amino acid availability likely activates nutrient-sensing pathways such as GCN2–EIF2A signaling (Dong et al. 2000; Falcón et al. 2019), leading to coordinated suppression of translational capacity, including downregulation of tRNA transcription, as an adaptive mechanism to limit ribosomal stalling and conserve resources. In contrast, HF feeding may increase metabolic and mitochondrial demands, potentially engaging mTOR signaling (Jacinto and Hall 2003; Chen et al. 2022) to promote compensatory upregulation of translational machinery, including tRNA expression, in support of protein turnover and metabolic remodeling. The comparatively muted tRNA expression responses in reproductive tissues likely reflect the stringent buffering mechanisms that protect germline stability from environmental fluctuations.
Dietary challenge also drove robust changes in tRNA modification status across tissues, adding a further layer of nutritional regulation beyond transcript abundance. LC-MS/MS analysis identified altered levels of 11 modifications in the liver in response to LP or HF diet, with a substantial subset of changes shared between the two dietary conditions. Among these, modifications such as m6t6A, i6A, and galQ are well-characterized enhancers of tRNA decoding efficiency and translational fidelity (Kimura et al. 2014; Lamichhane et al. 2016; Zhao et al. 2023), suggesting that diet-driven modification changes may tune translational output in response to shifts in nutrient availability or metabolic demand (Zaborske et al. 2014; Sharma and Rando 2017). OTTR-seq mismatch profiling provided single-nucleotide resolution of dietary effects, revealing that LP diet reduced m1A58 levels in the initiator tRNA-iMet-CAT-1 in both the heart and liver, with potential consequences for translation initiation. Concurrently, m1G9 levels were decreased in mt-tRNA-Ile-GAT and increased in mt-tRNA-Cys-GCA in response to a LP diet, indicating that mt-tRNA modifications are also subject to nutritional regulation. As m1A58 and m1G9 play established roles in tRNA structural stability (Voigts-Hoffmann 2007; Wang et al. 2008), their diet-dependent modulation may influence tRNA folding, stability, and ultimately translational fidelity. A striking finding to emerge from our analysis was that the two control diets used in this study, C (soybean oil-based, rich in polyunsaturated fats) and C_HF (lard-based, higher in saturated and monounsaturated fats), themselves produced detectable differences in tRNA modification profiles, despite both being nutritionally adequate control conditions. Critically, each dietary intervention was compared exclusively against its matched control diet throughout our analyses, ensuring that the LP versus C and HF versus C_HF comparisons are each properly controlled and internally valid and that the observed diet-induced modification changes cannot be attributed to differences between the control groups. This observation reveals that fatty acid quality, independent of overall macronutrient quantity or caloric load, is sufficient to reshape the tRNA modification landscape. Future studies using systematically varied dietary fat compositions will be well placed to dissect the specific fatty acid species and downstream signaling pathways that drive these modification changes.
As illustrated in Figure 1H, many of the tRNA modifications regulated in a tissue-specific manner or altered by LP and HF diets cluster around the anticodon loop and stem, consistent with roles in decoding efficiency and translational fidelity. Importantly, in many instances the observed changes occurred at the level of individual tRNA isodecoders without corresponding shifts in overall isoacceptor abundance, suggesting that these alterations are unlikely to broadly impact codon-dependent translation. Instead, isodecoder-specific regulation may reflect translation-independent functions of tRNAs, including roles in cellular signaling, interactions with RNA-binding proteins, and the generation of tRNA-derived fragments with regulatory activity (Torres et al. 2019; Avcilar-Kucukgoze and Kashina 2020). This isodecoder-level specificity opens the possibility that individual tRNA variants, rather than entire isoacceptor pools, serve as precise regulatory nodes linking nutritional state to gene expression programs.
Overall, our study establishes that the tRNA epitranscriptome is dynamically and precisely regulated by both tissue identity and dietary composition, across both cytosolic and mitochondrial tRNA compartments. These findings lay a foundation for future investigation into the functional consequences of diet-driven tRNA dynamics in cellular adaptation and metabolic disease.
Methods
Mouse husbandry
Wild-type FVB/NJ mice were used in the study. Male mice were used exclusively, as a primary aim of this study was to characterize the tRNA landscape of the male reproductive tract, including the testis, epididymis, and mature sperm. Whether equivalent diet-induced tRNA changes occur in female somatic tissues remains an important question for future investigation. All animal care and use procedures were approved by the University of California, Santa Cruz institutional animal care and use committee. Mice were group-housed (maximum of five per cage) with a 12 h/12 h light–dark cycle (lights off at 6 p.m.) and free access to food and water ad libitum. Animals were raised on one of three diets for Figure 1 and Supplemental Figures S1 and S2: control diet (BioServ AIN-93g F3156), a LP diet based on AIN-93g (10% of protein rather than 18%, remaining mass made up with sucrose, BioServ S3156), or HF diet (60% of fat calories rather than 16%, BioServ S3282). For the data for OTTR-seq, mice were fed on the above diets with one additional diet (7.2% fat calories, BioServ S4031) as a control diet for the HF diet. Littermates were split into the treatment diet and its corresponding control diet.
Mouse tissue collection and RNA isolation
All mouse tissue samples were isolated from wild-type FVB/NJ mice using procedures approved by the University of California, Santa Cruz institutional animal care and use committee. Samples were rapidly frozen in liquid nitrogen and stored at −80°C until use. Then, 1 mL of TRIzol (Invitrogen 15596026) was added per 100 mg of dissected whole tissue, and samples were disrupted in TRIzol buffer using a homogenizer until the suspension was completely homogeneous. We performed homogenization using the following settings: medium speed for three to five cycles (10 sec per cycle) at 4°C. Cell debris was removed by centrifugation at 12,000g for 10 min, followed by phase separation and isopropanol precipitation (as described above). RNA pellets were resuspended in nuclease-free water and stored at −80°C until use.
Sperm preparation and RNA isolation
Epididymis dissection, sperm isolation, and RNA isolation were performed following a previously described protocol (Sharma et al. 2016). Caput and cauda epididymis tissues were dissected out from an adult mouse and transferred to a 35 mm dish containing 1 mL of prewarmed Whitten's media (100 mM NaCl, 4.7 mM KCl, 1.2 mM KH2PO4, 1.2 mM MgSO4, 5.5 mM glucose, 1 mM pyruvic acid, 4.8 mM lactic acid [hemicalcium], and HEPES 20 mM). Sperm were obtained by first making two incisions at the caput or cauda and then gently squeezing the tissue to release fluid. After a 15 min incubation at 37°C, only cauda sperm–containing media were transferred to a new tube for an additional 15 min incubation. Sperm-free epididymis tissues were frozen directly in liquid nitrogen. After a 30 min incubation at 37°C, sperm were collected by centrifugation at 2000g for 2 min, washed with 1× PBS, and then washed with lysis buffer for 10 min on ice to remove somatic cell contamination. The sperm sample was finally washed with 1× PBS and pelleted after centrifugation at 2000g. The resulting sperm pellets were then subjected to RNA extraction. For sperm RNA extraction, previously flash-frozen samples were first thawed, and total volume was adjusted to 60 µL with filtered water. Then 33.3 µL of lysis buffer (6.4 M guanidine HCl, 5% Tween 20, 5% Triton, 120 mM EDTA, and 120 mM Tris at pH 8.0), 3.3 µL Proteinase K (>600 mAU/mL, Qiagen 19131), and 3.3 µL 0.1M DTT were added to the sample. The sperm pellet was disturbed physically using a pipette tip and then incubated, with shaking, for 15 min on an Eppendorf thermomixer at 60°C. One volume of water (100 µL) was then added, and the samples were subjected to phase separation using TRI reagent (Invitrogen) and 40 µL 1-bromo-2 chloropropane (BCP, Sigma-Aldrich). Samples were vortexed for 5 min to ensure complete breakdown of the sperm, followed by centrifugation at 12,000g for 4 min. The aqueous phase was then removed and transferred to a low-binding RNase/DNase-free microcentrifuge tube, followed by the addition of 20 µg of GlycoBlue (Invitrogen) and 1 volume of isopropanol. The RNA was then precipitated for ≥30 min at −20°C, followed by centrifugation at 18,000g for 30 min at 4°C and one wash with 70% cold ethanol followed by centrifugation at 12,000g for 10 min at 4°C. Finally, the RNA was reconstituted in nuclease-free water.
LC-MS/MS based RNA modification analysis
For LC-MS/MS nucleoside analysis, RNA samples were digested to nucleosides using a previously described method (Jora et al. 2018). Briefly, the RNA samples were denatured for 3 min at 95°C and immediately cooled. Samples were incubated for 2 h with nuclease P1 (0.1 U/µg RNA; Sigma-Aldrich) in 0.01 M ammonium acetate. The samples were then incubated for 2 h at 37°C with snake venom phosphodiesterase (1.2 × 10⁻⁴ U/µg RNA) and bacterial alkaline phosphatase (0.1 U/µg RNA; Worthington Biochemical corporation) in 1/10 volume of 1 M ammonium bicarbonate. A TSQ Quantiva triple quadrupole (Thermo Fisher Scientific) coupled to a Vanquish flex quaternary (Thermo Fisher Scientific) with an Acquity UPLC HSS T3, 1.8 µm, 1.0 mm × 100 mm column (Waters) at 30°C was used for analysis. The nucleosides were eluted with 5.3 mM ammonium acetate (pH = 4.5; mobile phase A) and 5.3 mM ammonium acetate (pH = 4.5) in 40% acetonitrile (mobile phase B) using a previously described LC elution method (Kelley et al. 2022). A selected reaction monitoring method was used to quantify RNA modifications in samples with predetermined SRM transitions. Analysis was done in positive polarity with an H-ESI source. The Q1 and Q3 resolution was 0.7, and a dwell time of 300 msec. For collision-induced dissociation (CID), nitrogen gas was used at 1.5 mTorr. The global parameters used were sheath gas, auxiliary gas, and sweep gas of 35, 10, and 0 arbitrary units, respectively; ion transfer tube temperature of 325°C; vaporizer temperature of 275°C; and spray voltage of 3.8 kV. Data acquisition and processing for relative quantification was done with Xcalibur 4.2 (Thermo Fisher Scientific). Modification levels were quantified by normalizing each modified base (e.g., m1G) to the level of its corresponding unmodified canonical base (e.g., G).
PNK and deacylation of RNA sample for sequencing
For PNK treatment, 1 µg of total RNA was treated with 5 U PNK (NEB M0201S) in 5× PNK buffer (350 mM Tris-HCl at pH 6.5, 50 mM MgCl2, 5 mM DTT) with 10 U RNase inhibitor (Invitrogen AM2694). The reaction was incubated for 30 min at 37°C in a thermocycler. To deactivate T4 PNK, 0.5 M EDTA was added, and the samples were incubated for 15 min at 65°C. To deacylate acylated-tRNA, 3.5 µL of 100 mM Na2B4O7·10H2O (sodium borate or sodium tetraborate, borax) was added to raise pH to ∼9 and incubated for 30 min at 45°C. Next, RNA purification was performed using phase separation followed by isopropanol precipitation, as described previously.
Ordered two-template relay sequencing
Five biological replicates per dietary group per tissue were used for OTTR-seq. OTTR was performed as previously described (Upton et al. 2021). Briefly, input RNA was labeled at the 3′ end using N-terminally truncated B. mori R2 RT (termed BoMoC) (Upton et al. 2021) by incubation in buffer containing ddATP for 90 min in 30°C, followed by an addition of ddGTP and another incubation for 30 min at 30°C. The reaction was stopped by incubating for 5 min at 65°C, followed by the addition of 5 mM MgCl2 and 0.5 units of shrimp alkaline phosphatase (NEB M0371S) for 15 min at 37°C, stopped by the addition of 5 mM EGTA, and incubated for 5 min at 65°C. Samples were then incubated in templated cDNA synthesis buffer, adaptors, and dNTPs for 20 min at 37°C, followed by heat inactivation for 5 min at 65°C and RNase A/H treatment. cDNA was size-selected on a 10% PAGE urea gel to minimize adaptor dimers. Size-selected cDNA was PCR amplified for 12 cycles with Q5 high-fidelity polymerase (NEB M0491S). The final PCR product was cleaned up with AMPure XP beads (Beckman A63881) and finally separated by 6% TBE gel to remove adaptor dimers. The desired product was excised from the gel and eluted in 400 µL elution buffer (300 mM NaCl, 10 mM Tris at pH 8, 1 mM EDTA) overnight at −20°C, followed by isopropanol precipitation and resuspension in 9 µL nuclease-free H2O.
sRNA sequencing analysis
The sRNA sequencing data were subjected to tRAX analysis pipeline. Briefly, sequencing reads were trimmed with cutadapt with adapter “‐‐no-indels -O 15 -m 2 -a GATCGGAAGAGCACACGTCT” and further trimming the final TRPT base with “cutadapt -u -1” and removal of the UMI with “cutadapt -u 7.” Sequencing analysis was done using a modified version of the tRAX analytical tool (Chan et al. 2025) with default parameters except for a minimum non-tRNA read size of 16 and using the Ensembl gene set (Martin et al. 2023), the GRCm38 (mm10) piRNA gene set from a previous study (Li et al. 2013), and ribosomal RNA repeats from UCSC RepeatMasker (Jurka 2000) as the gene set. In tRAX, reads were mapped to the mouse mm10 genome combined with tRNA sequences taken from gtRNAdb (Chan and Lowe 2016). All ribosomal repeat sequences were taken from the UCSC Genome Browser RepeatMasker track for ribosomal RNAs. To create a sequence database for mature tRNA sequences, introns were removed, CCA tails were added, and “G” base was added to the start of histidine tRNAs. tRNA reads were defined as any reads whose best mapping includes a mature tRNA sequence. The tRAX pipeline uses Bowtie 2 with the options “-k 100 ‐‐very-sensitive ‐‐ignore-quals ‐‐np 5 –very-sensitive” and from that mapping extracts all best mappings from those results with exceptions for tRNA reads. For reads that mapped best to tRNAs, the non-tRNA reads were removed to prevent reads from redundantly mapping both to the mature sequence and the genome locus. Read mappings were processed to ensure a single primary mapping for each read was marked, and only this primary mapping was used to calculate percentages of total reads for gene types and acceptor types to prevent double counting of gene types and lengths. Notably, epididymis tissues showed fewer full-length tRNA reads compared with the testis, heart, and liver. As all samples were treated the same way, the epididymis likely has a higher abundance of ribonucleases.
Normalized read counts, adjusted P-values and log2 fold change were calculated using DESeq2 (Love et al. 2014) with default parameters as a component of the tRAX pipeline. Counts for isotypes, acceptor types, and individual decoders were analyzed and normalized separately within each category in order to calculate relative change. Plots were generated with ggplot2 and Prism. Mismatch U-test P-values were calculated by using Mann–Whitney U tests to test for significance by comparing if all mismatch rates of a sample were greater than another, with 10% added to all samples to increase the stringency of the test. All mismatch tests excluded any samples with under 20 reads.
Data access
OTTR-seq raw and processed sequencing data generated in this study have been submitted to the NCBI Gene Expression Omnibus (GEO; https://www.ncbi.nlm.nih.gov/geo/) under the accession number GSE300004.
Competing interest statement
The authors declare no competing interests.
Acknowledgments
We thank Jonathan Howard and Aidan Manning for training us on DM-tRNA-Seq and OTTR-seq library preparation protocols. We thank all the members of the Sharma laboratory for their helpful discussions on this work. Schematics in Figures 1A,H and 2A were generated using BioRender (https://www.biorender.com/). This work was supported by National Institutes of Health (NIH) grant 1DP2AG066622-01 awarded to U.S. and NIH GM058843 to P.A.L.
Author contributions: Conceptualization was by S.L. and U.S. Experimental design was by S.L., T.M.L., P.A.L., and U.S. Methodology was by S.L., R.Z., and C.H. Data analysis and visualization were by S.L., R.Z., C.H., and A.D.H. Manuscript writing was by S.L. and U.S., with input from all other authors.
Footnotes
[1] Supplementary material [Supplemental material is available for this article.]
[2] Article published online before print. Article, supplemental material, and publication date are at https://www.genome.org/cgi/doi/10.1101/gr.281159.125.
[3] Freely available online through the Genome Research Open Access option.
References
- ↵Anderson P, Ivanov P. 2014. tRNA fragments in human health and disease. FEBS Lett 588: 4297–4304. 10.1016/j.febslet.2014.09.001
- ↵Anderson J, Phan L, Cuesta R, Carlson BA, Pak M, Asano K, Björk GR, Tamame M, Hinnebusch AG. 1998. The essential Gcd10p-Gcd14p nuclear complex is required for 1-methyladenosine modification and maturation of initiator methionyl-tRNA. Genes Dev 12: 3650–3662. 10.1101/gad.12.23.3650
- ↵Ando D, Rashad S, Begley TJ, Endo H, Aoki M, Dedon PC, Niizuma K. 2025. Decoding codon bias: the role of tRNA modifications in tissue-specific translation. Int J Mol Sci 26: 706. 10.3390/ijms26020706
- ↵Aravin A, Gaidatzis D, Pfeffer S, Lagos-Quintana M, Landgraf P, Iovino N, Morris P, Brownstein MJ, Kuramochi-Miyagawa S, Nakano T, 2006. A novel class of small RNAs bind to MILI protein in mouse testes. Nature 442: 203–207. 10.1038/nature04916
- ↵Avcilar-Kucukgoze I, Kashina A. 2020. Hijacking tRNAs from translation: regulatory functions of tRNAs in mammalian cell physiology. Front Mol Biosci 7: 610617. 10.3389/fmolb.2020.610617
- ↵Bao J, Li D, Wang L, Wu J, Hu Y, Wang Z, Chen Y, Cao X, Jiang C, Yan W, 2012. MicroRNA-449 and microRNA-34b/c function redundantly in murine testes by targeting E2F transcription factor-retinoblastoma protein (E2F-pRb) pathway. J Biol Chem 287: 21686–21698. 10.1074/jbc.M111.328054
- ↵Begik O, Lucas MC, Liu H, Ramirez JM, Mattick JS, Novoa EM. 2020. Integrative analyses of the RNA modification machinery reveal tissue- and cancer-specific signatures. Genome Biol 21: 97. 10.1186/s13059-020-02009-z
- ↵Behrens A, Rodschinka G, Nedialkova DD. 2021. High-resolution quantitative profiling of tRNA abundance and modification status in eukaryotes by mim-tRNAseq. Mol Cell 81: 1802–1815.e7. 10.1016/j.molcel.2021.01.028
- ↵Berry MJ, Banu L, Chen YY, Mandel SJ, Kieffer JD, Harney JW, Larsen PR. 1991. Recognition of UGA as a selenocysteine codon in type I deiodinase requires sequences in the 3′ untranslated region. Nature 353: 273–276. 10.1038/353273a0
- ↵Chan PP, Lowe TM. 2016. GtRNAdb 2.0: an expanded database of transfer RNA genes identified in complete and draft genomes. Nucleic Acids Res 44: D184–D189. 10.1093/nar/gkv1309
- ↵Chan CT, Dyavaiah M, DeMott MS, Taghizadeh K, Dedon PC, Begley TJ. 2010. A quantitative systems approach reveals dynamic control of tRNA modifications during cellular stress. PLoS Genet 6: e1001247. 10.1371/journal.pgen.1001247
- ↵Chan PP, Holmes AD, Lowe TM. 2025. Analyzing, visualizing, and annotating tRNA-derived RNAs using tRAX and tDRnamer. Methods Enzymol 711: 103–133. 10.1016/bs.mie.2024.11.016
- ↵Chen Q, Yan M, Cao Z, Li X, Zhang Y, Shi J, Feng GH, Peng H, Zhang X, Zhang Y, 2016. Sperm tsRNAs contribute to intergenerational inheritance of an acquired metabolic disorder. Science 351: 397–400. 10.1126/science.aad7977
- ↵Chen F, Yi WM, Wang SY, Yuan MH, Wen J, Li HY, Zou Q, Liu S, Cai ZY. 2022. A long-term high-fat diet influences brain damage and is linked to the activation of HIF-1alpha/AMPK/mTOR/p70S6K signalling. Front Neurosci 16: 978431. 10.3389/fnins.2022.978431
- ↵Cheng L, Zhang Y, Zhang Y, Chen T, Xu YZ, Rong YS. 2020. Loss of the RNA trimethylguanosine cap is compatible with nuclear accumulation of spliceosomal snRNAs but not pre-mRNA splicing or snRNA processing during animal development. PLoS Genet 16: e1009098. 10.1371/journal.pgen.1009098
- ↵Cozen AE, Quartley E, Holmes AD, Hrabeta-Robinson E, Phizicky EM, Lowe TM. 2015. ARM-seq: AlkB-facilitated RNA methylation sequencing reveals a complex landscape of modified tRNA fragments. Nat Methods 12: 879–884. 10.1038/nmeth.3508
- ↵Dittmar KA, Goodenbour JM, Pan T. 2006. Tissue-specific differences in human transfer RNA expression. PLoS Genet 2: e221. 10.1371/journal.pgen.0020221
- ↵Djureinovic D, Fagerberg L, Hallström B, Danielsson A, Lindskog C, Uhlén M, Pontén F. 2014. The human testis-specific proteome defined by transcriptomics and antibody-based profiling. Mol Hum Reprod 20: 476–488. 10.1093/molehr/gau018
- ↵Dong J, Qiu H, Garcia-Barrio M, Anderson J, Hinnebusch AG. 2000. Uncharged tRNA activates GCN2 by displacing the protein kinase moiety from a bipartite tRNA-binding domain. Mol Cell 6: 269–279. 10.1016/S1097-2765(00)00028-9
- ↵Dong S, Cheng Y, Yang J, Li J, Liu X, Wang X, Wang D, Krall TJ, Delphin ES, Zhang C. 2009. MicroRNA expression signature and the role of microRNA-21 in the early phase of acute myocardial infarction. J Biol Chem 284: 29514–29525. 10.1074/jbc.M109.027896
- ↵D'Souza AR, Minczuk M. 2018. Mitochondrial transcription and translation: overview. Essays Biochem 62: 309–320. 10.1042/EBC20170102
- ↵Erber L, Hoffmann A, Fallmann J, Betat H, Stadler PF, Mörl M. 2020. LOTTE-seq (Long hairpin oligonucleotide based tRNA high-throughput sequencing): specific selection of tRNAs with 3′-CCA end for high-throughput sequencing. RNA Biol 17: 23–32. 10.1080/15476286.2019.1664250
- ↵Falcón P, Escandón M, Brito A, Matus S. 2019. Nutrient sensing and redox balance: GCN2 as a new integrator in aging. Oxid Med Cell Longev 2019: 5730532. 10.1155/2019/5730532
- ↵Farris KM, Senior AM, Sobreira DR, Mitchell RM, Weber ZT, Ingerslev LR, Barrès R, Simpson SJ, Crean AJ, Nobrega MA. 2024. Dietary macronutrient composition impacts gene regulation in adipose tissue. Commun Biol 7: 194. 10.1038/s42003-024-05876-5
- ↵Forchhammer K, Leinfelder W, Böck A. 1989. Identification of a novel translation factor necessary for the incorporation of selenocysteine into protein. Nature 342: 453–456. 10.1038/342453a0
- ↵Gardiner-Garden M, Ballesteros M, Gordon M, Tam PP. 1998. Histone- and protamine-DNA association: Conservation of different patterns within the β-globin domain in human sperm. Mol Cell Biol 18: 3350–3356. 10.1128/MCB.18.6.3350
- ↵Giessing AM, Jensen SS, Rasmussen A, Hansen LH, Gondela A, Long K, Vester B, Kirpekar F. 2009. Identification of 8-methyladenosine as the modification catalyzed by the radical SAM methyltransferase Cfr that confers antibiotic resistance in bacteria. RNA 15: 327–336. 10.1261/rna.1371409
- ↵Girard A, Sachidanandam R, Hannon GJ, Carmell MA. 2006. A germline-specific class of small RNAs binds mammalian piwi proteins. Nature 442: 199–202. 10.1038/nature04917
- ↵Gogakos T, Brown M, Garzia A, Meyer C, Hafner M, Tuschl T. 2017. Characterizing expression and processing of precursor and mature human tRNAs by hydro-tRNAseq and PAR-CLIP. Cell Rep 20: 1463–1475. 10.1016/j.celrep.2017.07.029
- ↵Goodarzi H, Nguyen HC, Zhang S, Dill BD, Molina H, Tavazoie SF. 2016. Modulated expression of specific tRNAs drives gene expression and cancer progression. Cell 165: 1416–1427. 10.1016/j.cell.2016.05.046
- ↵Guo JH, Huang Q, Studholme DJ, Wu CQ, Zhao Z. 2005. Transcriptomic analyses support the similarity of gene expression between brain and testis in human as well as mouse. Cytogenet Genome Res 111: 107–109. 10.1159/000086378
- ↵Guo H, Xia L, Wang W, Xu W, Shen X, Wu X, He T, Jiang X, Xu Y, Zhao P, 2023. Hypoxia induces alterations in tRNA modifications involved in translational control. BMC Biol 21: 39. 10.1186/s12915-023-01537-x
- ↵Gur Y, Breitbart H. 2006. Mammalian sperm translate nuclear-encoded proteins by mitochondrial-type ribosomes. Genes Dev 20: 411–416. 10.1101/gad.367606
- ↵Gur Y, Breitbart H. 2008. Protein synthesis in sperm: dialog between mitochondria and cytoplasm. Mol Cell Endocrinol 282: 45–55. 10.1016/j.mce.2007.11.015
- ↵Gustafsson HT, Ferguson L, Galan C, Yu T, Upton H, Kaymak E, Weng Z, Collins K, Rando OJ. 2025. Deep sequencing of yeast and mouse tRNAs and tRNA fragments using OTTR. eLife 14: e77616. 10.7554/eLife.77616
- ↵Harris T, Marquez B, Suarez S, Schimenti J. 2007. Sperm motility defects and infertility in male mice with a mutation in Nsun7, a member of the sun domain-containing family of putative RNA methyltransferases. Biol Reprod 77: 376–382. 10.1095/biolreprod.106.058669
- ↵Hauenschild R, Tserovski L, Schmid K, Thüring K, Winz ML, Sharma S, Entian KD, Wacheul L, Lafontaine DL, Anderson J, 2015. The reverse transcription signature of N-1-methyladenosine in RNA-seq is sequence dependent. Nucleic Acids Res 43: 9950–9964. 10.1093/nar/gkv895
- ↵He Q, He X, Xiao Y, Zhao Q, Ye Z, Cui L, Chen Y, Guan MX. 2021. Tissue-specific expression atlas of murine mitochondrial tRNAs. J Biol Chem 297: 100960. 10.1016/j.jbc.2021.100960
- ↵Helm M, Giegé R, Florentz C. 1999. A Watson-Crick base-pair-disrupting methyl group (m1A9) is sufficient for cloverleaf folding of human mitochondrial tRNALys. Biochemistry 38: 13338–13346. 10.1021/bi991061g
- ↵Holmes AD, Chan PP, Chen Q, Ivanov P, Drouard L, Polacek N, Kay MA, Lowe TM. 2023. A standardized ontology for naming tRNA-derived RNAs based on molecular origin. Nat Methods 20: 627–628. 10.1038/s41592-023-01813-2
- ↵Huang HY, Hopper AK. 2016. Multiple layers of stress-induced regulation in tRNA biology. Life (Basel) 6: 16. 10.3390/life6020016
- ↵Huang J, Chen W, Zhou F, Pang Z, Wang L, Pan T, Wang X. 2021. Tissue-specific reprogramming of host tRNA transcriptome by the microbiome. Genome Res 31: 947–957. 10.1101/gr.272153.120
- ↵Huber SM, Begley U, Sarkar A, Gasperi W, Davis ET, Surampudi V, Lee M, Melendez JA, Dedon PC, Begley TJ. 2022. Arsenite toxicity is regulated by queuine availability and oxidation-induced reprogramming of the human tRNA epitranscriptome. Proc Natl Acad Sci 119: e2123529119. 10.1073/pnas.2123529119
- ↵Hubert N, Walczak R, Carbon P, Krol A. 1996. A protein binds the selenocysteine insertion element in the 3′-UTR of mammalian selenoprotein mRNAs. Nucleic Acids Res 24: 464–469. 10.1093/nar/24.3.464
- ↵Hussain S, Tuorto F, Menon S, Blanco S, Cox C, Flores JV, Watt S, Kudo NR, Lyko F, Frye M. 2013. The mouse cytosine-5 RNA methyltransferase NSun2 is a component of the chromatoid body and required for testis differentiation. Mol Cell Biol 33: 1561–1570. 10.1128/MCB.01523-12
- ↵Jacinto E, Hall MN. 2003. Tor signalling in bugs, brain and brawn. Nat Rev Mol Cell Biol 4: 117–126. 10.1038/nrm1018
- ↵James ER, Carrell DT, Aston KI, Jenkins TG, Yeste M, Salas-Huetos A. 2020. The role of the epididymis and the contribution of epididymosomes to mammalian reproduction. Int J Mol Sci 21: 5377. 10.3390/ijms21155377
- ↵Johnston DS, Jelinsky SA, Bang HJ, DiCandeloro P, Wilson E, Kopf GS, Turner TT. 2005. The mouse epididymal transcriptome: transcriptional profiling of segmental gene expression in the epididymis. Biol Reprod 73: 404–413. 10.1095/biolreprod.105.039719
- ↵Jora M, Burns AP, Ross RL, Lobue PA, Zhao R, Palumbo CM, Beal PA, Addepalli B, Limbach PA. 2018. Differentiating positional isomers of nucleoside modifications by higher-energy collisional dissociation mass spectrometry (HCD MS). J Am Soc Mass Spectrom 29: 1745–1756. 10.1007/s13361-018-1999-6
- ↵Jurka J. 2000. Repbase update: a database and an electronic journal of repetitive elements. Trends Genet 16: 418–420. 10.1016/S0168-9525(00)02093-X
- ↵Kadaba S, Krueger A, Trice T, Krecic AM, Hinnebusch AG, Anderson J. 2004. Nuclear surveillance and degradation of hypomodified initiator tRNAMet in S. cerevisiae. Genes Dev 18: 1227–1240. 10.1101/gad.1183804
- ↵Kaur P, Bansal MP. 2005. Effect of selenium-induced oxidative stress on the cell kinetics in testis and reproductive ability of male mice. Nutrition 21: 351–357. 10.1016/j.nut.2004.05.028
- ↵Kelley M, Uhran M, Herbert C, Yoshida G, Watts ER, Limbach PA, Benoit JB. 2022. Abundances of transfer RNA modifications and transcriptional levels of tRNA-modifying enzymes are sex-associated in mosquitoes. Insect Biochem Mol Biol 143: 103741. 10.1016/j.ibmb.2022.103741
- ↵Kimura S, Miyauchi K, Ikeuchi Y, Thiaville PC, Crécy-Lagard V, Suzuki T. 2014. Discovery of the beta-barrel-type RNA methyltransferase responsible for N6-methylation of N6-threonylcarbamoyladenosine in tRNAs. Nucleic Acids Res 42: 9350–9365. 10.1093/nar/gku618
- ↵Kirino Y, Mourelatos Z. 2007. Mouse Piwi-interacting RNAs are 2′-O-methylated at their 3′ termini. Nat Struct Mol Biol 14: 347–348. 10.1038/nsmb1218
- ↵Kuksa PP, Leung YY, Vandivier LE, Anderson Z, Gregory BD, Wang LS. 2017. In silico identification of RNA modifications from high-throughput sequencing data using HAMR. Methods Mol Biol 1562: 211–229. 10.1007/978-1-4939-6807-7_14
- ↵Lamichhane TN, Arimbasseri AG, Rijal K, Iben JR, Wei FY, Tomizawa K, Maraia RJ. 2016. Lack of tRNA-i6A modification causes mitochondrial-like metabolic deficiency in S. pombe by limiting activity of cytosolic tRNATyr, not mito-tRNA. RNA 22: 583–596. 10.1261/rna.054064.115
- ↵Laxman S, Sutter BM, Wu X, Kumar S, Guo X, Trudgian DC, Mirzaei H, Tu BP. 2013. Sulfur amino acids regulate translational capacity and metabolic homeostasis through modulation of tRNA thiolation. Cell 154: 416–429. 10.1016/j.cell.2013.06.043
- ↵Li XZ, Roy CK, Dong X, Bolcun-Filas E, Wang J, Han BW, Xu J, Moore MJ, Schimenti JC, Weng Z, 2013. An ancient transcription factor initiates the burst of piRNA production during early meiosis in mouse testes. Mol Cell 50: 67–81. 10.1016/j.molcel.2013.02.016
- ↵Liu F, Clark W, Luo G, Wang X, Fu Y, Wei J, Wang X, Hao Z, Dai Q, Zheng G, 2016. ALKBH1-mediated tRNA demethylation regulates translation. Cell 167: 816–828.e16. 10.1016/j.cell.2016.09.038
- ↵Love MI, Huber W, Anders S. 2014. Moderated estimation of fold change and dispersion for RNA-seq data with DESeq2. Genome Biol 15: 550. 10.1186/s13059-014-0550-8
- ↵Lucas MC, Pryszcz LP, Medina R, Milenkovic I, Camacho N, Marchand V, Motorin Y, Ribas de Pouplana L, Novoa EM. 2024. Quantitative analysis of tRNA abundance and modifications by nanopore RNA sequencing. Nat Biotechnol 42: 72–86. 10.1038/s41587-023-01743-6
- ↵Magee R, Rigoutsos I. 2020. On the expanding roles of tRNA fragments in modulating cell behavior. Nucleic Acids Res 48: 9433–9448. 10.1093/nar/gkaa657
- ↵Martin FJ, Amode MR, Aneja A, Austine-Orimoloye O, Azov AG, Barnes I, Becker A, Bennett R, Berry A, Bhai J, 2023. Ensembl 2023. Nucleic Acids Res 51: D933–D941. 10.1093/nar/gkac958
- ↵Mathlin J, Le Pera L, Colombo T. 2020. A census and categorization method of epitranscriptomic marks. Int J Mol Sci 21: 4684. 10.3390/ijms21134684
- ↵Matos B, Publicover SJ, Castro LFC, Esteves PJ, Fardilha M. 2021. Brain and testis: more alike than previously thought? Open Biol 11: 200322. 10.1098/rsob.200322
- ↵Ommati MM, Jamshidzadeh A, Heidari R, Sun Z, Zamiri MJ, Khodaei F, Mousapour S, Ahmadi F, Javanmard N, Shirazi Yeganeh B. 2019. Carnosine and histidine supplementation blunt lead-induced reproductive toxicity through antioxidative and mitochondria-dependent mechanisms. Biol Trace Elem Res 187: 151–162. 10.1007/s12011-018-1358-2
- ↵Ostermeier GC, Dix DJ, Miller D, Khatri P, Krawetz SA. 2002. Spermatozoal RNA profiles of normal fertile men. Lancet 360: 772–777. 10.1016/S0140-6736(02)09899-9
- ↵Ostermeier GC, Miller D, Huntriss JD, Diamond MP, Krawetz SA. 2004. Reproductive biology: delivering spermatozoan RNA to the oocyte. Nature 429: 154. 10.1038/429154a
- ↵Padhiar NH, Katneni U, Komar AA, Motorin Y, Kimchi-Sarfaty C. 2024. Advances in methods for tRNA sequencing and quantification. Trends Genet 40: 276–290. 10.1016/j.tig.2023.11.001
- ↵Pang YL, Abo R, Levine SS, Dedon PC. 2014. Diverse cell stresses induce unique patterns of tRNA up- and down-regulation: tRNA-seq for quantifying changes in tRNA copy number. Nucleic Acids Res 42: e170. 10.1093/nar/gku945
- ↵Pathak C, Jaiswal YK, Vinayak M. 2008. Queuine promotes antioxidant defence system by activating cellular antioxidant enzyme activities in cancer. Biosci Rep 28: 73–81. 10.1042/BSR20070011
- ↵Peng H, Shi J, Zhang Y, Zhang H, Liao S, Li W, Lei L, Han C, Ning L, Cao Y, 2012. A novel class of tRNA-derived small RNAs extremely enriched in mature mouse sperm. Cell Res 22: 1609–1612. 10.1038/cr.2012.141
- ↵Pinkard O, McFarland S, Sweet T, Coller J. 2020. Quantitative tRNA-sequencing uncovers metazoan tissue-specific tRNA regulation. Nat Commun 11: 4104. 10.1038/s41467-020-17879-x
- ↵Qazi IH, Angel C, Yang H, Zoidis E, Pan B, Wu Z, Ming Z, Zeng CJ, Meng Q, Han H 2019. Role of selenium and selenoproteins in male reproductive function: a review of past and present evidences. Antioxidants 8: 268. 10.3390/antiox8080268
- ↵Rashad S, Marahleh A. 2025. Metabolism meets translation: dietary and metabolic influences on tRNA modifications and codon biased translation. Wiley Interdiscip Rev RNA 16: e70011. 10.1002/wrna.70011
- ↵Raut A, Khanna A. 2016. Enhanced expression of hepatocyte-specific microRNAs in valproic acid mediated hepatic trans-differentiation of human umbilical cord derived mesenchymal stem cells. Exp Cell Res 343: 237–247. 10.1016/j.yexcr.2016.03.015
- ↵Rinaldi VD, Donnard E, Gellatly K, Rasmussen M, Kucukural A, Yukselen O, Garber M, Sharma U, Rando OJ. 2020. An atlas of cell types in the mouse epididymis and vas deferens. eLife 9: e55474. 10.7554/eLife.55474
- ↵Scacchetti A, Shields EJ, Trigg NA, Lee GS, Wilusz JE, Conine CC, Bonasio R. 2024. A ligation-independent sequencing method reveals tRNA-derived RNAs with blocked 3′ termini. Mol Cell 84: 3843–3859.e8. 10.1016/j.molcel.2024.07.008
- ↵Scheepbouwer C, Aparicio-Puerta E, Gomez-Martin C, Verschueren H, van Eijndhoven M, Wedekind LE, Giannoukakos S, Hijmering N, Gasparotto L, van der Galien HT, 2023. ALL-tRNAseq enables robust tRNA profiling in tissue samples. Genes Dev 37: 243–257. 10.1101/gad.350233.122
- ↵Schwartz MH, Wang H, Pan JN, Clark WC, Cui S, Eckwahl MJ, Pan DW, Parisien M, Owens SM, Cheng BL, 2018. Microbiome characterization by high-throughput transfer RNA sequencing and modification analysis. Nat Commun 9: 5353. 10.1038/s41467-018-07675-z
- ↵Sharma U, Rando OJ. 2017. Metabolic inputs into the epigenome. Cell Metab 25: 544–558. 10.1016/j.cmet.2017.02.003
- ↵Sharma U, Conine CC, Shea JM, Boskovic A, Derr AG, Bing XY, Belleannee C, Kucukural A, Serra RW, Sun F, 2016. Biogenesis and function of tRNA fragments during sperm maturation and fertilization in mammals. Science 351: 391–396. 10.1126/science.aad6780
- ↵Sharma U, Sun F, Conine CC, Reichholf B, Kukreja S, Herzog VA, Ameres SL, Rando OJ. 2018. Small RNAs are trafficked from the epididymis to developing mammalian sperm. Dev Cell 46: 481–494.e6. 10.1016/j.devcel.2018.06.023
- ↵Shi J, Zhang Y, Tan D, Zhang X, Yan M, Zhang Y, Franklin R, Shahbazi M, Mackinlay K, Liu S, 2021. PANDORA-seq expands the repertoire of regulatory small RNAs by overcoming RNA modifications. Nat Cell Biol 23: 424–436. 10.1038/s41556-021-00652-7
- ↵Shigematsu M, Honda S, Loher P, Telonis AG, Rigoutsos I, Kirino Y. 2017. YAMAT-seq: an efficient method for high-throughput sequencing of mature transfer RNAs. Nucleic Acids Res 45: e70. 10.1093/nar/gkx005
- ↵Soumillon M, Necsulea A, Weier M, Brawand D, Zhang X, Gu H, Barthès P, Kokkinaki M, Nef S, Gnirke A, 2013. Cellular source and mechanisms of high transcriptome complexity in the mammalian testis. Cell Rep 3: 2179–2190. 10.1016/j.celrep.2013.05.031
- ↵Sun YH, Wang A, Song C, Shankar G, Srivastava RK, Au KF, Li XZ. 2021. Single-molecule long-read sequencing reveals a conserved intact long RNA profile in sperm. Nat Commun 12: 1361. 10.1038/s41467-021-21524-6
- ↵Suzuki T. 2021. The expanding world of tRNA modifications and their disease relevance. Nat Rev Mol Cell Biol 22: 375–392. 10.1038/s41580-021-00342-0
- ↵Suzuki T, Yashiro Y, Kikuchi I, Ishigami Y, Saito H, Matsuzawa I, Okada S, Mito M, Iwasaki S, Ma D, 2020. Complete chemical structures of human mitochondrial tRNAs. Nat Commun 11: 4269. 10.1038/s41467-020-18068-6
- ↵Thüring K, Schmid K, Keller P, Helm M. 2016. Analysis of RNA modifications by liquid chromatography-tandem mass spectrometry. Methods 107: 48–56. 10.1016/j.ymeth.2016.03.019
- ↵Tomar A, Gomez-Velazquez M, Gerlini R, Comas-Armangué G, Makharadze L, Kolbe T, Boersma A, Dahlhoff M, Burgstaller JP, Lassi M, 2024. Epigenetic inheritance of diet-induced and sperm-borne mitochondrial RNAs. Nature 630: 720–727. 10.1038/s41586-024-07472-3
- ↵Torres AG, Reina O, Stephan-Otto Attolini C, Ribas de Pouplana L. 2019. Differential expression of human tRNA genes drives the abundance of tRNA-derived fragments. Proc Natl Acad Sci 116: 8451–8456. 10.1073/pnas.1821120116
- ↵Upton HE, Ferguson L, Temoche-Diaz MM, Liu XM, Pimentel SC, Ingolia NT, Schekman R, Collins K. 2021. Low-bias ncRNA libraries using ordered two-template relay: serial template jumping by a modified retroelement reverse transcriptase. Proc Natl Acad Sci 118: e2107900118. 10.1073/pnas.2107900118
- ↵Valesyan S, Jora M, Addepalli B, Limbach PA. 2024. Stress-induced modification of Escherichia coli tRNA generates 5-methylcytidine in the variable loop. Proc Natl Acad Sci 121: e2317857121. 10.1073/pnas.2317857121
- ↵Voigts-Hoffmann F, Hengesbach M, Kobitski AY, van Aerschot A, Herdewijn P, Nienhaus GU, Helm M. 2007. A methyl group controls conformational equilibrium in human mitochondrial tRNALys. J Am Chem Soc 129: 13382–13383. 10.1021/ja075520+
- ↵Wang X, Jia H, Jankowsky E, Anderson JT. 2008. Degradation of hypomodified tRNAiMet in vivo involves RNA-dependent ATPase activity of the DExH helicase Mtr4p. RNA 14: 107–116. 10.1261/rna.808608
- ↵Wang Z, Xie Y, Wang Y, Morris D, Wang S, Oliver D, Yuan S, Zayac K, Bloomquist S, Zheng H, 2020. X-linked miR-506 family miRNAs promote FMRP expression in mouse spermatogonia. EMBO Rep 21: e49024. 10.15252/embr.201949024
- ↵Watanabe T, Endo A. 1991. Effects of selenium deficiency on sperm morphology and spermatocyte chromosomes in mice. Mutat Res 262: 93–99. 10.1016/0165-7992(91)90113-I
- ↵Wetzel C, Limbach PA. 2016. Mass spectrometry of modified RNAs: recent developments. Analyst 141: 16–23. 10.1039/C5AN01797A
- ↵Wykes SM, Krawetz SA. 2003. The structural organization of sperm chromatin. J Biol Chem 278: 29471–29477. 10.1074/jbc.M304545200
- ↵Yanai I, Benjamin H, Shmoish M, Chalifa-Caspi V, Shklar M, Ophir R, Bar-Even A, Horn-Saban S, Safran M, Domany E, 2005. Genome-wide midrange transcription profiles reveal expression level relationships in human tissue specification. Bioinformatics 21: 650–659. 10.1093/bioinformatics/bti042
- ↵Yu P, Zhou S, Gao Y, Liang Y, Guo W, Wang DO, Ding S, Lin S, Wang J, Cun Y. 2023. Dynamic landscapes of tRNA transcriptomes and translatomes in diverse mouse tissues. Genomics Proteomics Bioinformatics 21: 834–849. 10.1016/j.gpb.2022.07.006
- ↵Zaborske JM, Narasimhan J, Jiang L, Wek SA, Dittmar KA, Freimoser F, Pan T, Wek RC. 2009. Genome-wide analysis of tRNA charging and activation of the eIF2 kinase Gcn2p. J Biol Chem 284: 25254–25267. 10.1074/jbc.M109.000877
- ↵Zaborske JM, DuMont VL, Wallace EW, Pan T, Aquadro CF, Drummond DA. 2014. A nutrient-driven tRNA modification alters translational fidelity and genome-wide protein coding across an animal genus. PLoS Biol 12: e1002015. 10.1371/journal.pbio.1002015
- ↵Zhang Y, Zhang X, Shi J, Tuorto F, Li X, Liu Y, Liebers R, Zhang L, Qu Y, Qian J, 2018. Dnmt2 mediates intergenerational transmission of paternally acquired metabolic disorders through sperm small non-coding RNAs. Nat Cell Biol 20: 535–540. 10.1038/s41556-018-0087-2
- ↵Zhang W, Xu R, Matuszek Z, Cai Z, Pan T. 2020. Detection and quantification of glycosylated queuosine modified tRNAs by acid denaturing and APB gels. RNA 26: 1291–1298. 10.1261/rna.075556.120
- ↵Zhang W, Foo M, Eren AM, Pan T. 2022. tRNA modification dynamics from individual organisms to metaepitranscriptomics of microbiomes. Mol Cell 82: 891–906. 10.1016/j.molcel.2021.12.007
- ↵Zhao X, Ma D, Ishiguro K, Saito H, Akichika S, Matsuzawa I, Mito M, Irie T, Ishibashi K, Wakabayashi K, 2023. Glycosylated queuosines in tRNAs optimize translational rate and post-embryonic growth. Cell 186: 5517–5535.e24. 10.1016/j.cell.2023.10.026
- ↵Zheng G, Qin Y, Clark WC, Dai Q, Yi C, He C, Lambowitz AM, Pan T. 2015. Efficient and quantitative high-throughput tRNA sequencing. Nat Methods 12: 835–837. 10.1038/nmeth.3478
- ↵Zinoni F, Heider J, Böck A. 1990. Features of the formate dehydrogenase mRNA necessary for decoding of the UGA codon as selenocysteine. Proc Natl Acad Sci 87: 4660–4664. 10.1073/pnas.87.12.4660