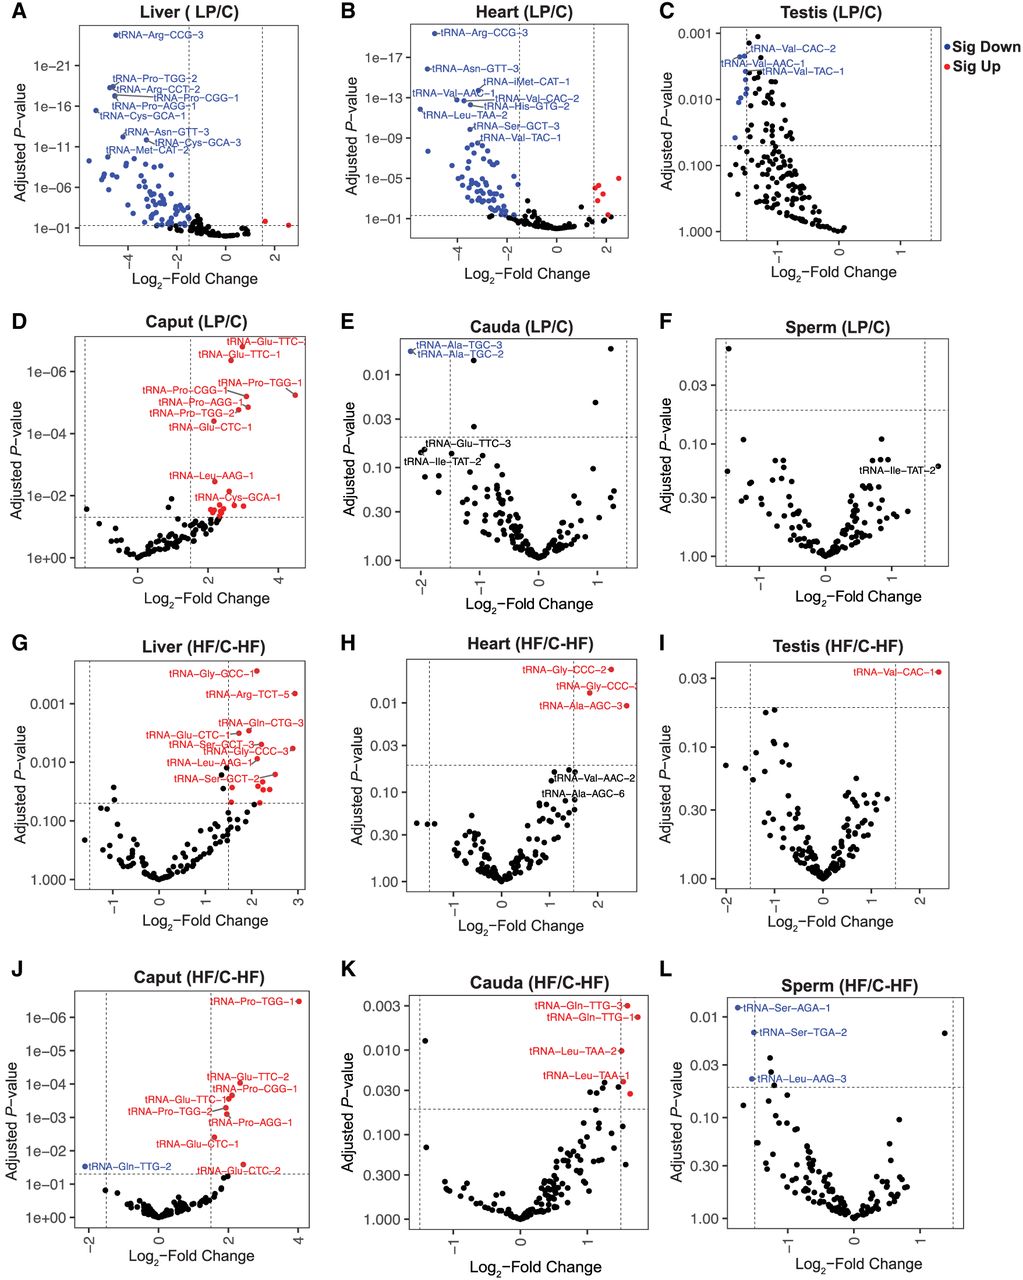
Figure 5.
Dietary alterations influence tRNA abundance. (A–F) Volcano plots showing significantly altered tRNAs in low-protein diet (LP) condition relative to the control diet (C). (G–L) Volcano plots showing significantly altered tRNAs in high-fat diet (HF) condition relative to control for high-fat diet (C-HF). Differentially expressed tRNAs are highlighted in red (upregulated) and blue (downregulated), with the top 10 differentially expressed tRNAs labeled. The significant changes were determined using DESeq2 analysis with a cutoff of a log2 fold change of >1.5 and adjusted P-values < 0.05.