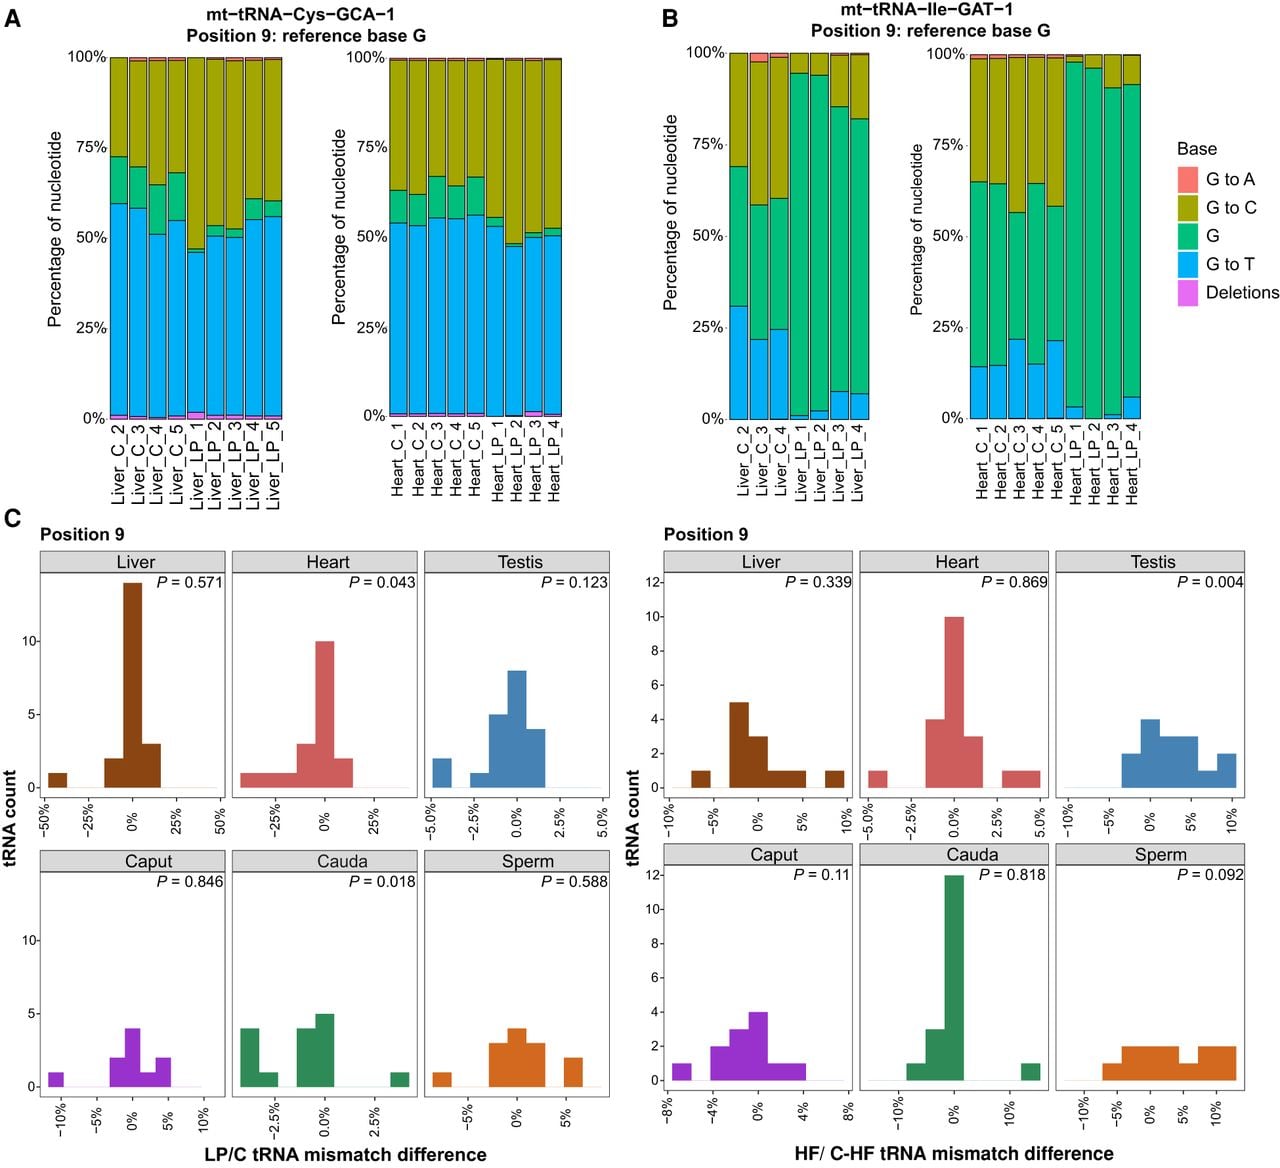
Dietary challenges modulate mt-tRNA modifications. (A,B) The mismatch incorporation rates (y-axis) for position 9 for mt-tRNA-Cys-GCA (A) and mt-tRNA-Ile-GAT (B), comparing C and LP diet conditions in heart and liver tissues. Heart_LP_5 sample is omitted from the plots because it had fewer than 20 reads covering position 9. Similarly, because of insufficient read coverage at position 9 for the mt-tRNA, Liver_C_1 is excluded from both plots for mt-tRNA-Cys-GCA and mt-tRNA-Ile-GAT, and Liver_LP5 is excluded from the mt-tRNA-Ile-GAT plot. In all cases, at least three replicates are analyzed. (C) Histograms show number of mt-tRNAs and the difference in median mismatch rates at position 9 in LP tissues relative to C tissues and HF tissues relative to C_HF tissues. A Wilcoxon signed-rank test comparing median mismatch rates across tRNAs between dietary conditions and matched controls was performed to identify significant changes (P < 0.05).