Abstract
We have developed a generalization of Kimura’s Markov chain model for base substitution at a single nucleotide site. This generalized model incorporates more flexible transition rates and consequently allows irreversible as well as reversible chains. Because the model embodies just the right amount of symmetry, it permits explicit calculation of finite-time transition probabilities and equilibrium distributions. The model also meshes well with maximum likelihood methods for phylogenetic analysis. Quick calculation of likelihoods and their derivatives can be carried out by adapting Baum’s forward and backward algorithms from the theory of hidden Markov chains. Analysis of HIV sequence data illustrates the speed of the algorithms on trees with many contemporary taxa. Analysis of some of Lake’s data on the origin of the eukaryotic nucleus contrasts the reversible and irreversible versions of the model.
The object of phylogenetic analysis is to infer the correct evolutionary relationships among three or more contemporary species from amino acid or nucleotide sequence data on a representative member of each species. As more nucleotide sequence data accumulate from a multitude of contemporary species and as computers become ever faster, phylogenetic methods should evolve accordingly. In our opinion, properly implemented maximum likelihood methods are the best vehicles for statistical inference. First, maximum likelihood methods use all of the available data. Second, they can incorporate realistic evolutionary models. (They can also incorporate naive models.) Third, they permit estimation of parameters and their associated standard errors. Fourth, and finally, they allow comparison of different evolutionary trees through their maximum likelihood statistics. Competing methods of analysis, such as maximum parsimony, involve much less computation but neglect relevant portions of the data. They also ordinarily do not yield reliable parameter estimates.
In this paper we present a generalization of Kimura’s model for base substitution at a single nucleotide site. Our generalization strikes a good compromise between parameter richness and analytic tractability. By including just enough symmetry, we can extend Kimura’s arguments for deducing finite-time transition probabilities from his two-parameter model to our eight-parameter model. We also describe an algorithm that simultaneously calculates the likelihood and its derivatives quickly. These calculations can be implemented on a parallel computer for extremely fast analysis of many evolutionary trees. We demonstrate the feasibility of the model and the new likelihood algorithms by analyzing HIV sequence data and RNA sequence data bearing on the origin of the eukaryotic nucleus.
The model adopted in this paper specifies the expected branch length separating a mother and a daughter node of an evolutionary tree as the average number of substitutions per nucleotide position (site) between the nodes. This expectation is a function of the conditional probability pij (t) = Pr (Zt = j|Z 0 = i) that the daughter node occupies state j at time tgiven that the mother node occupies state i at time 0. Herei and j are any of the four possible nucleotides, namely, the purines A (adenine) and G (guanine) and the pyrimidines C (cytosine) and T (thymine). The probabilities pij (t) are entries of the finite-time transition matrix P(t) characterizing the Markov chain Zt of successive nucleotides occurring along the branch at the given site. Under the Markov chain model, the probability of the observed nucleotides at the site depends on (1) the rooted tree connecting the contemporary taxa, (2) the distribution of nucleotides at the root, and (3) the matrix functionP(t). Phylogenetic reconstruction using maximum likelihood (Felsenstein 1981) attempts to infer the correct tree by maximizing the likelihood of the observed data with respect to entries of the various matrices P(t) or parameters determining these entries. The tree yielding the largest maximum likelihood is declared to be the best tree.
For the purposes of this paper, we make the simplifying assumption that the nucleotide patterns at different sites are independently and identically distributed. Many models for the 4 × 4 matrixP(t) have been proposed. Barry and Hartigan (1987)place no restrictions on P(t). Because all row sums of P(t) equal 1, this entails 12 parameters per branch. In practice, this many parameters can not be reliably estimated, even though, in some cases, the tree topology and branch lengths can be. Beginning with Kimura (1980) and Felsenstein (1981), various researchers have constructed models that capture the changes occurring at each site as a continuous-time Markov chain involving the four states A, G, C, and T. These time-homogeneous models are nicely summarized by Yang (1994). If in this contextω ij is the infinitesimal transition rate of moving from state i to state j ≄′i and if ω ii = −Σ j ≄′ i ω ij , thenP(t) can be expressed as the matrix exponential
In practice, numerical evaluation of matrix exponential 1 is a major computational bottleneck hindering maximum likelihood estimation (Yang 1994). Thus, models such as Kimura’s (1980) that yield analytic expressions for the entries of P(t) are extremely valuable. Kimura’s highly symmetric two-parameter model incorporates a common infinitesimal rate α for all evolutionary transitions (purine to purine or pyrimidine to pyrimidine) and a common infinitesimal rate λ for all evolutionary transversions (purine to pyrimidine or pyrimidine to purine). the underlying Markov chain along any branch is reverisble.
The Generalized Kimura Model
The infinitesimal generator under our generalization of Kimura’s model is
Kimura’s two-parameter model is a special case of the model determined by Equation { label needed for disp-formula[@id='E2'] }. In view of Kolmogorov’s circulation criterion (Kelly 1979), it is easy to verify that Λ in Equation { label needed for disp-formula[@id='E2'] } leads to a reversible Markov chain if and only if
Other special cases of the infinitesimal generator Λ appear in the dnaml program of Felsenstein’s computer package PHYLIP (Kishino and Hasegawa 1989; Felsenstein and Churchill 1996) and in the nucml program of the MOLPHY package (Hasegawa et al. 1985; Adachi et al. 1996). PHYLIP depends on two parameters k and u and the root probabilities (π A , π G , π C , π T ). These five independent parameters define the entries of Λ as follows:
If branch lengths are unconstrained and equilibrium has been reached, then phylogenies with underlying reversible Markov chains can not be rooted (Felsenstein 1981). This pulley principle of Felsenstein fails if any of the three necessary conditions mentioned are violated. Thus, in principle, methods based on the irreversible matrix Λ can single out a best rooted tree when sufficient data are available. We will comment further on this point in our application to Lake’s data.
In calculating the finite-time transition matrix P(t) for the infinitesimal generator Λ, we pattern our arguments afterKimura (1980), who exploits symmetry and derives two coupled linear differential equations for the entries of P(t). In our calculations, it is convenient to let Y denote either pyrimidine and R either purine. We defineqAY (t) to be the probability the chain is in either of the two pyrimidines C or T at timet given it starts in A at time 0. We likewise defineqYA (t) to be the probability the chain is in A at time t given it starts in either pyrimidine at time 0 and qYY (t) to be the probability the chain is in either pyrimidine at time t given it started in either pyrimidine at time 0. These probabilities all make sense owing to the symmetry assumptions incorporated in Λ. Similar probabilities can be defined for the purines instead of the pyrimidines.
The probability qAY (t + h) satisfies the Chapman–Kolmogorov relation
In summary, we have calculated the entriespAG (t) andpAA (t) and the sumpAY (t) =pAC (t) +pAT (t) from the top row [pAA (t),pAG (t),pAC (t),pAT (t)] of P(t). To fill out the top row, we briefly indicate how to calculate similar expressions for qRR (t) andqRC(t) =pAC (t), where R stands for either purine. The forward differential equations forqRR (t) and forqRC (t) turn out to be
This completes the top row of P(t).
The remaining rows of P(t) can be similarly calculated and are provided in the . In the limit ast → ∞, the top row of P(t), along with all other rows, tends to the equilibrium distribution π with components
Likelihood Computation
Maximum likelihood methods are notoriously slow compared to competing methods such as maximum parsimony (Yang 1994). However, every advance in computing speed makes maximum likelihood methods more attractive and the excuses for preferring other methods less compelling. Of course, fast hardware is only one of the reasons for the improved position of maximum likelihood. Better algorithms also play a role. In this section we sketch an algorithm for the fast computation of the derivatives of the likelihood of an evolutionary tree. This algorithm extends the peeling method already in place for likelihood computation (Felsenstein 1981; Waterman 1996) and builds on an extension (Lange et al. 1995) of Baum’s algorithms from the theory of hidden Markov chains (Baum 1972; Devijver 1985). While derivative-free methods of optimization are viable, quick optimization almost always depends on the use of derivatives, computed either exactly or numerically. The decisive advantage of derivative based methods is already clear in timed comparisons of dnaml with its sister program fastDNAml (Olsen 1994); dnaml employs a derivative-free method and fastDNAml Newton’s method.
Before introducing the peeling algorithm and describing how to modify it to compute derivatives, it is helpful to introduce several definitions. Imagine an evolutionary tree drawn with its root at the top and its tips at the bottom. Every internal node n of the tree, including the root, generates three subtrees rooted atn. One of these is simply the subtree descending fromn and ultimately reaching a subset of descendant tips. This subtree can be divided into a left subtree and a right subtree by taking either the left or right branch descending from n.There is also a complementary subtree starting at the original root and containing all of the branches not included in the subtree rooted atn. Figure 1 illustrates the four subtrees at node 5 of a four-taxon tree. Subfigure a is the whole tree, c is the subtree rooted at 5, d is the left subtree, e is the right subtree, and b is the complementary subtree.
A four-taxon tree with subtrees at node 5.
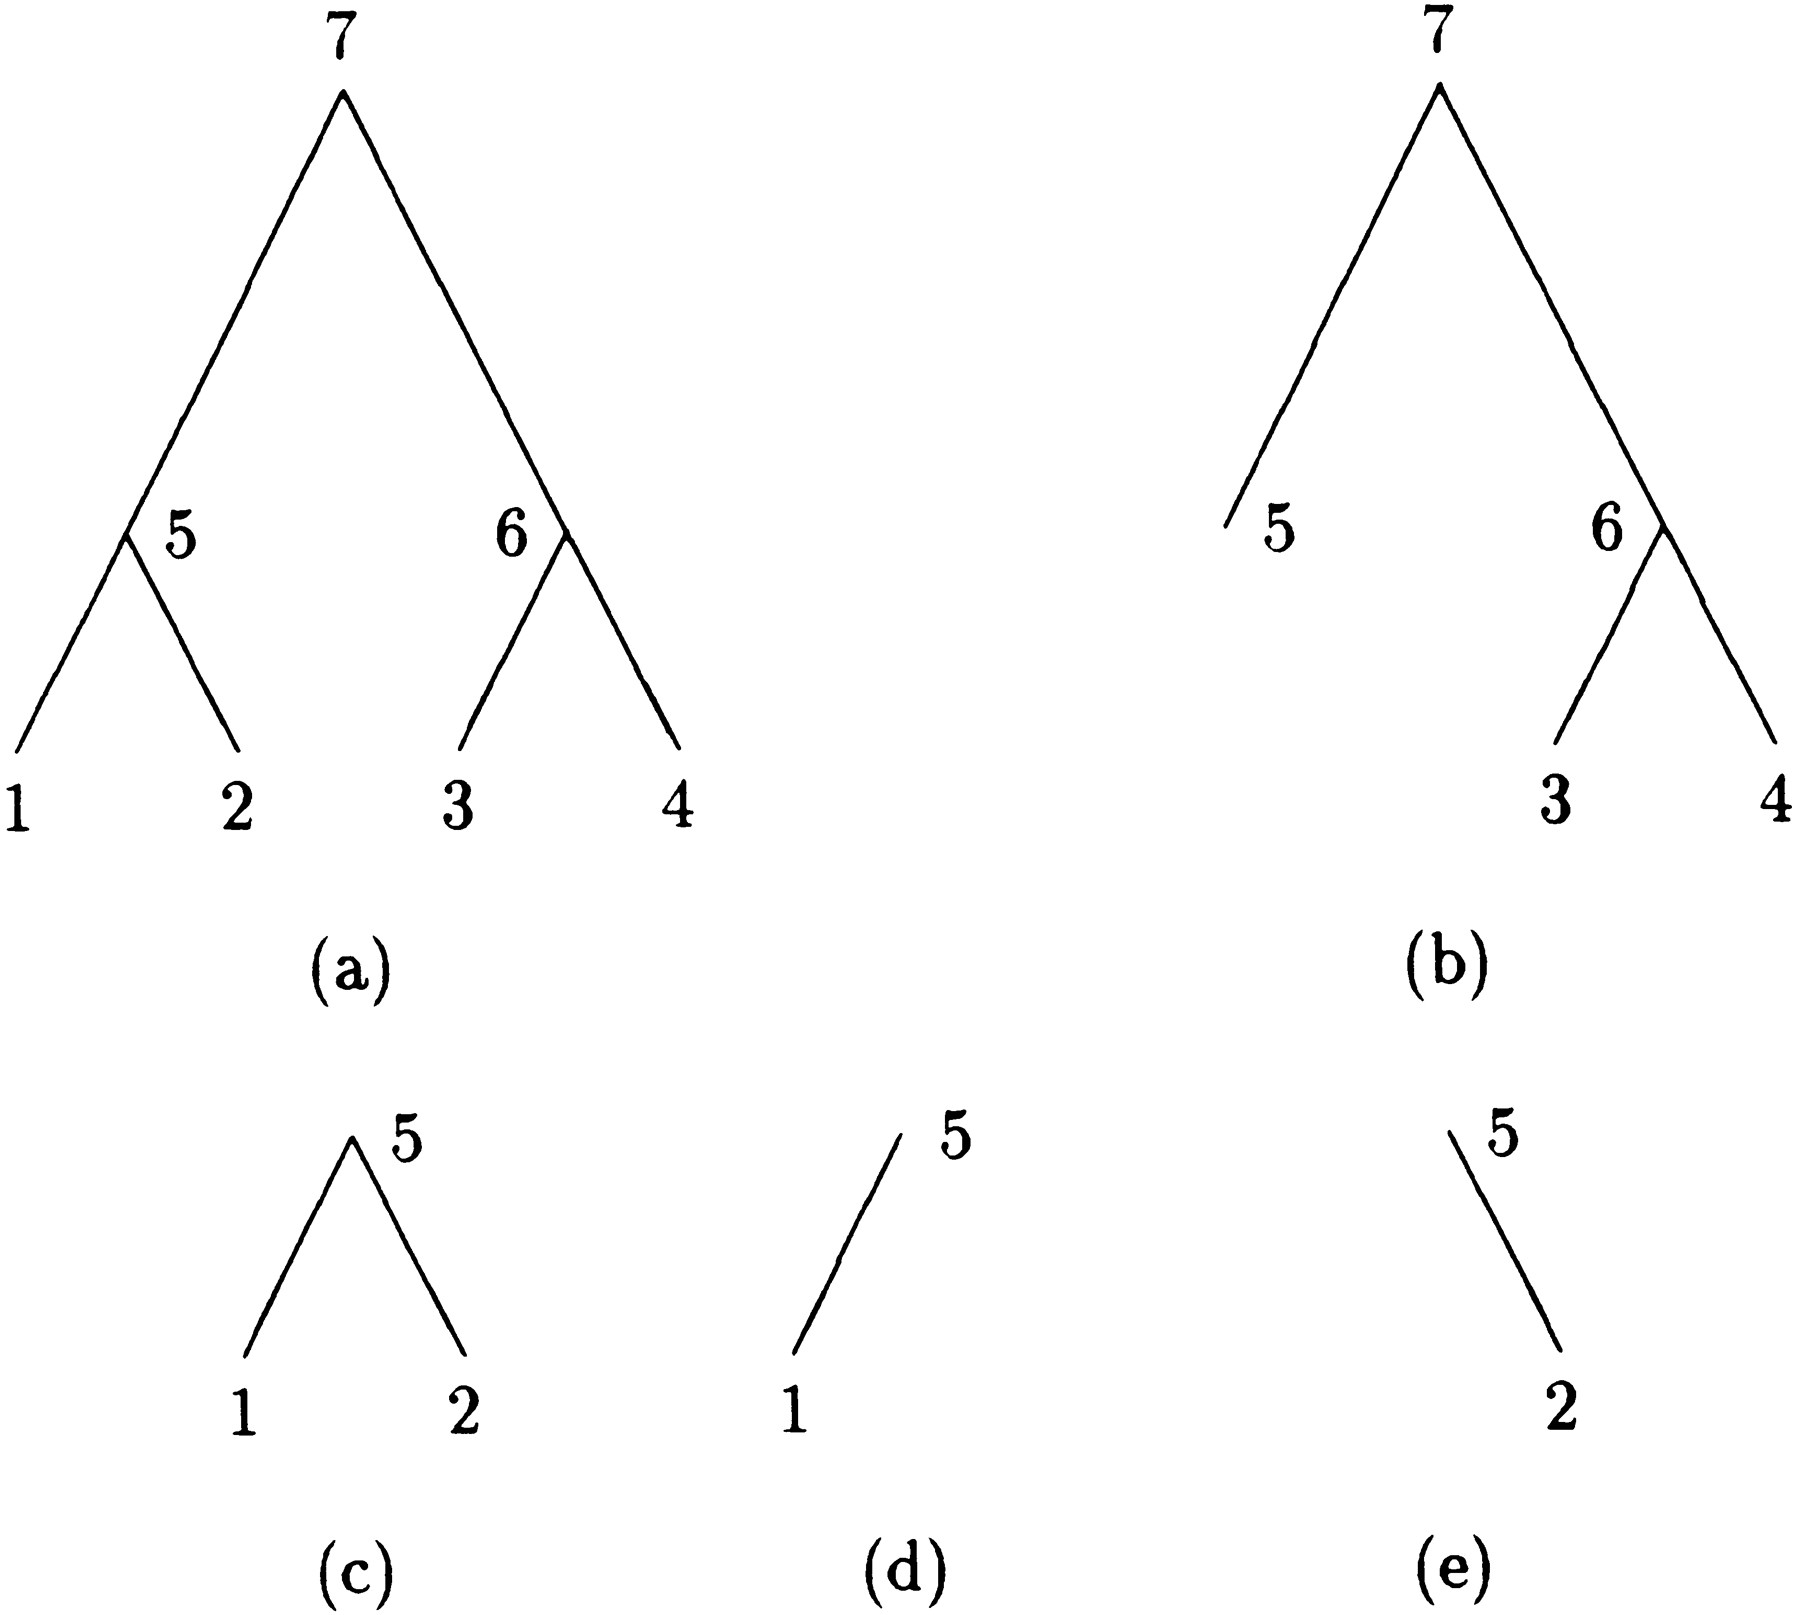
In the peeling algorithm, several probabilities enter into the calculation of the likelihood P of the tree at a single site. These are (1) the conditional probabilityT m → n (i,j) that the daughter node n of a branch m → nis in state j given that the mother node m is in state i; (2) the conditional probabilityDn (i) of the subtree rooted at noden given node n is in state i; (3) the conditional probability Ln (i) of the left subtree rooted at node n given node n is in statei; (4) the conditional probabilityRn (i) of the right subtree rooted at noden given node n is in state i; and (5) the joint probability Un (i) of node nbeing in state i and the complementary subtree showing its observed bases at its tips. In definition 1, note thatTm → n (i,j) is nothing more than an entry of the finite-time transition matrixP(t) pertaining to the branchm → n. The letters D and U inDn (i) and Un (i) of definitions (2) and (5) are chosen to indicate downward and upward directions in the tree.
In the modified peeling algorithm, we make two passes through the tree. In the first pass, we traverse the tree in a postorder (upward) fashion and compute and store the conditional probabilities [Ln (i), Rn (i),Dn (i)] as we visit interior noden. When we visit the root node at the end of the first pass, we recover the likelihood P of the tree. In the second pass, we traverse the tree in a preorder (downward) fashion and compute the derivatives of the likelihood with respect to each of the model parameters using the stored quantities [Ln (i), Rn (i),Dn (i)] as we visit node n.
More specifically in the postorder phase of the algorithm, we employ the recurrence relations
In the preorder phase of the algorithm, we exploit the product rule of differentiation. Any given model parameter θ may impinge on the root distribution π i and one or more of the branch transition probabilities Tm → n (i,j). The product rule implies that the partial derivative of P with respect to θ decomposes as
Readers can rightfully object that the recipes for computing (∂/∂θ)P m → n invoke the undefined vectors Um (i) and, whenn is a tip, Dn (j). The second vector, Dn (j), can be defined asDn (j) = 1{j=s n }, wheresn is the base at the tip. Specification ofUm (i) is more problematic. By definition Uroot (i) = π i . In general, if m → nis a left branch, then
As an example of the two-pass algorithm, consider the four-taxon tree shown in Figure 1a. Pass one and two consist of the steps listed in Tables 1 and 2. The partial derivatives (∂/∂θ)π i and (∂/∂θ)T m → n (i,j) are calculated exactly and stored in a table prior tothe start of pass two. When node n is visited during pass two,Un (j) is computed first, then (∂/∂θ)P m → n is computed for each parameter θ in the model. Because the (∂/∂θ)T m → n (i,j) are already computed and stored in a table, computing (∂/∂θ)P m → n for a right branch requires only that the termsUm (i),Rm (i), (∂/∂θ)T m→ n (i,j), andDn (j) be multiplied and summed overi and j. For a left branch, we substituteLm (i) forRm (i) in this calculation. When all of the nodes have been visited, the partial derivatives of Pare recovered via Equation { label needed for disp-formula[@id='E16'] }.
Likelihood Computation for Fig. 1a
| Step | Node | Action |
| 1 | 5 | L 5(i) = T 5→1 (i, s 1) |
| 2 | 5 | R 5(i) = R 5→2 (i, s 2) |
| 3 | 5 | D 5(i) = L 5(i) R 5(i) |
| 4 | 6 | L 6(i) = T 6→3(i, s 3) |
| 5 | 6 | R 6(i) = T 6→4 (i, s 4) |
| 6 | 6 | D 6(i) = L 6(i) R 6(i) |
| 7 | 7 | L 7(i) = ∑ j T 7→5(i,j)D 5(j) |
| 8 | 7 | R 7(i) = ∑ j T 7→6(i,j)D 6(j) |
| 9 | 7 | D 7(i) = L 7(i)R 7(i) |
| 10 | 7 | P = ∑i π i D 7(i) |
Computation of Derivatives for Fig. 1a
| Step |
Node
| Action |
| 1 | 7 |
|
| 2 | 7 |
|
| 3 | 5 |
|
| 4 | 5 |
|
| 5 | 1 |
|
| 6 | 2 |
|
| 7 | 6 |
|
| 8 | 6 |
|
| 9 | 3 |
|
| 10 | 4 |
|
Likelihood Maximization and Simulated Annealing
We have implemented the extension of Kimura’s model described above and the likelihood algorithms sketched in the previous section in a C++ program named LINNEAUS. Maximum likelihood estimation is performed within LINNEAUS by a C++ version of the optimization program SEARCH (Lange 1997). SEARCH minimizes a nonlinear function by the method of recursive quadratic programming, with quasi-Newton updates of the approximate second differential (Hessian) of the objective function based on successive values of the first differential (gradient) of the objective function (Polak 1997). It is possible to implement Newton’s method using SEARCH, but the second derivatives in our model are cumbersome to compute, and LINNEAUS avoids explicit calculation of them. Exploiting the ability of SEARCH to perform numerical differentiation, we estimate that the modified peeling algorithm described in the previous section approximately doubles the speed of LINNEAUS (data not shown). These timing trials have the beneficial side effect of validating our code for the derivatives ofP(t). Finally, SEARCH permits upper and lower bounds and linear equality constraints to be imposed on parameters. Linear constraints are convenient because the reversibility conditions (Equation { label needed for disp-formula[@id='E3'] }) can be linearized by taking logarithms. Reparameterizing with log parameters has the added virtue of eliminating nonnegativity constraints.
SEARCH needs initial parameter values and an initial approximate Hessian. If maximum likelihood estimation is performed for a sequence of similar trees, then the parameter estimates from one tree can be used as initial parameter values for the next tree. The identity matrix serves as the default initial Hessian in SEARCH. Within LINNEAUS, the subprogram SEARCH minimizes the negative loglikelihood
Maximum likelihood estimation for a single tree must be fast enough to accommodate comparison of large numbers of different trees through their maximum likelihoods. With n taxa, there are (2n − 3)!/[2 n−2(n − 2)!] rooted trees and (2n − 5)/[2 n−3(n − 3)!] unrooted trees. These numbers are manageable for n ≤ 7, but exhaustive consideration of all trees is out of the question forn > 10, and we must turn to heuristic methods of searching tree space. For example, Felsenstein (1981) suggests building an n-taxon tree by starting with any two-taxon subtree and successively adding one taxon at a time. At each stage the new taxon is attached to the existing branch that gives the subtree with largest maximum likelihood. Because the initial pair of taxa is arbitrary, Felsenstein further recommends repeating the construction using different rearrangement orders. Unfortunately, even further refinements of this greedy strategy still examine only a small fraction of tree space (Olsen 1994; Yang 1994).
Because the combinatorial optimization method of simulated annealing permits a wider search, Lundy (1985) suggested its use in phylogenetic reconstruction. For the sake of brevity, we omit a description of simulated annealing and refer readers to the references (Kirkpatrick 1983; Press 1988) for motivation and most details of implementation. The unique elements in the current setting are the energy function, the proposal mechanism, and the initial temperature. It is natural to define the energy of a tree to be its negative maximum loglikelihood. In the proposal stage, we randomly select any node other than the root node, delete the subtree rooted at this node, and reattach the subtree to a randomly selected branch among the remaining branches. The new tree is accepted with the Metropolis probability
Program Performance
One obvious way of improving program speed is to exploit parallel processing. The fastDNAml program of Olsen et al. (1994) achieves superior performance by splitting likelihood computation for a phylogenetic tree into several processes that take advantage of massively parallel and clustered computing architectures. In writing LINNEAUS in Microsoft Visual C++ 5.0, we chose the most natural synchronous multithreading approach to program parallelization. LINNEAUS simply assigns each available processor to a different site of an aligned sequence. We achieve a further gain in efficiency by amalgamating those sites with a common pattern of observations and multiplying the loglikelihood and score computed for the pattern by the number of participating sites. Note that most sites in an alignment show complete agreement over all taxa; the exceptions (or segregating sites) generate most of the patterns. Under a symmetric multiprocessing operating system such as Windows NT 4.0, our current code detects the number of processors available at runtime and assigns a different observational pattern to each processor. When a processor finishes its thread, that is, computing the corresponding loglikelihood and score, it is reassigned to a new pattern unless none remains. Because most of the time in likelihood maximization is spent in these threads, our computing times per likelihood maximization are nearly inversely proportional to the number of available processors. Linear scalability of this sort is one of the hallmarks of good parallel code.
To test the performance of LINNEAUS, we examined 12 full-length HIV genome sequences available from the Los Alamos HIV web site (Myers 1996). These taxa were obtained from 10 individuals and also include one clade B consensus sequence. The size (∼10,000 nucleotide sites per sequence) and the number of segregating sites (∼15% of the sites per sequence) represent a challenging computational problem. We selected 20 groups of 4, 5, and 6 taxa each and 7 groups of 10 taxa each from the original 12 taxa. Table 3 lists the average time, plus or minus one standard deviation, necessary to maximize the likelihood of one tree for the different size trees. The ALR Revolution 2× desktop computer used in these timing studies has two 300 MHz Intel Pentium II processors, each with a 512-kb L2 cache and 512 Mb of RAM. We have replicated the linear scalability results evident in Table 3 on an older four-processor machine. These four-processor results are comparable to the two-processor results and are omitted. We have also partially ported our code to a 14-processor Sun Ultra Enterprise 5000 with 1GB of RAM running under the Solaris operating system. Our preliminary results on this high-end computer demonstrate that in excess of 100 likelihoods can be maximized per second for 10-taxon trees.
Per Tree Timing Results for Maximum Likelihood
| Number of taxa | Number of segregating sites | Single-processor times (sec) | Multiprocessor times (sec) |
| 4 | 114–180 | 0.282 ± 0.062 | 0.149 ± .0336 |
| 5 | 195–641 | 0.706 ± 0.250 | 0.365 ± 0.156 |
| 6 | 307–931 | 1.54 ± 0.45 | 0.756 ± 0.248 |
| 10 | 902–2163 | 4.08 ± 0.96 | 2.02 ± 0.43 |
Data Example
In this section, we apply our generalization of Kimura’s model to a portion of the four-taxon data used by Lake (1988) to infer the closest prokaryotic relative of the eukaryotes. Lake aligned ribosomal RNA from a eukaryote (Aretemia salina) and from three prokaryotes, the eocyte (Desulfurococcus mobilis), the halobacterium (Halococcus morrhuae), and the eubacterium (Bacillus subtilis). Here we examine a subset of 1092 aligned nucleotide quartets from Lake’s data. Adopting his designation, let E designate the topology with A. salina and D. mobilisas sister taxa, let F designate the topology with A. salinaand H. morrhuae as sister taxa, and let G designate the topology with A. salina and B. subtilis as sister taxa (see Fig. 2).
The E, F, and G topologies represent all possible topologies for the four-taxon case.
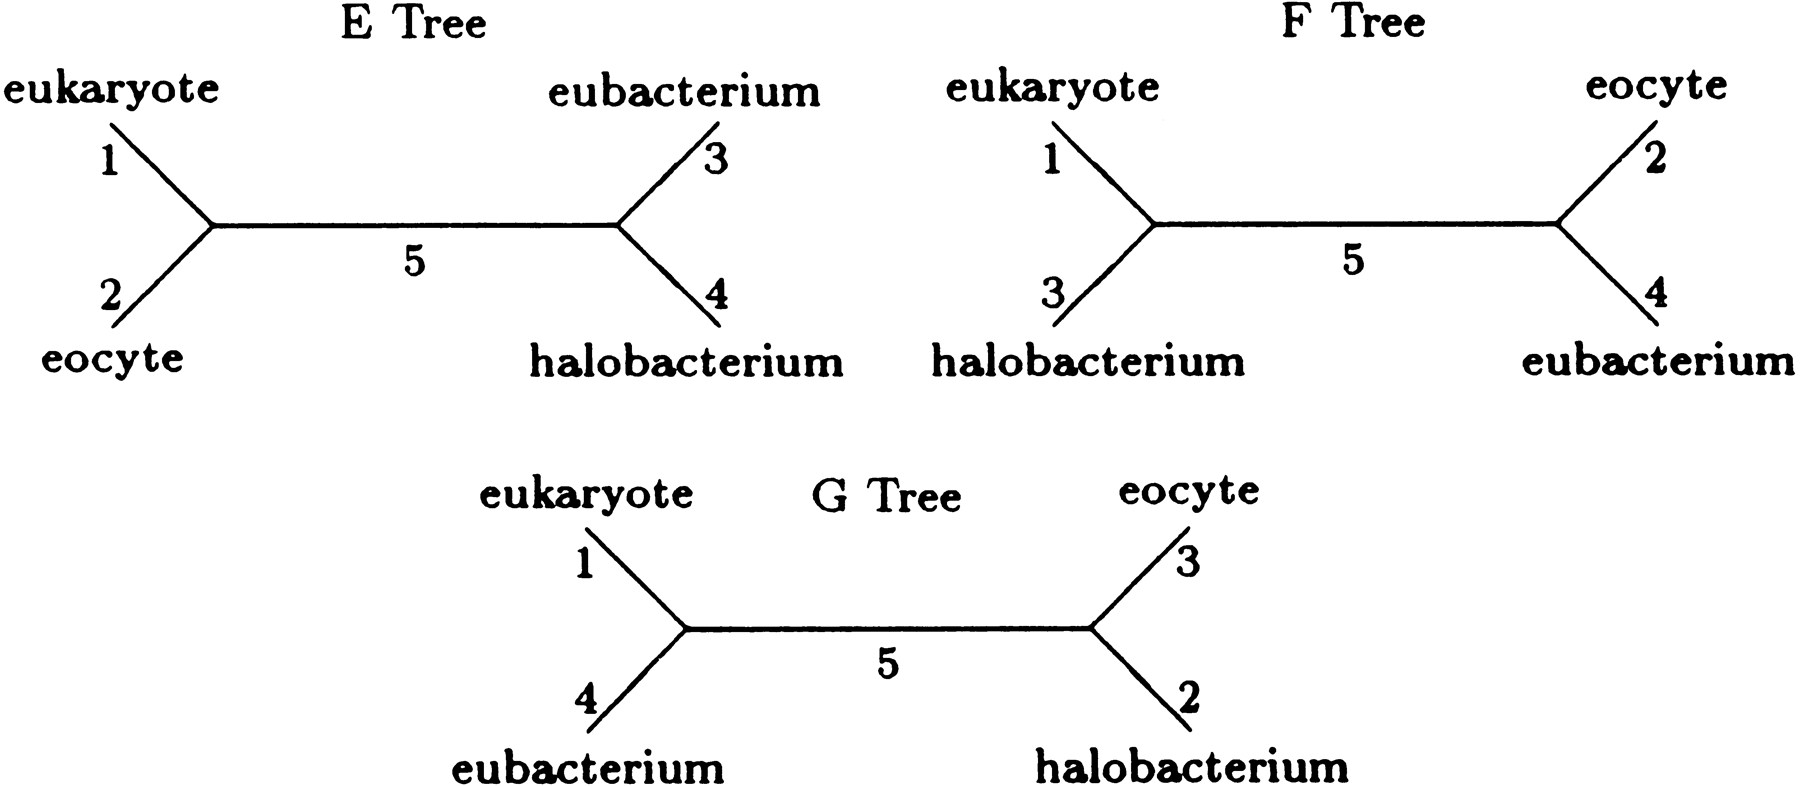
Table 4 gives parameter estimates and maximum loglikelihoods (base e) for the most probable trees under four different models. Model 1 is the equilibrium version of F84 model described in Kishino and Hasegawa (1989). Model 2 is our model (Equation { label needed for disp-formula[@id='E2'] }) with the reversibility restrictions (Equation { label needed for disp-formula[@id='E3'] }) and equilibrium at the root imposed. Both models 1 and 2 satisfy the pulley principle and therefore, cannot be used to root trees. Model 3 coincides with model 2 except that the equilibrium assumption is relaxed. This entails adding three additional parameters to determine the root distribution. Model 4 coincides with model 3 except that the reversibility assumption is relaxed. Simulated data that we omit show that models 3 and 4 can be used to root trees.
Parameter Estimates for the Best Trees Under Four Sets of Modeling Assumptions
| Parameter | Model 1 | Model 2 | Model 3 | Model 4 | |
| α | 0.155 ± 0.016 | 0.125 ± 0.015 | 0.051 ± 0.013 | ||
| β | 0.174 ± 0.019 | 0.200 ± 0.021 | 0.217 ± 0.023 | ||
| γ | 0.084 ± 0.007 | 0.071 ± 0.007 | 0.078 ± 0.009 | ||
| δ | 0.080 ± 0.007 | 0.092 ± 0.009 | 0.060 ± 0.009 | ||
| ε | 0.174 ± 0.018 | ||||
| κ | 0.107 ± 0.009 | 0.083 ± 0.008 | 0.117 ± 0.013 | ||
| λ | 0.067 ± 0.006 | 0.086 ± 0.008 | 0.078 ± 0.009 | ||
| ς | 0.134 ± 0.025 | ||||
| u | 0.333 ± 0.023 | ||||
| κ | 0.464 ± 0.077 | ||||
| π A | 0.233 ± 0.013 | 0.202 ± 0.012 | 0.193 ± 0.012 | ||
| π G | 0.316 ± 0.014 | 0.362 ± 0.015 | 0.373 ± 0.015 | ||
| π C | 0.245 ± 0.013 | 0.290 ± 0.014 | 0.297 ± 0.015 | ||
| π T | 0.206 ± 0.012 | 0.141 ± 0.011 | 0.137 ± 0.011 | ||
| Branch 1 | 1 ± 0 | 1 ± 0 | 1 ± 0 | 1 ± 0 | |
| Branch 2 | 0.232 ± 0.047 | 0.234 ± 0.047 | .001 | 0.110 ± 0.044 | |
| Branch 3 | 0.538 ± 0.065 | 0.539 ± 0.065 | 0.544 ± 0.065 | 0.568 ± 0.065 | |
| Branch 4 | 1.650 ± 0.154 | 1.642 ± 0.153 | 1.671 ± 0.155 | 1.690 ± 0.154 | |
| Branch 5 | 0.194 ± 0.052 | 0.188 ± 0.051 | 0.196 ± 0.051 | 0.190 ± 0.050 | |
| Branch 6 | 0.215 ± 0.046 | 0.082 ± 0.050 | |||
| Best tree | topology E | topology E | tree 5 | tree 5 | |
| Iterations | 11 | 11 | 11 | 11 | |
| Max log likelihood | −4606.6 | −4598.2 | −4555.7 | −4536.2 | |
| χ2(df) | 140.8 (7) | 124.0 (6) | 39.0 (2) | ||
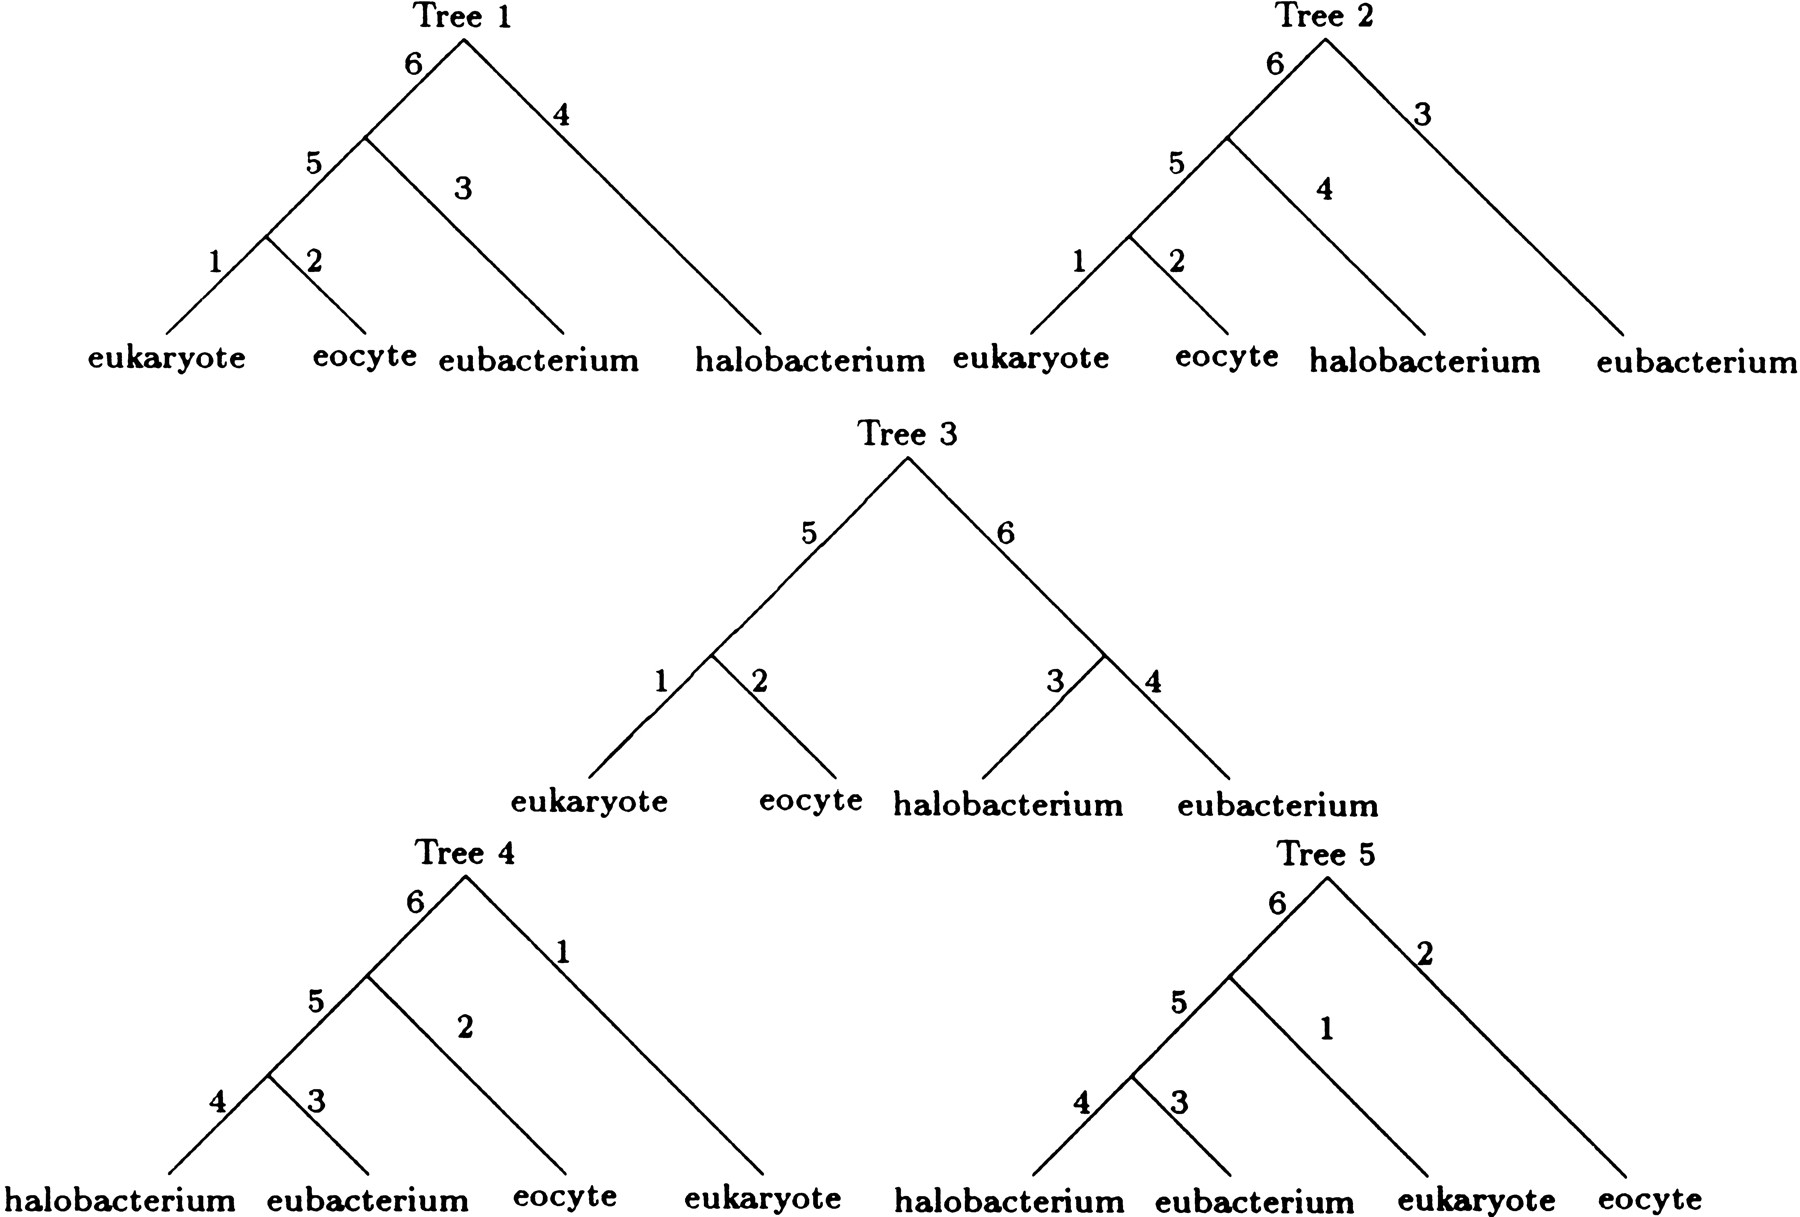
Under all four models, the best tree has the E topology. For models 1 and 2, the maximum loglikelihoods of the next best topology, the F topology in both cases, are −4614.2 and −4605.2, respectively. Tree 5 in Figure 3 depicts the best rooted tree for both models 3 and 4. Unfortunately, we have little confidence in this rooting. In the case of model 4, the two remaining trees in the E topology have maximum loglikelihoods of −4537.3 and −4537.4, respectively. Similarly inconclusive results hold for model 3. Under models 3 and 4, the best maximum loglikelihoods for trees with the F or G topology (−4564.1 and −4544.2, respectively) are substantially worse than the maximum likelihoods listed in Table 4. LINNEAUS reached the maximum likelihood estimates for all four models listed in Table 4in just 11 iterations.
The five rooted trees corresponding to the unrooted tree with the E topology. These rooted trees are obtained by placing the root in each of the five branches of the unrooted tree.
Models 1, 2, and 3 are nested within model 4. Within the context of the best topology, or where applicable the best rooted tree, we can therefore conduct likelihood ratio tests of the three submodels versus model 4. The χ2 statistics given at the bottom of Table 4overwhelming reject each of the submodels. Clearly, assuming that the four nucleotides are at equilibrium is a poor idea in these data. This impression is reinforced by the empirical frequencies shown in Table5. Relaxing the reversibility restrictions also substantially improves model fit. Finally, the fact that we estimate the length of branch 2 in model 3 at the somewhat artificial lower bound of 0.001 is another indication of the superiority of model 4.
Observed Base Proportions for the Four Contemporary Taxa
| Base | A. salina (eukaryote) | D. mobilis (eocycte) | H. morrhuae (halobacterium) | B. subtilis (eubacterium) |
| A | 0.250 | 0.232 | 0.202 | 0.255 |
| G | 0.319 | 0.328 | 0.367 | 0.279 |
| C | 0.230 | 0.263 | 0.290 | 0.234 |
| T | 0.202 | 0.178 | 0.141 | 0.232 |
Because all four models represent restrictions of the multinomial model with 44 − 1 = 255 degrees of freedom (Navidi et al. 1991), goodness of fit can be roughly assessed by comparing the maximum loglikelihood (−4536.2) under the best tree of model 4 with the maximum loglikelihood (−4361.3) under the unrestricted multinomial model. The resulting χ2 test statistic χ2 238 = 349.8 has asymptoticP value ≅0.0001. This apparent lack of fit may spring from the failure of any of three different assumptions: (1) the transversion symmetries in our matrix Λ, (2) the applicability of large sample approximations to sparse data, and (3) the assumption that the various sites act independently and identically. Although it is impossible to make a firm judgment in the current case, it is worth noting that the phenomenon of heterogeneity of substitution rates across sites is well-documented (Gojobori 1982; Yang 1993). In particular, Rzhetsky (1995) shows substantial variation in the substitution rates between the stem and loop regions of 16S-like ribosomal RNA genes from higher eukaryotes.
Conclusions
Maximum likelihood is at an obvious computational disadvantage in molecular phylogeny. To a lesser extent, it is also handicapped by the simplicity of the models it traditionally invokes. The thrust of the current paper is that advances in model construction and algorithm design can go hand in hand. Although our generalization of Kimura’s base-substitution model involves a more complicated infinitesimal generator, the new generator Λ retains just enough symmetry to permit exact calculation of the matrix exponential e tΛ and its corresponding equilibrium distribution π. Furthermore, this more flexible model can be coupled with better algorithms for maximum likelihood estimation and search of tree space.
A key ingredient in the rapid optimization of any function is the ability to eval-
uate it and its derivatives quickly. Our new algorithm for likelihood differentiation should be viewed in this light. Combining this algorithm with a good, general purpose optimization subprogram and parallelizing the resulting code leads to very fast maximum likelihood estimation per tree. In fact, we now consider our likelihood optimization methods fast enough to harness simulated annealing in a search of tree space for the best tree. While simulated annealing is slower than competing methods in phylogenetic inference, it is slower precisely because it analyzes a greater number of trees, and so, tends to the best tree with greater probability.
Our infinitesimal generator Λ, which is irreversible in general, opens up the possibility of rooting trees. As Felsenstein’s celebrated pulley principle shows, rooting is impossible in a reversible model when the root frequencies are at equilibrium and no constraints are imposed on branch lengths. Abandoning any of these three assumptions makes it possible in principle to root a tree. For instance, if constraints are imposed on branch lengths by assuming a molecular clock, it is possible to root a tree. However, the practical difficulty of rooting in the presence of limited data has led many researchers to dismiss the possibility altogether. Yang (1994) raises the additional numerical concern that the eigenvalues of the infinitesimal generator may be complex when reversibility fails. It is interesting to note that all eigenvalues of our matrix Λ are real.
Our experience only partially bears out the pessimism about rooting. Although topologically equivalent trees usually have similar maximum likelihoods and the root position within the best tree is usually poorly determined, we do see substantial increases in loglikelihoods when passing from simple reversible models to our more complex irreversible model. In our opinion, the massive amounts of data coming out of the various genome sequencing projects will fundamentally change the course of phylogenetic inference. Instead of aligned sequences of 103 sites, we may well have aligned sequences of 106–108 sites. Of course, this quantitative shift merely emphasizes the necessity of further gains in computing efficiency if maximum likelihood is to be the phylogenetic inference engine of choice.
In any event, the results presented in this article are meant to demonstrate the feasibility of major improvements in computing speed in maximum likelihood methods. Researchers interested in a free copy of LINNEAUS should contact one of the authors.
We thank Professor James A. Lake for providing the aligned DNA sequences for our Section 6 example. The authors would also like to thank the reviewers and the editor for their helpful comments and clarifications. Research was supported in part by U.S. Public Health Service grant GM53275 (to K.L.) and CA16042 (to J.S.S.) and National Institute of General Medical Sciences (NIGMS) Systems and Integrative Biology Training grant GM08185-11 (to E.E.S.).
The publication costs of this article were defrayed in part by payment of page charges. This article must therefore be hereby marked “advertisement” in accordance with 18 USC section 1734 solely to indicate this fact.
If the constants c 1 throughc 7 are defined as in the text, and if
Notes
[1] Corresponding author.
Notes
[2] E-MAIL [email protected]; FAX (650) 855-6115.
REFERENCES
- ↵J. AdachiM. Hasegawa (1996) MOLPHY, Version 2.3. (The Institute of Statistical Mathematics, Tokyo, Japan).
- ↵D. BarryJ.A. Hartigan (1987) Statistical analysis of hominoid molecular evolution. Stat. Sci. 2:191–210.
- ↵L.E. Baum (1972) An inequality and associated maximization technique in statistical estimation for probabilistic functions of Markov processes. Inequalities 3:1–8.
- ↵P.A. Devijver (1985) Baum’s forward-backward algorithm revisited. Pattern Recognition Lett. 3:369–373.
- ↵J. Felsenstein (1981) Evolutionary trees from DNA sequences: A maximum likelihood approach. J. Mol. Evol. 17:368–376.
- ↵J. FelsensteinG.A. Churchill (1996) A Hidden Markov Model approach to variation among sites in rate of evolution. Mol. Biol. Evol. 13:93–104.
- ↵T. GojoboriK. IshiiM. Nei (1982) Estimation of average number of nucleotide substitutions when the rate of substitution varies with nucleotides. J. Mol. Evol. 18:414–423.
- ↵M. HasegawaH. KishinoT. Yano (1985) Dating of the human-ape splitting by a molecular clock of mitochondrial DNA. J. Mol. Evol. 22:160–174.
- ↵F.P. Kelly (1979) Reversibility and stochastic networks. (Wiley, New York, NY).
- ↵M. Kimura (1980) A simple method for estimating evolutionary rates of base substitutions through comparative studies of nucleotide sequences. J. Mol. Evol. 16:111–120.
- ↵S. KirkpatrickC.D. GelattM.P. Vecchi (1983) Optimization by simulated annealing. Science 220:671–680.
- ↵H. KishinoM. Hasegawa (1989) Evaluation of the maximum likelihood estimates of the evolutionary tree topologies from DNA sequence data and the branching order in Hominoidea. J. Mol. Evol. 29:170–179.
- ↵J.A. Lake (1987) A rate-independent technique for analysis of nucleic acid sequences: Evolutionary parsimony. Mol. Biol. Evol. 4:167–191.
- ↵(1988) Origin of the eukaryotic nucleus determined by rate-invariant analysis of rRNA sequences. Nature 331:184–186, ibid.
- ↵K. Lange (1997) SEARCH, Version 3.0 (University of Michigan, Ann Arbor, MI).
- ↵K. LangeM. BoehnkeD.R. CoxK.L. Lunetta (1995) Statistical methods for polyploid radiation hybrid mapping. Genome Res. 5:136–150.
- ↵M. Lundy (1985) Applications of the annealing algorithm to combinatorial problems in statistics. Biometrika 72:191–198.
- ↵G. MyersB. KorberS. Wain-HobsonK.T. JeangL.E. HendersonG.N. Pavlakis (1996) Human retroviruses and AIDS. (Los Alamos National Laboratory, Los Alamos, NM).
- ↵W.C. NavidiG.A. ChurchillA. von Haeseler (1991) Methods for inferring phylogenies from nucleic acid sequence data by using maximum likelihood and linear invariants. Mol. Biol. Evol. 8:128–143.
- ↵G.J. OlsenH. MatsudaR. HagstromR. Overbeek (1994) fastDNAml: A tool for construction of phylogenetic trees of DNA sequences using maximum likelihood. Comput. Appl. Biosci. 10:41–48.
- ↵E. Polak (1997) Optimization: Algorithms and consistent approximations. (Springer-Verlag, New York, NY).
- ↵W.H. PressB.P. FlanneryS.A. TeukolskyW.T. Vetterling (1988) Numerical recipes in C. (Cambridge University Press, New York, NY).
- ↵C.R. Rao (1973) Linear statistical inference and its applications (Wiley, New York, NY), 2nd ed.
- ↵A. Rzhetsky (1995) Estimating substitution rates in ribosomal RNA genes. Genetics 141:771–783.
- ↵K. TamuraM. Nei (1993) Estimation of the number of nucleotide substitutions in the control region of mitochondrial DNA in humans and chimpanzees. Mol. Biol. Evol. 10:512–526.
- ↵S. Tavare (1986) Some probabilistic and statistical problems in the analysis of DNA sequences. Lect. Math. Sci. 17:57–86.
- ↵M.S. Waterman (1996) Introduction to computational biology: Maps, sequences and genomes. (Chapman & Hall, New York, NY).
- ↵Z. Yang (1993) Maximum-likelihood estimation of phylogeny from DNA sequences when substitution rates differ over sites. J. Mol. Evol. 10:1396–1401.
- ↵(1994) Estimating the pattern of nucleotide substitution. J. Mol. Evol. 39:105–111, ibid.