Abstract
BRCA1 and BRCA2 germline variant classification is vital for clinical management of families with hereditary breast and ovarian cancer. However, clinical classification of rare variants outside of the splice donor/acceptor ±1,2-dinucleotides remains challenging, particularly for variants that induce new or cryptic splice site usage. Here, we present SeqSplice, a high-throughput RNA splicing methodology utilizing barcoded minigene constructs together with a bespoke bioinformatics pipeline for identifying and quantifying the impacts for splice-altering variants. SeqSplice exhibits excellent reproducibility across cDNA input and PCR cycle differences and is able to identify and quantitate transcripts that differed by a single base. Of the 193 BRCA1 and 72 BRCA2 variants profiled, 89% (237/265) had no publicly available RNA splicing data. Complete or near complete impact owing to splice site gain/loss is observed for 42 variants, with 30 (71%) producing alternative transcripts owing to new or cryptic splice sites. These findings are used to update our aberration type predictor called SpliceAI-10k calculator, resulting in 94% specificity and 90% sensitivity for major alternative transcripts (>50% proportion). Comparison of SeqSplice findings for 28 variants with published data shows the value and limitations of using construct-based results for variant classification. Overall, our findings inform use of construct-derived data for clinical variant classification. We show that construct-derived results for variants showing low or no splicing impact provide reliable evidence against variant pathogenicity, whereas—for variants demonstrating splicing impact—construct design and naturally occurring alternative splicing are important considerations for assigning and weighting evidence towards pathogenicity.
Genetic variation that disrupts splicing can lead to abnormal messenger RNA transcripts with severe consequences on protein expression and/or function and is the underlying cause for a wide range of human genetic disorders (Scotti and Swanson 2016). Although rare DNA sequence variants with putative impact on RNA transcripts are regularly identified in clinical sequencing tests, determining the actual biological and clinical relevance of rare genetic variants remains challenging. Current methods to assess variant effect on RNA splicing range from computational approaches focused on the variant impact on specific splicing motifs (Cartegni et al. 2003; Yeo and Burge 2004; Erkelenz et al. 2014; Signal et al. 2018) or overall impact on splicing (Cheng et al. 2019; Jaganathan et al. 2019; Monger et al. 2019; Leman et al. 2022; Zeng and Li 2022; Sullivan et al. 2023), to laboratory assays including targeted RT-PCR analysis and RNA sequencing-based tests (Casadei et al. 2019; Wai et al. 2020; Bournazos et al. 2022). Bioinformatic splicing predictions and RNA splicing assay data are then used as evidence in variant pathogenicity assessment models, including the widely adopted American College of Medical Genetics and Genomics (ACMG)/Association for Molecular Pathology (AMP) framework (Richards et al. 2015; Walker et al. 2023).
Bioinformatic splicing predictions can assist in assessing the pathogenicity of unclassified variants and aid the experimental design of splicing assays. When calibrated against results from splicing assays, predictions alone can be weighted to provide evidence for or against pathogenicity (Walker et al. 2023). In particular, variants at the splice donor/acceptor ±1,2-dinucleotides have such a high likelihood to alter splicing that they are assigned a PVS1 code unless the predicted impact is not considered clinically relevant (Walker et al. 2023). Thus, clinical variant data sets from clinical cohorts in which the patients underwent RNA analysis based on bioinformatic prediction of splicing impact are enriched for splice donor/acceptor ±1,2 dinucleotide variants. However, variants outside of the canonical splice donor/acceptor ±1,2 dinucleotides may also produce aberrant transcripts by creating a new splice site, activating a cryptic splice site, or disrupting splicing regulatory elements, polypyrimidine tracts, or branchpoint sites (Anna and Monika 2018). For these types of variants, established splicing prediction tools demonstrate lower predictive performance compared with canonical splice donor/acceptor ±1,2 dinucleotide variants, and variants that create new splice sites and those located within exons can be particularly difficult to predict (Sullivan et al. 2023).
Highlighting the limitations of bioinformatic predictions, experimentally observed outcomes on RNA splicing are considered strong evidence for variant pathogenicity according to the baseline ACMG/AMP criteria (Richards et al. 2015). Recent recommendations indicate that higher evidence weight (up to very strong) is permissible for variants resulting in aberrant splicing profile that is interpretable via the PVS1 decision process, irrespective of their location relative to the splice donor/acceptor ±1,2-dinucleotides (Walker et al. 2023). Although RNA analysis using relevant material from individuals harboring a suspected splice-altering variant is generally preferred to generate experimentally observed outcomes on splicing, this is often hampered by specimen unavailability. Given this, one alternative that circumvents the practical difficulties of collecting and testing patient specimens is utilization of splicing reporter minigene constructs. These minigenes are composed of a genomic region of interest, spanning either a single exon or multiple exons and flanking intronic sequences, which are cloned into an expression vector with two constitutive exons (Cooper 2005; Gaildrat et al. 2010). The advantages of this empirical, hemizygous system are that it allows for allele-specific quantitative measurements of variant impact on splicing (Walker et al. 2023), permits assessment of cell-specific splicing effects by transient expression in different cell lines, and is easily scalable for high-throughput RNA analysis (Soemedi et al. 2017; Adamson et al. 2018; Chong et al. 2019).
Given the potential advantages of a minigene system to experimentally assess RNA splicing effects, we developed a scalable, high-throughput minigene splicing assay to assess the effects of 265 BRCA1 or BRCA2 variants selected based on their predicted potential to create a new splice site, 89% of which (237/265) had no previously reported RNA splicing data. Targeted resequencing of spliced transcripts generated by this method was then analyzed by a concomitant, bespoke bioinformatics pipeline termed SeqSplice to identify and quantitate transcripts and indicate the severity of splicing alterations. Observed variant impact on splicing was then compared to predicted impact from the MaxEntScan (MES)-based method originally used to inform selection of variants (Vallée et al. 2016), and to derive an updated version of a SpliceAI-based predictor of splicing aberration type (Canson et al. 2023). Findings of this study demonstrated the value of construct-derived splicing data for variant classification and for informing improved bioinformatic prediction for variants that create new splice sites or activate cryptic splice sites.
Results
Development parameters of the SeqSplice workflow
To enable a high-throughput and sensitive method for identification and quantitation of variant-induced transcripts, a wet-laboratory targeted resequencing protocol utilizing the pSPL3 vector was developed (Fig. 1A) with a concomitant, bespoke integrated bioinformatics package called SeqSplice (Fig. 1B). In brief, an analysis set of 192 samples is processed as a single batch split between the HS578T and MDA-MB-231 cell lines and contains 24 negative controls (eight each of untreated cells, cells with Lipofectamine, and empty green fluorescent protein [GFP] vector transfections), eight positive controls (the pSPL3 empty vector), and 160 experimental samples (Supplemental Fig. S1). This constitutes one batch of samples that is sequenced as a single run on a MiSeq (Illumina). For this project, multiple batches were sequenced. Incorporating two different cell lines into the workflow was done to enable identification of cell-specific splicing effects.
The SeqSplice workflow. (A) Experimental design of the minigene splicing assays. Synthetic BRCA1 and BRCA2 exons (pink) and flanking intronic sequences (gray) are cloned in between the pSPL3 vector exons, and variants are introduced via mutagenesis. WT and variant minigene constructs are transfected into HS578T and MDA-MB-231 cell lines, followed by RNA sequencing of the produced transcripts. Transcript proportions are calculated using our custom SeqSplice software package. (B) A conceptual breakdown of the steps involved in the SeqSplice RNA isoform identification and quantitation.
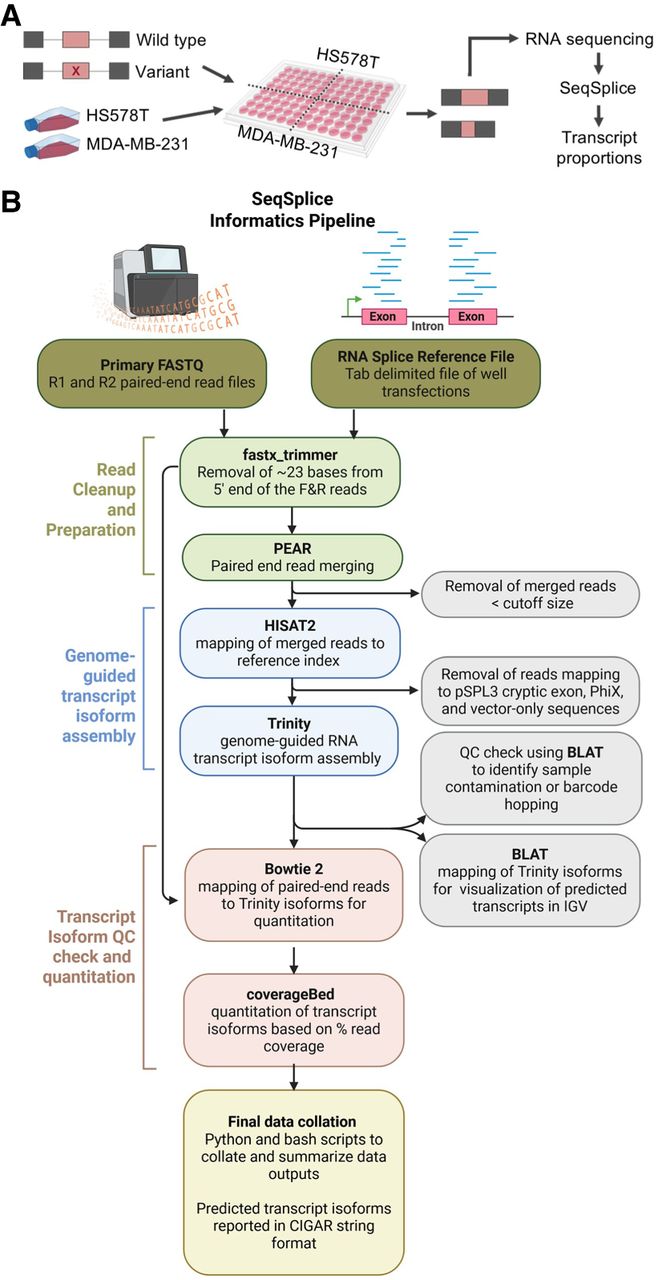
The SeqSplice software (Fig. 1B) uses wrapper scripts in a multistep pipeline, the key element of which involves genome-guided de novo reconstruction of spliced transcripts using the Trinity software suite (Grabherr et al. 2011). Critically, by using Trinity's de novo reconstruction for transcript identification, this method makes no assumptions about the structure of any transcript and therefore represents an unbiased way to determine the outcome that a sequence variant has on transcript assembly. The final output of the program are summary files that
tabulate and collate all metrics and information generated during mapping,
quantify all transcripts present in each sample,
report spliced transcripts in CIGAR string format that facilitates determination of novel transcripts by comparing two text strings,
incorporate a penultimate contamination check that cross-references all results to a reference library and identifies whether the expected exon under interrogation is present, and
determine whether read-leakage or cross-contamination of the vector and/or libraries has occurred during the transfection, library preparation, and/or sequencing process.
Assessing sensitivity, reproducibility, and quantitation of the SeqSplice workflow
After establishing the fundamental parameters of the SeqSplice workflow as detailed above, an experiment to assess the sensitivity, reproducibility, and quantitative ability of the methodology was undertaken. Initial reproducibility experiments focused on transfection with a pSPL3 vector containing wild-type (WT) BRCA2 exon 4, which was previously validated as producing no transcripts from alternative splice site usage. These results were compared to those from a known BRCA1 exon 5 variant (c.188T>C) that produces a naturally occurring alternative isoform containing a 22 bp deletion (Δ5q22), in addition to the full-length (FL) transcript. As part of this experiment, we also assessed construction of SeqSplice libraries at different input concentrations of cDNA (ranging from an undiluted sample to 1:2, 1:4, 1:8, and 1:16 dilution of the original cDNA template), together with different PCR cycles (16, 18, and 20 cycles) of the different input template concentrations. This resulted in a panel of samples with varying read numbers, which were pooled at equal volumes to generate identical libraries with a broad range of total reads. Initial parameter optimization and thresholding identified that the predominant FL transcript present in the control samples could be assembled with a minimum of about 600 paired-end reads. Consistent assembly and identification of the secondary Δ5q22 isoform produced by the BRCA1 exon 5 variant required a minimum of approximately 4000 paired-end reads, and past this threshold, >95% of all reads in a sample could be definitively assigned (Supplemental Fig. S2).
As shown in Figure 2, A and B, identification and quantitation functions of SeqSplice for the different BRCA1 and BRCA2 spliced transcripts in the control experiment were consistent across all template input amounts and PCR cycling conditions, despite the fact that total reads varied by about 2.5 orders of magnitude between the highest and lowest concentration samples. As there was no detectable difference between the proportions of transcripts produced by the different input amounts of RNA/cDNA, this enabled more effective high-throughput screening, as the workflow did not require normalization of cDNA amounts prior to PCR. Our control experiment also addressed the potential differences in transcript expression owing to cDNA generation, subsequent PCR amplification, and MiSeq bridge amplification, which are major concerns for RT-PCR-based methods of RNA profiling. The BRCA1 c.188T>C construct generated three transcripts of different sizes, ranging from exon skipping (180 bp), Δ5q22 alternative isoform (236 bp), and FL transcript (258 bp) (Fig. 2B). The data in Figure 2B showed that despite the differences in transcript length, the proportionality of all three transcripts was maintained across a range of cDNA input amounts and PCR cycling conditions, when determined by MiSeq sequencing.
Assessing SeqSplice output reproducibility. (A) Control experiment using a BRCA2 exon 4 WT construct to assess reproducibility of transcript identification and abundance across a range of cDNA template input amounts and PCR cycles. (B) Control experiment using a BRCA1 c.188T>C variant construct to assess reproducibility of transcript identification and abundance across a range of cDNA template input amounts and PCR cycles.
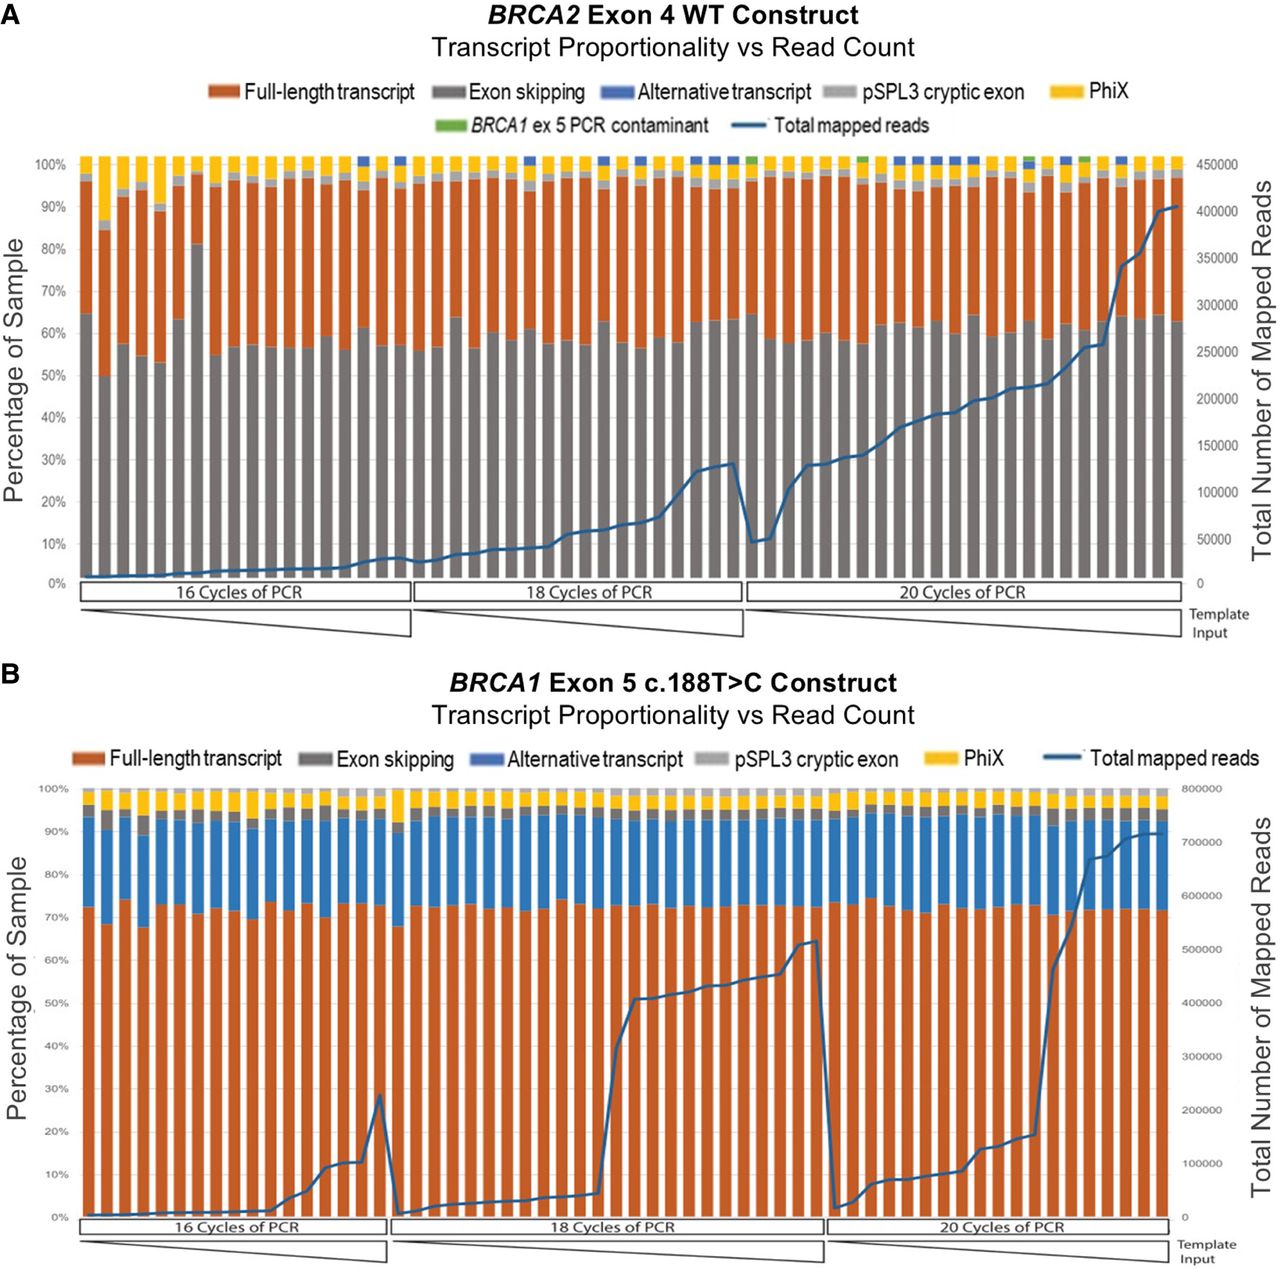
Within this experiment, additional reads mapping to unexpected sequences were also identified. For both sample sets shown in Figure 2, exon skipping events (i.e., reads that failed to incorporate any portion of the exon) were present in all samples, as well as a pSPL3 cryptic exon. PhiX reads comprised 1%–3% of each barcoded sample, although PhiX did not have any library barcodes (Supplemental Fig. S3). PhiX is a nonbarcoded spike-in library provided by Illumina when sequencing low diversity samples that may show as contamination during read assembly (Mukherjee et al. 2015). Finally, a low level of cross-contamination or barcode hopping was also successfully detected in the BRCA2 exon 4 data set using our quality-control measures (Fig. 2A). This demonstrated the excellent sensitivity of SeqSplice pipeline for unexpected sequences, which facilitates the calculation of correct transcript proportions in the presence of contamination. For the minigene assays conducted after this initial experiment, reads mapping to the pSPL3 cryptic exon and PhiX were removed from each barcoded well before calculating the final transcript proportions.
Minigene splicing in the context of known naturally occurring isoforms
A total of 1078 variant and 191 WT exon transfections passed the bioinformatics pipeline quality control. This included 265 unique single-nucleotide variants assayed in both the HS578T and MDA-MB-231 cell lines (n = 255) or in the MDA-MB-231 cell line only (n = 10) (Supplemental Tables S1, S2). Across all batches for the entire experiment, the negative control wells (i.e., untreated cells, cells with Lipofectamine, and GFP vector) generated fewer than 500 paired-end reads/sample on average, compared with about 80,000 paired-end reads for the pSPL3 positive control and experimental wells (Supplemental Fig. S4), reflecting quality library preparation with negligible nonspecific amplification.
We described the transcripts using shorthand nomenclature for easy identification of affected exons and the sizes of deleted or retained sequences, with examples provided in Figure 3A (for details, see Methods). More than 95% FL transcript was consistently seen in both cell lines for 11 of 18 WT exon constructs: BRCA1 exons 3, 6, 9, 12, 18, 19, 20, 22, and 23 and BRCA2 exons 8 and 9 (Supplemental Fig. S5). WT constructs for BRCA1 exons 5 and 10 and BRCA2 exons 2, 4, 6, and 7 produced >5% exon skipping transcripts (Supplemental Fig. S5). Skipping of these exons is expected as BRCA1 Δ5 is a known predominant alternative isoform, and BRCA1 Δ10 and BRCA2 Δ2, Δ4, and Δ6 are minor alternative isoforms detected in clinically relevant samples (Colombo et al. 2014; Fackenthal et al. 2016). BRCA2 Δ7 is also a natural isoform detected in 1% of RNA sequencing samples in SpliceVault (Dawes et al. 2023). Naturally occurring BRCA1 alternative isoforms resulting from cryptic splice site usage (Colombo et al. 2014) were expressed by exon 5 (Δ5q22) and exon 8 (Δ8p3) WT constructs.
Assessing variant impact on splicing. (A) Illustration of transcript nomenclature showing examples of aberration types. Exon numbers are adjacent to the Δ or ▾ symbols. Deletions (Δ) or retentions (▾) at the 3′ end and 5′ end of exons are indicated by “p” and “q,” respectively. Numbers after “p” and “q” indicate the size (bp) of partial deletion/retention (for details, see Methods). (B–D) Measurements for 255 variants assayed in both the HS578T and MDA-MB-231 cell lines were plotted to show correlations of median full-length (FL; Spearman's ρ = 0.95; B), exon skipping (Spearman's ρ = 0.86; C), and alternative transcript (Spearman's ρ = 0.98; D) proportions. (E) Splicing impact categories based on FL reduction score. (F) Splicing impact of variants (n = 265) located at the splice donor/acceptor ±1,2-dinucleotide positions (SD), splice region excluding the splice dinucleotide positions (SR−SD), and exonic (EX) and intronic (IN) positions outside of the splice region. The splice region (SR−SD) spans from the first exonic base to 20 intronic bases upstream of the exon for the acceptor motif, as well as from the last three exonic bases to six intronic bases downstream from the exon for the donor motif, excluding the ±1,2 dinucleotides (Walker et al. 2023). (G) Plot of BRCA1 variants (n = 57) across the three splicing impact categories against the RNA score derived from Findlay et al. (2018). An RNA score threshold of –2 corresponds to 75% reduction of variant in messenger RNA. (H) Splicing impact of BRCA1 variants excluding missense and nonsense variants (n = 21) and their Findlay function class. (LOF) Loss of function, (FUNC) functional. (I) Distribution of SpliceAI max delta score of variants (n = 265) across the three splicing impact categories. Variants with SpliceAI score ≥0.2 were predicted to impact splicing. (G,I) Median scores are shown as solid horizontal lines.
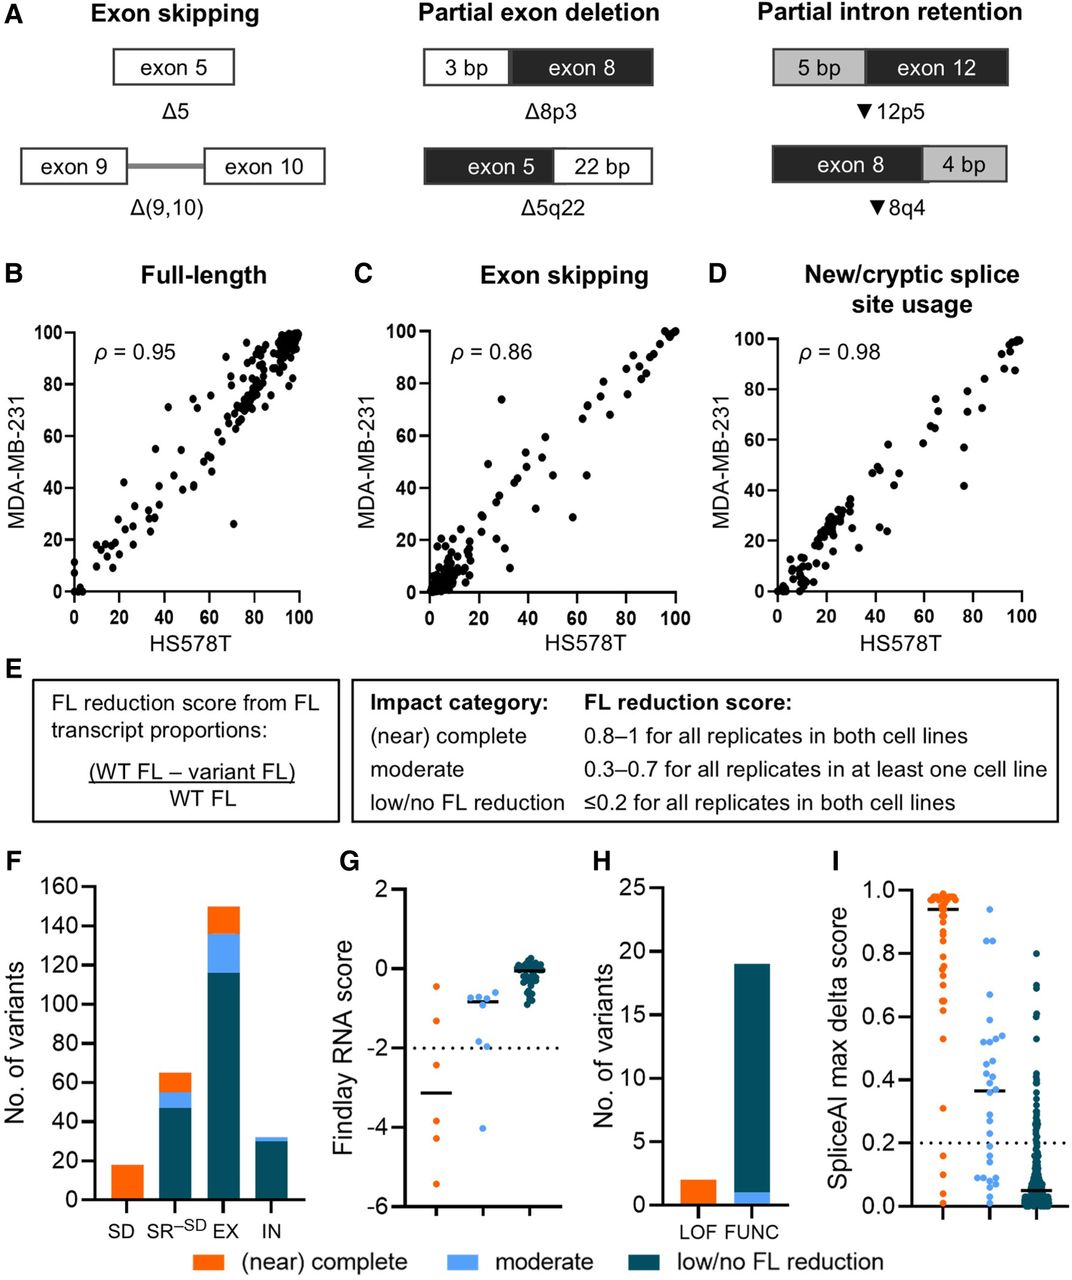
The median FL (Spearman's ρ = 0.95), exon skipping (Spearman's ρ = 0.86), and alternative transcript (Spearman's ρ = 0.98) proportions from variant constructs were highly correlated between the cell lines (Fig. 3B–D). However, measurement variability within and between cell lines was observed for some variant constructs. For example, BRCA1 c.224A>T resulted in expression of Δ6 and [▾6p59,Δ6q79] transcripts in both cell lines, but with differences in relative proportions; HS578T had a higher expression of the alternative transcript resulting from new donor and cryptic acceptor usage (76%) than exon skipping (24%), whereas MDA-MB-231 had a slightly higher exon skipping (49%) than the alternative transcript (42%).
The proportion of BRCA1 Δ10 and BRCA2 Δ2, Δ4, Δ6, and Δ7 produced by the WT constructs in this study may be higher than what would be expected in vivo. Because there was increased background exon skipping for these WT constructs, we did not use the variant-induced isoform levels per se to assign the splicing impact categories. Instead, we took into account the background splicing for the WT construct and normalized the assay results by deriving the FL reduction score (for details, see Methods) (Fig. 3E). We then used the FL reduction score to assign variants to splicing impact categories. We established the quality of SeqSplice results by showing that the splicing impact categories followed the expected trends/results based on (1) variant location; (2) published splicing data from assays using minigenes, whole-gene experimental models, and/or patient-derived RNA; (3) Findlay RNA score and function class for BRCA1 variants; (4) SpliceAI score; and (5) ClinVar variant classification.
Variant impact on splicing and correlation with existing RNA data
Of the 265 variants assayed, 42 (29 in BRCA1, 13 in BRCA2) resulted in complete or near complete splicing impact (defined in this study as FL reduction score 0.8–1, <20% FL transcript proportion), with 18 variants located at the splice donor/acceptor ±1,2 dinucleotide positions (Fig. 3F; Supplemental Table S1). Thirteen presumed missense variants and one synonymous variant, located outside of the acceptor (from the first exonic base to 20 intronic bases upstream of exon) and donor (last three exonic bases to six intronic bases downstream from the exon) splice motifs, also had (near) complete splicing impact (Supplemental Table S1). For variants in the (near) complete impact category, the FL transcript proportion (<20%) is at a level that can confer pathogenicity, provided there is no variant-induced in-frame rescue transcript that increases the level of functional transcripts to ≥20% (de la Hoya et al. 2016).
We searched the literature for published splicing data and found 28 variants from 21 publications with splicing assay results derived from a range of materials (including patient RNA, minigenes with single-exon or multiexon inserts, and experimental models containing the entire BRCA1 or BRCA2 gene) and varying assay methodologies (Supplemental Table S3).
Only eight of 42 variants with (near) complete splicing impact had published splicing assay results (Supplemental Table S3). (Near) complete expression of alternative isoforms was concordant with published data for five variants: BRCA1 c.132C>T (Δ3q4) (Steffensen et al. 2014; Li et al. 2022), BRCA1 c.190T>G (Δ5q22) (Yang et al. 2003), BRCA1 c.4097-2A>G (▾12p1) (Leman et al. 2018), BRCA2 c.572A>G (Δ7q60) (Gaildrat et al. 2012; Fraile-Bethencourt et al. 2019), and BRCA2 c.681+4A>G (▾8q4) (Houdayer et al. 2012; Fraile-Bethencourt et al. 2019).
Of the remaining three variants with (near) complete impact on splicing, apparent differences to published assay results could be ascribed to differences in the experimental designs. For BRCA1 c.442-3T>G, the SeqSplice construct-based quantitative analysis showed complete impact on splicing compared with the reported incomplete impact (splice class 2S) from RT-PCR-based analysis of LCL-derived patient RNA without formal quantitation (Houdayer et al. 2012). For BRCA2 c.632-2A>G, the SeqSplice single-exon construct model could not replicate the Δ4–8, Δ(6q39,7) and Δ(6q39,7,8) transcripts detected using a model containing the entire BRCA2 gene cloned into a bacterial artificial chromosome and expressed in mouse embryonic stem cells (Stauffer et al. 2020). For BRCA1 c.224A>T, the SeqSplice single-exon model demonstrated near complete splicing impact and expression of Δ6 and [▾6p59,Δ6q79] transcripts, whereas a BRCA1 exon 5–7 construct assay (Raponi et al. 2011) showed decreased FL (from 70% to 54%) and increased Δ6 transcript; none of the isoforms detected in the two different construct studies were reported as naturally occurring transcripts, indicating need for careful assessment of experimental design in interpretation of results from different studies.
Of the remaining variants assayed, 30 had moderate splicing impact (five with published RNA data), and 193 had low/no FL reduction (15 with published RNA data) (Supplemental Tables S1, S3). Four of five variants in the moderate splicing impact category (FL reduction score 0.3–0.7) were discordant with published RNA data from minigene studies; of these, three variants had low/no FL reduction in previous studies, and one was previously reported to have (near) complete impact albeit with FL transcript proportion (21%) very close to the moderate threshold (Supplemental Table S3). In contrast, all 15 variants belonging to the low/no FL reduction category and with published RNA data were concordant with previous results (Supplemental Table S3). Overall, results for 75% (21/28) of variants across the three splicing impact categories were concordant with published RNA data. Discordances were generally owing to the single-exon construct design limitation or to the higher sensitivity of the SeqSplice method compared with previous experiments.
Our minigene splicing impact categories were also highly comparable to the results of an assay that measured the effect of BRCA1 variants, introduced via saturation genome editing, on the viability of haploid HAP1 cells (Findlay et al. 2018). The Findlay RNA score, derived from targeted RNA sequencing of cells harboring the BRCA1 variants to determine exonic variant abundance in messenger RNA (Findlay et al. 2018), provides an indirect measure of variant impact on splicing. That is, variants that are spliced out and/or result in out-of-frame transcripts that are sensitive to nonsense-mediated decay (NMD) are expected to be depleted in the messenger RNA, indicated by a low RNA score. The RNA score is not dependent on the proportions of particular transcripts but on the overall abundance of specific variants measured at two time points. There were 57 BRCA1 variants assayed in our study with available RNA scores from the Findlay assay; we found a significant difference in RNA scores (Kruskal–Wallis P < 0.0001) across the (near) complete impact (median, −3.13), moderate impact (median, −0.83), and low/no FL reduction (median, −0.05) categories (Fig. 3G). Of the six variants in the (near) complete impact category, four had RNA scores below −2, which corresponds to >75% depletion of the variants in messenger RNA (Findlay et al. 2018). Except for one variant with moderate impact, all remaining variants in the moderate impact or low/no FL reduction categories had RNA scores greater than or equal to −2. There are no published RNA splicing data against which to compare the transcript profiles of the two (near) complete impact variants (c.5078C>G, RNA score −1.31; c.5429T>G, RNA score −0.45) and the single moderate impact variant (c.5137G>T, RNA score −4.03), which did not follow the expected trend. However, the sequence context of the saturation genome editing experiment could explain the less negative RNA score of c.5429T>G. SpliceAI analysis of c.5429T>G combined with the protospacer adjacent motif (PAM) blocker installed in the same exon (c.5424G>C) predicted a modulatory effect of the blocking variant on the impact of c.5429T>G. The PAM blocker decreased the SpliceAI max delta score from 0.10 to 0.02. In terms of splicing mechanism, we predicted that co-occurrence with the synonymous blocking variant c.5424G>C results in a weaker exonic splicing silencer motif compared with the motif created by the c.5429T>G test variant alone (Supplemental Fig. S6). The weaker silencer motif could result in less exon skipping and a less negative RNA score for the c.5429T>G test variant, contrasting the SeqSplice (near) complete impact finding derived from a construct without any co-occurring variants. However, SpliceAI analysis of c.5078C>G and c.5137G>T in cis with the PAM blocker c.5097G>C in the Findlay experiment demonstrated that the addition of the PAM blocker could not explain the differences in findings between our study and the Findlay study. Lastly, there was 100% concordance between the splicing impact categories and Findlay function class, excluding missense and nonsense variants to avoid confounding protein-level effects (Fig. 3H). Variants with (near) complete impact (n = 2) were classified as loss of function, whereas the variants with moderate impact (n = 1) or low/no FL reduction (n = 18) were classified as functional.
Correlation of splicing impact with predictions, including new/cryptic splice site usage specifically
The assigned minigene splicing impact categories strongly agree with SpliceAI max delta scores, a well-established metric for splicing aberration (Fig. 3I). The distribution of SpliceAI scores were significantly different across the three categories (Kruskal–Wallis P < 0.0001) and followed the expected trend: Variants with (near) complete splicing impact had high SpliceAI max delta scores (median, 0.94); variants with moderate splicing impact had moderate SpliceAI max delta scores (median, 0.37); and variants in the low/no FL reduction category had low SpliceAI max delta scores (median, 0.05).
Variants were originally selected for inclusion in the SeqSplice experiments based on MES-predicted potential to use a new donor or acceptor splice site across three categories (increased, moderate, low/weak/null) (Vallée et al. 2016), but SeqSplice revealed poor correlation with the MES-based predictions of new splice sites specifically (Fig. 4A). This may be because of the relatively short window of analysis (23 bp for acceptor motif and 9 bp for donor motif) used by MES in splice site prediction (Yeo and Burge 2004). We therefore explored the performance of the SpliceAI-10k calculator (SAI-10k-calc), a SpliceAI-based tool that extends the analysis window up to 10,000 bp and can predict the size and type of aberration, including that resulting from new or cryptic splice site usage (Canson et al. 2023). SpliceAI prediction of splicing impact typically relies on the max delta score out of four delta scores for splice site gain/loss, whereas the original SAI-10k-calc uses all four delta scores and their corresponding delta positions to predict the type of aberrant transcript generated by a variant. In the original SAI-10k-calc algorithm, the prediction of partial exon deletion and partial intron retention is based on acceptor/donor gain delta score ≥0.2. In this study, we updated the SAI-10k-calc algorithm by integrating the SpliceAI alternate score for splice site gain (i.e., the final score of new or cryptic splice site after a variant has been incorporated into the reference sequence) to improve prediction of partial exon deletion and partial intron retention. This updated algorithm positively predicts variants that have acceptor/donor gain delta score <0.2 with corresponding acceptor/donor gain alternate score ≥0.9.
New or cryptic splice site prediction. (A) Number of variants that generated alternative transcripts by new or cryptic splice site usage in our minigene splicing assays, categorized according to the original MES-based selection criteria (Vallée et al. 2016). (B) Number of variants with alternative transcript products correctly predicted by the updated SpliceAI-10k calculator (SAI-10k-calc). (C,D) Illustration of cryptic donor or acceptor activation prediction using the SpliceAI alternate scores integrated into the updated SAI-10k-calc algorithm. Variant location is indicated by the star symbol. SpliceAI alternate scores for cryptic (score ALT 1) and native (score ALT 0) splice sites suggested full usage of the cryptic sites, in agreement with SeqSplice results showing complete production of naturally occurring Δ5q22 and Δ8p3 alternative isoforms resulting from BRCA1 c.196A>T and c.442-2A>C, respectively.
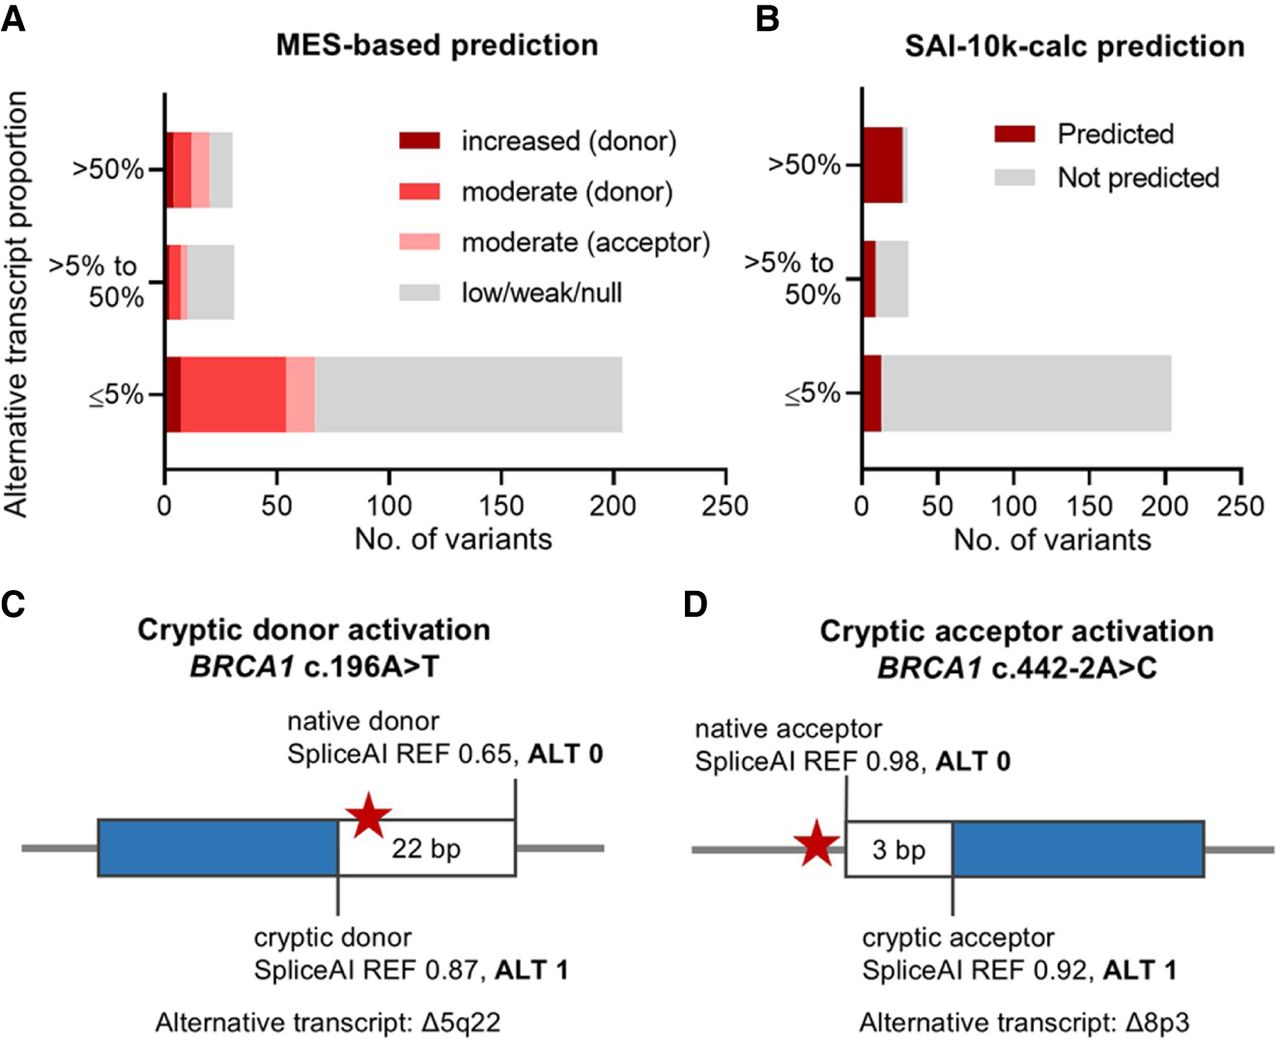
SeqSplice identified 30 variants with major expression (>50% median proportion) of an alternative transcript that used a new or cryptic splice site; 24 of these had (near) complete splicing impact, and six had moderate impact. Incorporating the SpliceAI alternate scores improved the sensitivity of predicting these alternative transcripts from 63% (19/30) to 90% (27/30) for the updated SAI-10k-calc tool (Fig. 4B, Supplemental Tables S1, S4). Representative examples of correct prediction of upregulated alternative isoforms are shown for two variants (Fig. 4C,D). SAI-10k-calc also predicted the minor expression (between 5% and 50% median proportions) of alternative transcripts with 29% (nine of 31) sensitivity (Fig. 4B). Expectedly, 81% (25/31) of the variants producing these minor alternative transcripts had low to moderate impact, and the remaining 19% (six of 31) had (near) complete splicing impact owing to major exon skipping instead of new or cryptic splice site usage. Notably, the updated SAI-10k-calc algorithm showed 94% (191/204) specificity and only 6% (13/204) false-positive predictions for variants producing ≤5% alternative transcripts relative to the baseline level expressed by WT constructs (Fig. 4B).
Variant clinical significance
We found 46% (123/265) of variants assayed were reported in ClinVar (https://www.ncbi.nlm.nih.gov/clinvar/) with clinical significance assertions (Supplemental Table S5). Excluding missense and nonsense variants, distribution across the minigene splicing impact categories was consistent with clinical variant classifications (Fig. 5A). All 18 ClinVar benign/likely benign (B/LB) variants were found in the moderate (n = 1) or low/no FL reduction (n = 17) category, whereas all 10 ClinVar pathogenic/likely pathogenic (P/LP) variants exhibited (near) complete impact. We calculated the likelihood ratio for pathogenicity based on these 18 B/LB and 10 P/LP variants as controls to estimate strength of evidence for our assay results; low/no FL reduction equated to strong evidence against pathogenicity, whereas (near) complete impact equated to strong evidence for pathogenicity (Fig. 5B).
Clinical variant classification. (A) Variants assayed with assigned clinical significance in ClinVar (n = 64) including pathogenic/likely pathogenic (P/LP), conflicting classifications of pathogenicity, uncertain significance (VUS), and benign/likely benign (B/LB). Nonsense and missense variants were excluded. (B) Estimation of likelihood ratio for pathogenicity for each splicing impact category based on 10 P/LP and 18 B/LB control variants from ClinVar. (C) Synonymous and intronic variants (n = 90) that resulted in low/no FL reduction can be assigned with BP7_Strong (RNA) code under the ACMG/AMP framework of variant classification (Walker et al. 2023).
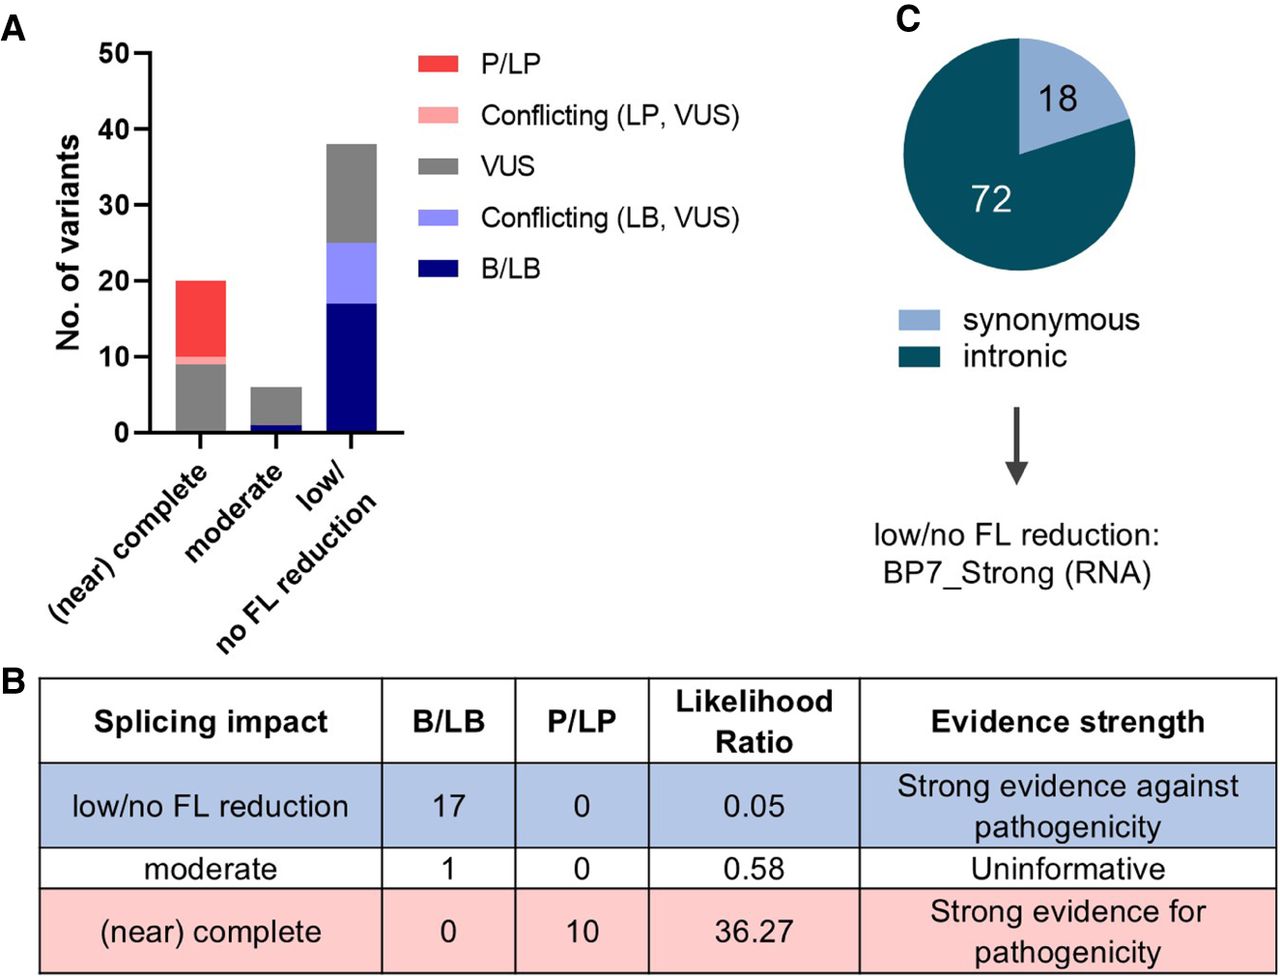
In addition to the likelihood ratio estimation equating to strong evidence against pathogenicity, the excellent agreement of our results for variants in the low/no FL reduction category with published splicing data provide confidence that this minigene-derived information may be used to assign an ACMG/AMP benign code for variants with no existing splicing data. Of the 265 variants assayed, a total of 90 intronic or synonymous variants with low/no FL reduction could be assigned with BP7_Strong (RNA) code (Fig. 5C), following the recommendation from the ClinGen Sequence Variant Interpretation Splicing Subgroup (Walker et al. 2023). Of these, one was already reported as benign and 16 as likely benign (15 without use of publicly available splicing data), whereas another 13 were VUS or with conflicting classifications in ClinVar.
For the 42 variants with (near) complete splicing impact, the information about transcript frame can also aid variant assessment, after appropriate consideration of location of in-frame insertions or deletions relative to functional domains (e.g., upregulation of the in-frame Δ8p3 isoform not affecting clinically relevant domains), as well as possible expression of in-frame rescue transcripts not captured by the single-exon construct design (e.g., in-frame BRCA1 Δ9,10 [de la Hoya et al. 2016] and BRCA2 Δ4,5 and Δ4–7 rescue transcripts [Mesman et al. 2020; Nix et al. 2022]). Results for 22 BRCA1 and three BRCA2 variants leading to (near) complete impact fall outside regions that naturally undergo alternative splicing across multiple exons, and are high priority for review in the context of variant pathogenicity assessment.
Discussion
We present SeqSplice, a high-throughput minigene splicing assay using a barcode approach that enabled simultaneous quantitative characterization of 1269 samples representing 283 unique minigene constructs expressed in two different cell lines. SeqSplice provided splicing impact results for 265 BRCA1 and BRCA2 variants. Comparing to existing patient-derived and construct data showed overall good correlation for variants with either no or (near) complete impact on splicing. We have noted and highlight the limitations of single test exon construct design in relation to detecting naturally occurring multiexon skipping events in BRCA1 and BRCA2 and, therefore, advise consideration of naturally occurring splicing events before use of (near) complete splicing impact data from any construct-based study as evidence towards pathogenicity.
The majority of results are largely similar between the two cell lines. However, some variants did exhibit a difference between HS578T and MDA-MB-231 breast cancer cells, possibly because of differences in the expression and activity of splicing factors. In this regard, one particular benefit of our SeqSplice method is its cost-effectiveness and scalability, which makes the assay using two (or more) different cell lines relatively easy. From an experimental design perspective, this method is valuable for three reasons: (1) it gives a detailed characterization of variant-induced transcripts in a high-throughput manner;, (2) it provides additional replicates, which assists in identifying technical artifacts or errors; and (3) when differences between the cell lines are observed, it highlights that splicing networks can be different and can inform follow-up studies when those variants are investigated in primary patient samples. This method could be applied usefully to other genes, perhaps even more relevant to those not expressed in accessible patient tissue and for which an appropriate cell model is available.
As in other high-throughput methods such as massively parallel splicing assay (MaPSy) (Soemedi et al. 2017), variant exon sequencing (Vex-seq) (Adamson et al. 2018), and multiplexed functional assay of splicing using Sort-seq (MFASS) (Chong et al. 2019), the SeqSplice method measured variant effect on a single exon but presented additional advantages in that it could test intronic and exonic variants for their effect on exon skipping and alternative splice site usage. Although MaPSy measured these splicing effects for exonic variants only, Vex-seq and MFASS tested intronic and exonic variants but only measured exon skipping/inclusion. The SeqSplice barcoding approach, which was also applied in Vex-seq, enabled the identification of test exons with or without our variants of interest, as well as the association of transcripts lacking the test exon with the construct of origin. Compared with the aforementioned methods, our minigene constructs also incorporated longer flanking intronic sequences, enabling capture of additional splicing signals that could influence splice site recognition.
The SeqSplice method was sensitive to detect splice-altering variants irrespective of the produced specific aberrant transcript. Therefore, SeqSplice results can be used as positive and negative controls for training or benchmarking bioinformatic tools for categorical prediction of splice-altering variants versus no splicing impact, without considering the specific aberration types. Alternative splice site usage is not as well predicted as native splice site abrogation by currently available tools. Importantly, we found additional BRCA1 and BRCA2 variants that resulted in new splice site creation or cryptic splice site activation, increasing the pool of these types of variants in data sets used for improving the performance or application of splicing prediction tools. SpliceVault (Dawes et al. 2023), a web portal of quantified naturally occurring (multi-)exon skipping and cryptic activation events, can provide a list of cryptic splice sites more likely to be activated when the native splice site is abrogated owing to variants in the splice region, but cannot be used to predict variants that create new splice sites. For example, BRCA1 c.4097-2A>G creates a new acceptor one base upstream of the native acceptor resulting in ▾12p1 transcript, as shown in splicing assays using minigene (this study) and patient RNA (Leman et al. 2018), but this ▾12p1 splicing event is absent in SpliceVault.
Recent splicing prediction tools developed using artificial intelligence methods, for example, SpliceAI (Jaganathan et al. 2019) and Pangolin (Zeng and Li 2022), can predict splice site gain/loss from DNA sequence but not its consequent aberrant transcript. We previously developed SAI-10k-calc (Canson et al. 2023) that interprets the SpliceAI delta scores and delta positions to predict specific types and sizes of aberration. By integrating the SpliceAI alternate score in the updated SAI-10k-calc algorithm implemented in this study, we demonstrated accurate prediction of transcripts for 90% of variants producing >50% alternative transcript proportion. The batch processing feature of SAI-10k-calc is an improvement over SpliceAI-visual (de Sainte Agathe et al. 2023) that uses the SpliceAI reference and alternate scores to interpret the SpliceAI-predicted impact for a single variant at a time. However, SAI-10k-calc prediction remains limited by the SpliceAI analysis window of up to 10 kb, preventing capture of splice site pair usage outside of this window. That is, SAI-10k-calc is less likely to predict transcripts with large deletions spanning multiple exons. Moreover, the prediction of aberrant transcripts in regions that undergo extensive natural alternative splicing either by (multi-)exon skipping or cryptic splice site usage remains a challenge, especially if there are in-frame transcript rescue mechanisms in place.
In the same way, the utility of minigene constructs is limited to the size of genomic region inserted into the vector. Advances over the past several years have resulted in significant improvements in the efficiency and scale of synthetic DNA oligonucleotide manufacture and opens up the possibility to investigate exon sequences and variant-induced transcripts much larger than those used in this study. For example, Integrated DNA Technologies can synthesize 200 bp “Ultramer” oligos easily and cost-effectively, and larger size constructs (i.e., 201–2000 bp) can be ordered as “Megamers.” Thus, virtually all BRCA1/2 exons can be synthesized except for exon 11 of BRCA1 (3426 bp) or BRCA2 (4932 bp). In cases in which some exons are difficult to synthesize, traditional cloning methods may be required to create custom constructs. However, analysis of the inserted sequence is constrained by the RNA sequencing method applied to characterize the transcripts. Although minigenes with multiexon inserts can provide a more accurate characterization of variant-induced transcripts, advances in sequencing approaches, for example, long-read sequencing, will be necessary to enable high-throughput RNA analysis of such constructs.
Owing to the artificial nature of minigene construct-based assays, there are caveats to the clinical applicability of assay results derived using this method. However, there remains a role for minigene assays to provide information needed for variant classification, including as a supplement to assay results from patient-derived material. The value of minigene assays is primarily based on their capacity to measure allele-specific splicing impact. Importantly, quantification of allele-specific splicing impact of intronic variants rely on the presence of exonic tag variant in the patient DNA, a situation not always realized. The use of splicing assay data from patient-derived RNA versus minigene construct has been recognized in the ClinGen BRCA1 and BRCA2 Variant Curation Expert Panel (VCEP) specifications of ACMG/AMP criteria for classification of variants in these genes, with different strengths of evidence provided depending on source material and quantitative measures (Parsons et al. 2024; https://cspec.genome.network/cspec/ui/svi/affiliation/50087). A similar approach is also considered by the InSiGHT Hereditary Colorectal Cancer/Polyposis VCEP for the classification of variants in mismatch repair genes (https://cspec.genome.network/cspec/ui/svi/affiliation/50099).
For any minigene assay method, understanding the study design and the detectable types and levels of splicing aberration is imperative when interpreting assay results. Output comparison with existing RNA or splicing data, preferably from patient material, is important in establishing confidence in the assay method. The comparison should take into account factors that explain apparent differences. For example, expression of splicing factors may vary between cell lines, leading to an observation of different splicing patterns. It is also possible for common variant(s) in patient samples to modify the splicing pattern and cause conflicting results to those from minigene assays. Technical differences in RNA isolation protocols, use of NMD inhibitor, DNA primers, PCR product sizes, thermocycling conditions, quantification methods, and sequencing read assembly parameters can also contribute to differences in splicing profiles. For some minigenes with a single test exon such as the pSPL3 constructs used in this study, the transcript product may not include an open reading frame or not be long enough to trigger NMD. Whereas for multiexon constructs, the presence or absence of NMD inhibitor can modify the relative proportions of transcripts (Acedo et al. 2015). In some cases, the WT construct may not recapitulate the normal splicing pattern in the tissue of interest, or the positive control variant with known splicing impact may not produce the expected splicing profile. Whether the assay uses single-exon or multiexon constructs and regardless of the produced splicing pattern, evidence of any splicing disruption caused by the test variant at a level that confers pathogenicity is sufficient to prevent the use of the BP7_Strong (RNA) code. On the other hand, for assays validated against results from patient material, the BP7_Strong (RNA) code can be applied to intronic and synonymous variants outside the splice region that clearly show no splicing impact.
In conclusion, SeqSplice enabled reproducible identification and quantitation of variant-induced BRCA1 and BRCA2 transcripts; this method can also be adapted to other genes. SeqSplice generated a data set enriched for variants that create new splice sites or activate cryptic splice sites. This data set was used in improving the SAI-10k-calc prediction for partial exon deletion and partial intron retention. In terms of clinical variant classification, our findings show that construct design and naturally occurring splice isoform patterns are key factors to be considered before assigning variant classification evidence weights. However, construct-based results indicating no variant-induced impact on splicing correlate extremely well with those from patient-derived material and can provide reliable evidence against variant pathogenicity. Overall, our results provide valuable data to inform evaluation and use of construct-derived data for clinical variant classification.
Methods
Variant selection and construct design
BRCA1 and BRCA2 exons up to 120 bp in size that allow for paired-end sequencing reads to overlap were considered for inclusion in this study. Exonic variants and intronic variants within 25 bp upstream of and downstream from exons were selected across three categories (increased, moderate, low/weak/null) of new donor and new acceptor site creation according to published parameters (Vallée et al. 2016). After exclusion of data following quality-control filters (see section Bioinformatics Pipeline below), 265 variants remained for analyses.
WT and variant minigene constructs were synthesized by GenScript. Each selected exon plus 150 bp of flanking intron before and after the exon were cloned into the pSPL3 exon trapping vector (Invitrogen). For BRCA2 exon 6, the full 91-bp intron 5 sequence was included in the construct. Variants of interest were then introduced into the appropriate WT constructs via mutagenesis (GenScript). We used the pSPL3 vector because previous validation experiments of BRCA1 variants showed 100% concordance between the pSPL3 minigene (single test exon) assay results with those from RNA from blood samples/lymphoblastoid cell lines (Steffensen et al. 2014).
Cell culture and transfection
Two breast cancer cell lines, HS578T and MDA-MB-231, were grown and maintained using Dulbecco's Modified Eagle Medium (DMEM) supplemented with 10% fetal bovine serum and 0.01 mg/mL insulin, and DMEM with 10% fetal bovine serum, respectively. Cells were plated in 24-well plates and constructs were transfected after 24 h using Lipofectamine 2000 (Invitrogen). The peGFP-n1 plasmid was transfected in one well per 24-well plate, and GFP was measured by flow cytometry analysis to assess transfection efficiency. An empty-pSPL3 well and Lipofectamine-only well were also included in each 24-well plate as sequencing controls. There were four to 20 replicates per WT construct and two to 10 replicates per variant construct, except for two variants that had one measurement each that passed the quality-control step.
Total RNA was extracted 24 h post-transfection using NucleoSpin 96 RNA kit (Macherey Nagel) by the manufacturer's protocol, including DNase treatment. cDNA was synthesized from RNA using SuperScript III first-strand synthesis system according to the manufacturer's protocol. cDNA products were amplified by 18-cycle PCR using vector-specific forward (TCTGAGTCACCTGGACAACC) and reverse (ATTGGTCGAAATGGATCTGTC) primers, which were modified to include a barcode tag sequence. This 18-cycle PCR was followed by a five-cycle barcoding PCR using 5 µL of product from the amplification PCR as a template and the single-direction Access Array Barcode Library for Illumina Sequencers (Illumina) as the primers. Samples from 2 × 96-well plates were pooled and sequenced using a 150–bp paired-end kit on a MiSeq (Illumina). PhiX was spiked in each sequencing run to increase sequence diversity.
Bioinformatics pipeline
A custom bioinformatics package (SeqSplice) was created to analyze the MiSeq output files. This includes a combination of freely available software bundled with custom scripts into a Docker container. For a detailed description of this package and its associated steps, refer to the Supplemental File. Utilizing a Docker container preserved the compatibility of the programs and scripts with this type of data. Read counts for pSPL3 cryptic exon and PhiX were removed from each barcoded well before calculating the proportions of each transcript sequenced. Each barcoded well with fewer than 1000 total reads was excluded.
Transcript nomenclature
Transcripts were described using shorthand nomenclature, with deletion indicated by the Δ symbol and partial intron retention indicated by ▾ symbol. Deletions or retentions at the 3′ end and 5′ end of exons were indicated by “p” and “q,” respectively. Numbers after “p” and “q” indicated the size (in base pairs) of partial deletion/retention. The corresponding RNA nomenclature was based on NM_007294.4 (BRCA1) and NM_000059.4 (BRCA2) transcripts, as listed in Supplemental Table S6. Legacy exon numbering was used for BRCA1 (GenBank ID U14680.1). Transcript proportions were reported as median values with range of measurements. Variants were considered to induce new or cryptic splice site usage if the alternative transcript proportion was >5% relative to the WT in at least one replicate. For variants in BRCA1 exons 5 and 8, the baseline was the highest proportion of naturally occurring Δ5q22 and Δ8p3 alternative isoforms expressed by the WT constructs.
Splicing impact categories and estimation of likelihood ratio for pathogenicity
For each variant replicate, the reduction of FL transcript was scored by using the formula “(WT FL − variant FL)/WT FL proportion,” with values rounded up. Variants were then categorized based on the FL reduction score: (near) complete splicing impact (score 0.8–1 for all replicates in both cell lines), moderate splicing impact (score 0.3–0.7 for all replicates in at least one cell line), and low/no FL reduction (score ≤0.2 for all replicates in both cell lines). The last category included variants that increased the FL transcript. A FL reduction score of one indicated complete splicing impact, that is, 100% FL reduction or no FL transcript generated by the variant.
The likelihood ratio for pathogenicity associated with each splicing impact category was estimated based on 18 B/LB synonymous or intronic variants and 10 P/LP variants from ClinVar using a previously published method (O'Mahony et al. 2023), by comparing the respective proportion between P/LP variants against B/LB variants. Each likelihood ratio was then equated with an evidence strength category according to the Bayesian framework of the ACMG/AMP variant classification guidelines (Tavtigian et al. 2018).
Splicing prediction tools
Variants were categorized for predicted splicing impact by new splice site usage as per original report by Vallée et al. (2016). Briefly, MES (Yeo and Burge 2004) scores were normalized into a Z-score and categorized as follows: low/weak/null Z < −2, moderate −2 ≥ Z > 0, and increased Z > 0.
SpliceAI v1.3.1 (Jaganathan et al. 2019) delta, reference, and alternate scores were obtained using the updated SpliceAI code (https://github.com/bw2/SpliceAI), run in a high performance computing cluster with the following parameters: GRCh38 genome assembly, 4999 distance, and not masked. The SpliceAI variant call format output file was inputted into the SpliceAI-10k calculator (Canson et al. 2023) to predict the types of splicing aberration generated by the variants; the algorithm of this calculator (https://github.com/adavi4/SAI-10k-calc; https://miro.com/app/board/uXjVPD0nK64=/) was modified to incorporate SpliceAI alternate scores (this study). SpliceAI analysis of BRCA1 variants in cis with PAM blockers in the Findlay assay (c.5078C>G with c.5097G>C, c.5137G>T with c.5097G>C, and c.5429T>G with c.5424G>C) was done using the script for custom sequence described at GitHub (https://github.com/Illumina/SpliceAI), and an input containing the BRCA1 exon 18 or exon 23 sequence ±5000 bp. Variant effect on exonic splicing regulatory elements was predicted using HEXplorer (Erkelenz et al. 2014).
Software availability
The SeqSplice bioinformatics workflow, software used, and all custom scripts are freely available at https://bitbucket.org/reseq/workspace/repositories/ and https://hub.docker.com/r/reseq/reseq. The Bitbucket repository contains all custom bash and Python scripts used in the characterization and quantitation of splice isoforms. The Docker repository bundles all necessary software needed for analysis (i.e., Trinity, SAMtools) together with the custom bash and Python scripts in the Bitbucket repository; after installation of the Docker package on any standard Linux machine, the complete workflow can immediately be used without downloading or installing any other software or scripts. The Docker repository also comes with a small set of sequencing data to allow users to verify the pipeline. The SAI-10k-calc R code is available at GitHub (https://github.com/adavi4/SAI-10k-calc); bash scripts and files used for splicing prediction can be accessed at GitHub (https://github.com/MolecularCancerEpidemiologyLab/BRCA_Constructs). All custom scripts are also provided as Supplemental Code.
Data access
The raw sequencing data generated in this study have been submitted to the NCBI BioProject database (https://www.ncbi.nlm.nih.gov/bioproject/) under accession number PRJNA1224533.
Competing interest statement
The authors declare no competing interests.
Acknowledgments
The laboratory work for this project was funded by a National Health and Medical Research Council (NHMRC) grant (APP 1010719). A.B.S., D.M.C., and M.T.P. were supported by NHMRC funding (APP 1177524). The work of A.B.S. and A.L.D. was also supported in part by National Institutes of Health (NIH) grant R01 CA264971. The work of M.T.P. was also supported in part by NIH grant U24 5U24CA258058-02. Salary support for G.M. was provided by a PhD mobility grant from Fundació Montcelimar—Universitat de Barcelona. Salary support for D.K. was provided by the National Breast Cancer Foundation (CG-12-07). D.K. was also funded as a National Breast Cancer Foundation Research Fellow (IIRS-22-060) during the writing and analysis of the manuscript. We thank Melissa Brown for her role in initial study design and Logan C. Walker for his valuable input regarding the interpretation of splicing assay results for clinical use.
Author contributions: Conceptualization was done by D.M.C., M.T.P., D.K., and A.B.S. Data curation was done by D.M.C., M.T.P., G.M.-M., T.D., G.M., and T.P.M. Formal analysis was done by D.M.C. and D.K. Funding acquisition was done by M.T. and A.B.S. Investigation was done by M.T.P., G.M.-M., T.D., G.M., E.L., and D.K. Methodology was done by D.M.C., M.T.P., G.M.-M., and D.K. Software was by A.L.D., S.M.B., and D.K. Supervision was done by A.B.S. Visualization was done by D.M.C. and D.K. Writing of the original draft was done by D.M.C., M.T.P., and D.K. Reviewing and editing were done by all authors.
Notes
[1] Supplementary material [Supplemental material is available for this article.]
[2] Article published online before print. Article, supplemental material, and publication date are at https://www.genome.org/cgi/doi/10.1101/gr.279557.124.
References
- ↵Acedo A, Hernández-Moro C, Curiel-García Á, Díez-Gómez B, Velasco EA. 2015. Functional classification of BRCA2 DNA variants by splicing assays in a large minigene with 9 exons. Hum Mutat 36: 210–221. 10.1002/humu.22725
- ↵Adamson SI, Zhan L, Graveley BR. 2018. Vex-seq: high-throughput identification of the impact of genetic variation on pre-mRNA splicing efficiency. Genome Biol 19: 71. 10.1186/s13059-018-1437-x
- ↵Anna A, Monika G. 2018. Splicing mutations in human genetic disorders: examples, detection, and confirmation. J Appl Genet 59: 253–268. 10.1007/s13353-018-0444-7
- ↵Bournazos AM, Riley LG, Bommireddipalli S, Ades L, Akesson LS, Al-Shinnag M, Alexander SI, Archibald AD, Balasubramaniam S, Berman Y, 2022. Standardized practices for RNA diagnostics using clinically accessible specimens reclassifies 75% of putative splicing variants. Genet Med 24: 130–145. 10.1016/j.gim.2021.09.001
- ↵Canson DM, Davidson AL, de la Hoya M, Parsons MT, Glubb DM, Kondrashova O, Spurdle AB. 2023. SpliceAI-10k calculator for the prediction of pseudoexonization, intron retention, and exon deletion. Bioinformatics 39: btad179. 10.1093/bioinformatics/btad179
- ↵Cartegni L, Wang J, Zhu Z, Zhang MQ, Krainer AR. 2003. ESEfinder: a web resource to identify exonic splicing enhancers. Nucleic Acids Res 31: 3568–3571. 10.1093/nar/gkg616
- ↵Casadei S, Gulsuner S, Shirts BH, Mandell JB, Kortbawi HM, Norquist BS, Swisher EM, Lee MK, Goldberg Y, O'Connor R, 2019. Characterization of splice-altering mutations in inherited predisposition to cancer. Proc Natl Acad Sci 116: 26798–26807. 10.1073/pnas.1915608116
- ↵Cheng J, Nguyen TYD, Cygan KJ, Çelik MH, Fairbrother WG, Avsec ž, Gagneur J. 2019. MMSplice: modular modeling improves the predictions of genetic variant effects on splicing. Genome Biol 20: 48. 10.1186/s13059-019-1653-z
- ↵Chong R, Insigne KD, Yao D, Burghard CP, Wang J, Hsiao Y-HE, Jones EM, Goodman DB, Xiao X, Kosuri S. 2019. A multiplexed assay for exon recognition reveals that an unappreciated fraction of rare genetic variants cause large-effect splicing disruptions. Mol Cell 73: 183–194.e8. 10.1016/j.molcel.2018.10.037
- ↵Colombo M, Blok MJ, Whiley P, Santamariña M, Gutiérrez-Enríquez S, Romero A, Garre P, Becker A, Smith LD, De Vecchi G, 2014. Comprehensive annotation of splice junctions supports pervasive alternative splicing at the BRCA1 locus: a report from the ENIGMA consortium. Hum Mol Genet 23: 3666–3680. 10.1093/hmg/ddu075
- ↵Cooper TA. 2005. Use of minigene systems to dissect alternative splicing elements. Methods 37: 331–340. 10.1016/j.ymeth.2005.07.015
- ↵Dawes R, Bournazos AM, Bryen SJ, Bommireddipalli S, Marchant RG, Joshi H, Cooper ST. 2023. SpliceVault predicts the precise nature of variant-associated mis-splicing. Nat Genet 55: 324–332. 10.1038/s41588-022-01293-8
- ↵de la Hoya M, Soukarieh O, López-Perolio I, Vega A, Walker LC, van Ierland Y, Baralle D, Santamariña M, Lattimore V, Wijnen J, 2016. Combined genetic and splicing analysis of BRCA1 c.[594-2A>C; 641A>G] highlights the relevance of naturally occurring in-frame transcripts for developing disease gene variant classification algorithms. Hum Mol Genet 25: 2256–2268. 10.1093/hmg/ddw094
- ↵de Sainte Agathe J-M, Filser M, Isidor B, Besnard T, Gueguen P, Perrin A, Van Goethem C, Verebi C, Masingue M, Rendu J, 2023. SpliceAI-visual: a free online tool to improve SpliceAI splicing variant interpretation. Hum Genomics 17: 7. 10.1186/s40246-023-00451-1
- ↵Erkelenz S, Theiss S, Otte M, Widera M, Peter JO, Schaal H. 2014. Genomic HEXploring allows landscaping of novel potential splicing regulatory elements. Nucleic Acids Res 42: 10681–10697. 10.1093/nar/gku736
- ↵Fackenthal JD, Yoshimatsu T, Zhang B, de Garibay G, Colombo M, De Vecchi G, Ayoub SC, Lal K, Olopade OI, Vega A, 2016. Naturally occurring BRCA2 alternative mRNA splicing events in clinically relevant samples. J Med Genet 53: 548–558. 10.1136/jmedgenet-2015-103570
- ↵Findlay GM, Daza RM, Martin B, Zhang MD, Leith AP, Gasperini M, Janizek JD, Huang X, Starita LM, Shendure J. 2018. Accurate classification of BRCA1 variants with saturation genome editing. Nature 562: 217–222. 10.1038/s41586-018-0461-z
- ↵Fraile-Bethencourt E, Valenzuela-Palomo A, Díez-Gómez B, Goina E, Acedo A, Buratti E, Velasco EA. 2019. Mis-splicing in breast cancer: identification of pathogenic BRCA2 variants by systematic minigene assays. J Pathol 248: 409–420. 10.1002/path.5268
- ↵Gaildrat P, Killian A, Martins A, Tournier I, Frébourg T, Tosi M. 2010. Use of splicing reporter minigene assay to evaluate the effect on splicing of unclassified genetic variants. In Cancer susceptibility: methods and protocols (ed. Webb M), Vol. 653, pp. 249–257. Humana Press, Totowa, NJ. 10.1007/978-1-60761-759-4_15
- ↵Gaildrat P, Krieger S, Di Giacomo D, Abdat J, Révillion F, Caputo S, Vaur D, Jamard E, Bohers E, Ledemeney D, 2012. Multiple sequence variants of BRCA2 exon 7 alter splicing regulation. J Med Genet 49: 609–617. 10.1136/jmedgenet-2012-100965
- ↵Grabherr MG, Haas BJ, Yassour M, Levin JZ, Thompson DA, Amit I, Adiconis X, Fan L, Raychowdhury R, Zeng Q, 2011. Full-length transcriptome assembly from RNA-Seq data without a reference genome. Nat Biotechnol 29: 644–652. 10.1038/nbt.1883
- ↵Houdayer C, Caux-Moncoutier V, Krieger S, Barrois M, Bonnet F, Bourdon V, Bronner M, Buisson M, Coulet F, Gaildrat P, 2012. Guidelines for splicing analysis in molecular diagnosis derived from a set of 327 combined in silico/in vitro studies on BRCA1 and BRCA2 variants. Hum Mutat 33: 1228–1238. 10.1002/humu.22101
- ↵Jaganathan K, Kyriazopoulou Panagiotopoulou S, McRae JF, Darbandi SF, Knowles D, Li YI, Kosmicki JA, Arbelaez J, Cui W, Schwartz GB, 2019. Predicting splicing from primary sequence with deep learning. Cell 176: 535–548.e24. 10.1016/j.cell.2018.12.015
- ↵Leman R, Gaildrat P, Le Gac G, Ka C, Fichou Y, Audrezet M-P, Caux-Moncoutier V, Caputo SM, Boutry-Kryza N, Léone M, 2018. Novel diagnostic tool for prediction of variant spliceogenicity derived from a set of 395 combined in silico/in vitro studies: an international collaborative effort. Nucleic Acids Res 46: 7913–7923. 10.1093/nar/gky372
- ↵Leman R, Parfait B, Vidaud D, Girodon E, Pacot L, Le Gac G, Ka C, Ferec C, Fichou Y, Quesnelle C, 2022. SPip: splicing prediction pipeline, a machine learning tool for massive detection of exonic and intronic variant effects on mRNA splicing. Hum Mutat 43: 2308–2323. 10.1002/humu.24491
- ↵Li J, Wang P, Zhang C, Han S, Xiao H, Liu Z, Wang X, Liu W, Wei B, Ma J, 2022. Characterization of synonymous BRCA1:c.132C>T as a pathogenic variant. Front Oncol 11: 812656. 10.3389/fonc.2021.812656
- ↵Mesman RLS, Calléja FMGR, de la Hoya M, Devilee P, van Asperen CJ, Vrieling H, Vreeswijk MPG. 2020. Alternative mRNA splicing can attenuate the pathogenicity of presumed loss-of-function variants in BRCA2. Genet Med 22: 1355–1365. 10.1038/s41436-020-0814-5
- ↵Monger S, Troup M, Ip E, Dunwoodie SL, Giannoulatou E. 2019. Spliceogen: an integrative, scalable tool for the discovery of splice-altering variants. Bioinformatics 35: 4405–4407. 10.1093/bioinformatics/btz263
- ↵Mukherjee S, Huntemann M, Ivanova N, Kyrpides NC, Pati A. 2015. Large-scale contamination of microbial isolate genomes by Illumina PhiX control. Stand Genomic Sci 10: 18. 10.1186/1944-3277-10-18
- ↵Nix P, Mundt E, Coffee B, Goossen E, Warf BM, Brown K, Bowles K, Roa B. 2022. Interpretation of BRCA2 splicing variants: a case series of challenging variant interpretations and the importance of functional RNA analysis. Fam Cancer 21: 7–19. 10.1007/s10689-020-00224-y
- ↵O'Mahony DG, Ramus SJ, Southey MC, Meagher NS, Hadjisavvas A, John EM, Hamann U, Imyanitov EN, Andrulis IL, Sharma P, 2023. Ovarian cancer pathology characteristics as predictors of variant pathogenicity in BRCA1 and BRCA2. Br J Cancer 128: 2283–2294. 10.1038/s41416-023-02263-5
- ↵Parsons MT, de la Hoya M, Richardson ME, Tudini E, Anderson M, Berkofsky-Fessler W, Caputo SM, Chan RC, Cline MS, Feng B-J, 2024. Evidence-based recommendations for gene-specific ACMG/AMP variant classification from the ClinGen ENIGMA BRCA1 and BRCA2 variant curation expert panel. Am J Hum Genet 111: 2044–2058. 10.1016/j.ajhg.2024.07.013
- ↵Raponi M, Kralovicova J, Copson E, Divina P, Eccles D, Johnson P, Baralle D, Vorechovsky I. 2011. Prediction of single-nucleotide substitutions that result in exon skipping: identification of a splicing silencer in BRCA1 exon 6. Hum Mutat 32: 436–444. 10.1002/humu.21458
- ↵Richards S, Aziz N, Bale S, Bick D, Das S, Gastier-Foster J, Grody WW, Hegde M, Lyon E, Spector E, 2015. Standards and guidelines for the interpretation of sequence variants: a joint consensus recommendation of the American College of Medical Genetics and Genomics and the Association for Molecular Pathology. Genet Med 17: 405–423. 10.1038/gim.2015.30
- ↵Scotti MM, Swanson MS. 2016. RNA mis-splicing in disease. Nat Rev Genet 17: 19–32. 10.1038/nrg.2015.3
- ↵Signal B, Gloss BS, Dinger ME, Mercer TR. 2018. Machine learning annotation of human branchpoints. Bioinformatics 34: 920–927. 10.1093/bioinformatics/btx688
- ↵Soemedi R, Cygan KJ, Rhine CL, Wang J, Bulacan C, Yang J, Bayrak-Toydemir P, McDonald J, Fairbrother WG. 2017. Pathogenic variants that alter protein code often disrupt splicing. Nat Genet 49: 848–855. 10.1038/ng.3837
- ↵Stauffer S, Biswas K, Sharan SK. 2020. Bypass of premature stop codons and generation of functional BRCA2 by exon skipping. J Hum Genet 65: 805–809. 10.1038/s10038-020-0768-0
- ↵Steffensen AY, Dandanell M, Jønson L, Ejlertsen B, Gerdes A-M, Nielsen FC, Hansen T. 2014. Functional characterization of BRCA1 gene variants by mini-gene splicing assay. Eur J Hum Genet 22: 1362–1368. 10.1038/ejhg.2014.40
- ↵Sullivan PJ, Gayevskiy V, Davis RL, Wong M, Mayoh C, Mallawaarachchi A, Hort Y, McCabe MJ, Beecroft S, Jackson MR, 2023. Introme accurately predicts the impact of coding and noncoding variants on gene splicing, with clinical applications. Genome Biol 24: 118. 10.1186/s13059-023-02936-7
- ↵Tavtigian SV, Greenblatt MS, Harrison SM, Nussbaum RL, Prabhu SA, Boucher KM, Biesecker LG. 2018. Modeling the ACMG/AMP variant classification guidelines as a Bayesian classification framework. Genet Med 20: 1054–1060. 10.1038/gim.2017.210
- ↵Vallée MP, Di Sera TL, Nix DA, Paquette AM, Parsons MT, Bell R, Hoffman A, Hogervorst FBL, Goldgar DE, Spurdle AB, 2016. Adding in silico assessment of potential splice aberration to the integrated evaluation of BRCA gene unclassified variants. Hum Mutat 37: 627–639. 10.1002/humu.22973
- ↵Wai HA, Lord J, Lyon M, Gunning A, Kelly H, Cibin P, Seaby EG, Spiers-Fitzgerald K, Lye J, Ellard S, 2020. Blood RNA analysis can increase clinical diagnostic rate and resolve variants of uncertain significance. Genet Med 22: 1005–1014. 10.1038/s41436-020-0766-9
- ↵Walker LC, Hoya M, Wiggins GAR, Lindy A, Vincent LM, Parsons MT, Canson DM, Bis-Brewer D, Cass A, Tchourbanov A, 2023. Using the ACMG/AMP framework to capture evidence related to predicted and observed impact on splicing: recommendations from the ClinGen SVI splicing subgroup. Am J Hum Genet 110: 1046–1067. 10.1016/j.ajhg.2023.06.002
- ↵Yang Y, Swaminathan S, Martin BK, Sharan SK. 2003. Aberrant splicing induced by missense mutations in BRCA1: clues from a humanized mouse model. Hum Mol Genet 12: 2121–2131. 10.1093/hmg/ddg222
- ↵Yeo G, Burge CB. 2004. Maximum entropy modeling of short sequence motifs with applications to RNA splicing signals. J Comput Biol 11: 377–394. 10.1089/1066527041410418
- ↵Zeng T, Li YI. 2022. Predicting RNA splicing from DNA sequence using Pangolin. Genome Biol 23: 103. 10.1186/s13059-022-02664-4