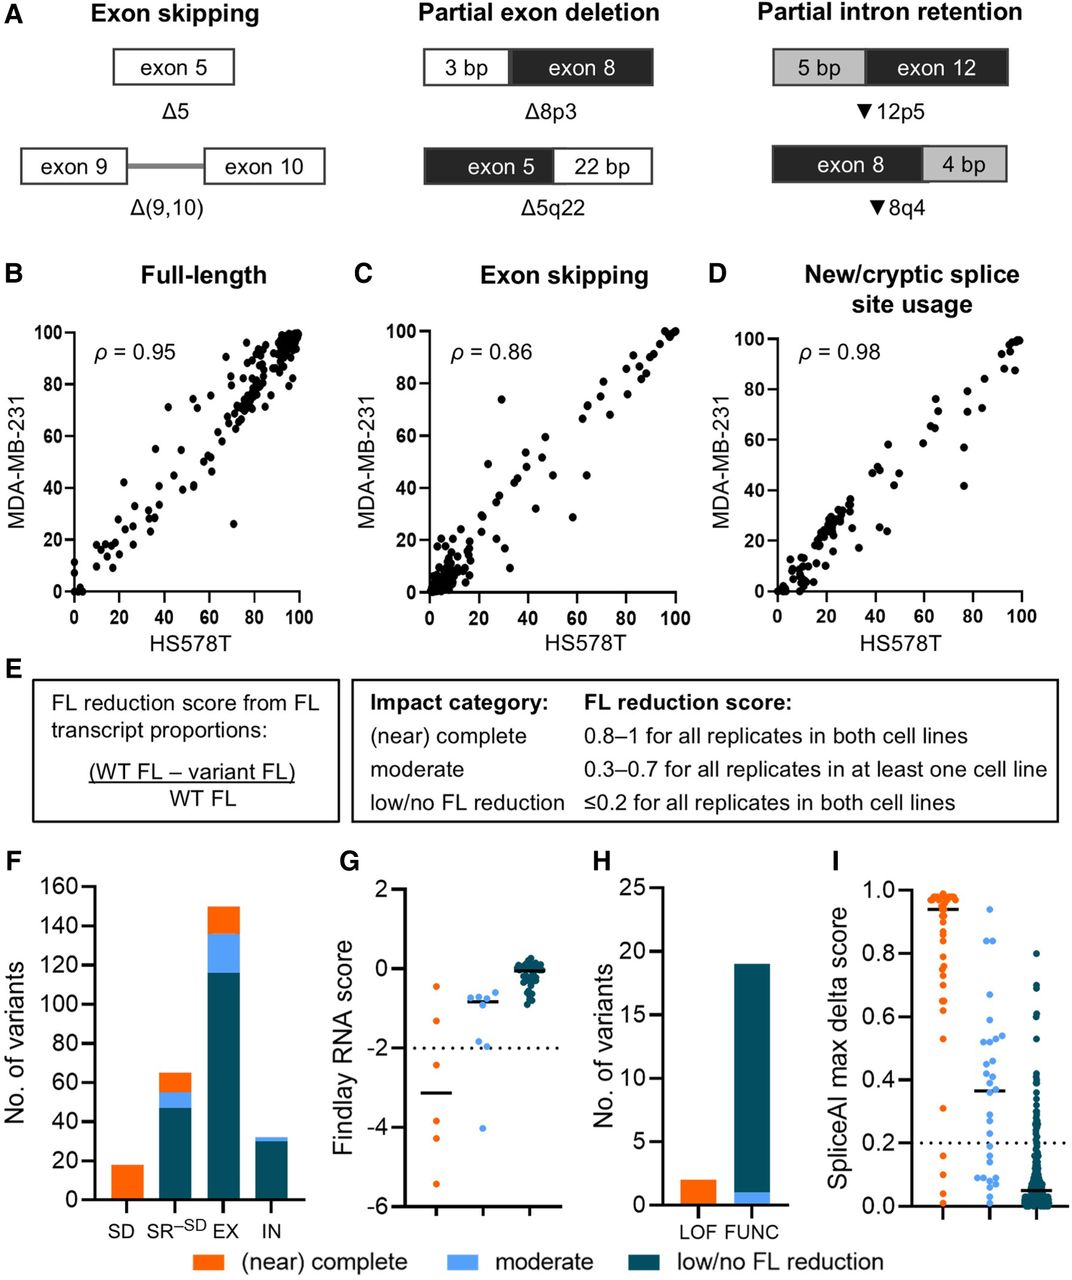
Assessing variant impact on splicing. (A) Illustration of transcript nomenclature showing examples of aberration types. Exon numbers are adjacent to the Δ or ▾ symbols. Deletions (Δ) or retentions (▾) at the 3′ end and 5′ end of exons are indicated by “p” and “q,” respectively. Numbers after “p” and “q” indicate the size (bp) of partial deletion/retention (for details, see Methods). (B–D) Measurements for 255 variants assayed in both the HS578T and MDA-MB-231 cell lines were plotted to show correlations of median full-length (FL; Spearman's ρ = 0.95; B), exon skipping (Spearman's ρ = 0.86; C), and alternative transcript (Spearman's ρ = 0.98; D) proportions. (E) Splicing impact categories based on FL reduction score. (F) Splicing impact of variants (n = 265) located at the splice donor/acceptor ±1,2-dinucleotide positions (SD), splice region excluding the splice dinucleotide positions (SR−SD), and exonic (EX) and intronic (IN) positions outside of the splice region. The splice region (SR−SD) spans from the first exonic base to 20 intronic bases upstream of the exon for the acceptor motif, as well as from the last three exonic bases to six intronic bases downstream from the exon for the donor motif, excluding the ±1,2 dinucleotides (Walker et al. 2023). (G) Plot of BRCA1 variants (n = 57) across the three splicing impact categories against the RNA score derived from Findlay et al. (2018). An RNA score threshold of –2 corresponds to 75% reduction of variant in messenger RNA. (H) Splicing impact of BRCA1 variants excluding missense and nonsense variants (n = 21) and their Findlay function class. (LOF) Loss of function, (FUNC) functional. (I) Distribution of SpliceAI max delta score of variants (n = 265) across the three splicing impact categories. Variants with SpliceAI score ≥0.2 were predicted to impact splicing. (G,I) Median scores are shown as solid horizontal lines.