Abstract
Autism spectrum disorder (ASD) is a highly heterogenous neurodevelopmental disorder with numerous genetic risk factors. Notably, a disproportionate number of risk genes encode transcription regulators including transcription factors and proteins that regulate chromatin. Here, we test the function of nine such ASD-linked transcription regulators by depleting them in primary cultured neurons. We then define the resulting gene expression disruptions using RNA sequencing and test effects on neuronal firing using multielectrode array recordings. We identify shared gene expression signatures across many ASD risk genes that converge on the disruption of critical synaptic genes. Fitting with this, we detect robust disruptions to neuronal firing throughout neuronal maturation. Together, these findings provide evidence that the loss of multiple ASD-linked transcriptional regulators disrupts transcription of synaptic genes and has convergent effects on neuronal firing that may contribute to enhanced ASD risk.
Autism spectrum disorder (ASD) is a highly prevalent neurodevelopmental disorder (NDD) with numerous risk genes (De Rubeis et al. 2014; Iossifov et al. 2014; de la Torre-Ubieta et al. 2016; Sullivan and Geschwind 2019). Major functional groups of ASD risk genes have emerged, including a large portion that encode proteins that regulate transcription (O'Roak et al. 2012; Parikshak et al. 2013; De Rubeis et al. 2014; Iossifov et al. 2014). Of these ASD-linked transcriptional regulators, many encode proteins that regulate chromatin, the complex of DNA and histone proteins that help to regulate transcription. Others encode transcription factors, whereas still others encode proteins that directly modify DNA itself. Thus, distinct groups of proteins with disparate functions in transcriptional regulation can lead to overlapping phenotypic outcomes.
We previously tested the effects of disrupting a set of ASD risk genes that function as chromatin regulators and found that they affected expression of a common set of genes that encode synaptic proteins (Thudium et al. 2022). This gene expression signature was detected in multiple systems and, together with the broader literature (Zhao et al. 2018; Satterstrom et al. 2020), suggests that neurons have gene sets that are highly susceptible to chromatin disruptions regardless of the specific manipulation, with similar signatures found across other psychiatric disorders (Rajarajan et al. 2018; Schrode et al. 2019). Further, numerous studies have identified sets of synaptic genes that have unique chromatin features and that are disrupted in ASD, either directly as ASD risk genes or indirectly following disruption of ASD-linked transcriptional regulators (Zhao et al. 2018; Satterstrom et al. 2020). Both our work and others (Satterstrom et al. 2020; Thudium et al. 2022) found that the targets of ASD-linked transcriptional regulators do not directly regulate other ASD-linked genes more than is expected by chance and instead target synaptic genes more broadly. However, prior analysis was limited to a handful of chromatin regulators. Whether similar transcriptional signatures are detected in response to disruption of transcriptional regulators more broadly beyond just chromatin-modifying enzymes and whether such changes result in shared functional outcomes remain unclear.
Here, we sought to address these outstanding questions, using a primary neuronal culture model to allow for comparisons within a highly controlled, genetically identical population of neurons. We then defined shared transcriptional and functional outcomes of distinct ASD-linked genes during neuronal maturation to improve our understanding of the molecular basis for ASD and related NDDs.
Results
Depletion of ASD-linked transcriptional regulators affects gene expression
Here, we sought to define shared gene expression signatures among multiple ASD-linked transcriptional regulators, including ASH1L, CHD8, DNMT3A, KDM6B, KMT2C, MBD5, MED13L, SETD5, and TBR1. We selected these targets to jointly test the roles of chromatin regulators, DNA modifying enzymes, and transcription factors, expanding upon prior work that focused on chromatin regulators alone. Importantly, here we selected chromatin modifying enzymes that target both distinct (KDM6B, KMT2C) and overlapping (ASH1L, SETD5) histone sites, histone remodelers from two different complexes (CHD8, MED13L), a DNA modifying enzyme (DNMT3A), a transcription factor (TBR1), and a noncatalytic chromatin-complex protein (MBD5) (Table 1). Additional criteria included that all are high-confidence ASD genes (scored as a “1” within the SFARI gene module and as a significant TADA gene), all lead to well-defined syndromes or associated phenotypes caused by loss-of-function mutations or deletions, and all have been successfully modeled in mice (Bernier et al. 2014; Camarena et al. 2014; Adegbola et al. 2015; Mullegama and Elsea 2016; Huang et al. 2019; Moore et al. 2019; Shen et al. 2019; Beighley et al. 2020; Christian et al. 2020; Lavery et al. 2020; Gao et al. 2021; Hurley et al. 2021; Fu et al. 2022; Li et al. 2022; Brauer et al. 2023; Chatterjee et al. 2023; Nakamura et al. 2024).
Function and association data for the nine transcriptional regulators chosen for analysis
| Protein | function | Target | SFARI score | EAGLE score | Associated disorders | Mouse phenotype |
|---|---|---|---|---|---|---|
| ASH1L | Histone methyltransferase | H3 lysine 36 | 1 | 14.5 | Emerging MCA/ID disorder | Yes |
| CHD8 | Chromodomain helicase | Chromatin remodeling | 1 | 97.65 | CHD8 NDD | Yes |
| DNMT3A | DNA methyltransferase | DNA | 1 | 15.9 | DNMT3A overgrowth syndrome | Yes |
| KDM6B | Histone demethyltransferase | H3 lysine 27 | 1 | 13.75 | Stolerman NDD | Yes |
| KMT2C | Histone methyltransferase | H3 lysine 4 | 1 | – | Kleefstra syndrome 2 | Yes |
| MBD5 | Transcription regulator | Nonenzymatic histone regulator | 1 | 46.6 | MAND, 2q34.1 microdeletion syndrome | Yes |
| MED13L | Mediator complex protein | RNA Pol II target genes | 1 | 35 | MRFACD syndrome | Yes |
| SETD5 | Histone methyltransferase | H3 lysine 36 | 1 | 28.05 | — | Yes |
| TBR1 | Transcription factor | Developmental gene programs | 1 | — | — | Yes |
[i] A SFARI gene score of “1” indicates high confidence for implication in autism spectrum disorder. Evaluation of autism gene link evidence (EAGLE) score ranges from six (limited) to 12+ (definitive) roles in autism for validated targets. Em-dashes indicate no known disorder or calculated EAGLE score.
To test these genes of interest, we used primary neuronal cultures derived from E16.5 embryonic mouse cortical tissue to generate a highly pure neuron population (Fig. 1A; Thudium et al. 2022). This allows for all targets to be tested within the same cell population without the complexity and heterogeneity of brain tissue. Further, this system provides a genetically identical background, which avoids confounding variables from the mixed backgrounds from patient samples. This system is also sufficiently tractable to test multiple candidate genes in parallel within neurons derived from the same embryo, thus providing a highly controlled system for comparisons and true biological replicates. Lastly, this system allows for targeting of transcriptional regulators in neurons following isolation from tissue and establishment of neuronal identity. This ensures that the same cell types are measured across conditions by avoiding disruptions to neuronal precursor cells that ultimately might affect cell identity or the ratio of inhibitory and excitatory neurons present during testing. Although disruptions during early neurogenesis are almost certainly highly relevant to the biology underpinning ASD, here we specifically sought to focus on effects within postmitotic neurons to allow for direct comparisons in equivalent cell types without disrupted developmental trajectories. Together, this system therefore allows for parallel testing of multiple genes across multiple biological replicates on a genetically identical background during a key period of neuronal maturation without changes in cell identity.
Gene expression analysis of nine independent chromatin modifier depletions in primary mouse neurons. (A) Schematic of the experimental time line for the comparison of transcriptomes between chromatin modifier depletions. (B) Counts per million (CPM) for the nine chromatin modifiers following lentivirus-mediated shRNA depletion of each target, relative to the average of nontargeting (N.T.)-treated neurons (n = 6). Red shows significant changes. Gray indicates that no others pass statistical significance by the DESeq2 negative binomial distribution with multiple testing correction. (C) Total up- or downregulated differentially expressed genes (DEGs) in the pairwise comparison of each depletion versus N.T.-treated neurons. For full DEG lists, see Supplemental Table S3. (D) Gene Ontology analysis of significantly downregulated gene sets. Recall is the proportion of functionally annotated genes in the query over the number of genes in the GO term. Precision is the number of genes found in the GO term over the total number of genes in the query. For results for other targets, see Supplemental Table S4. (E) GSEA of genes in the SynGO postsynaptic membrane potential term for each depletion transcriptional signature. The green line is the running, normalized enrichment score across all genes ranked by their change in expression from most increased at one to least increased. The red dotted lines specify the maximum and minimum running enrichment score per depletion. (NES) Directional normalized enrichment score across all genes.
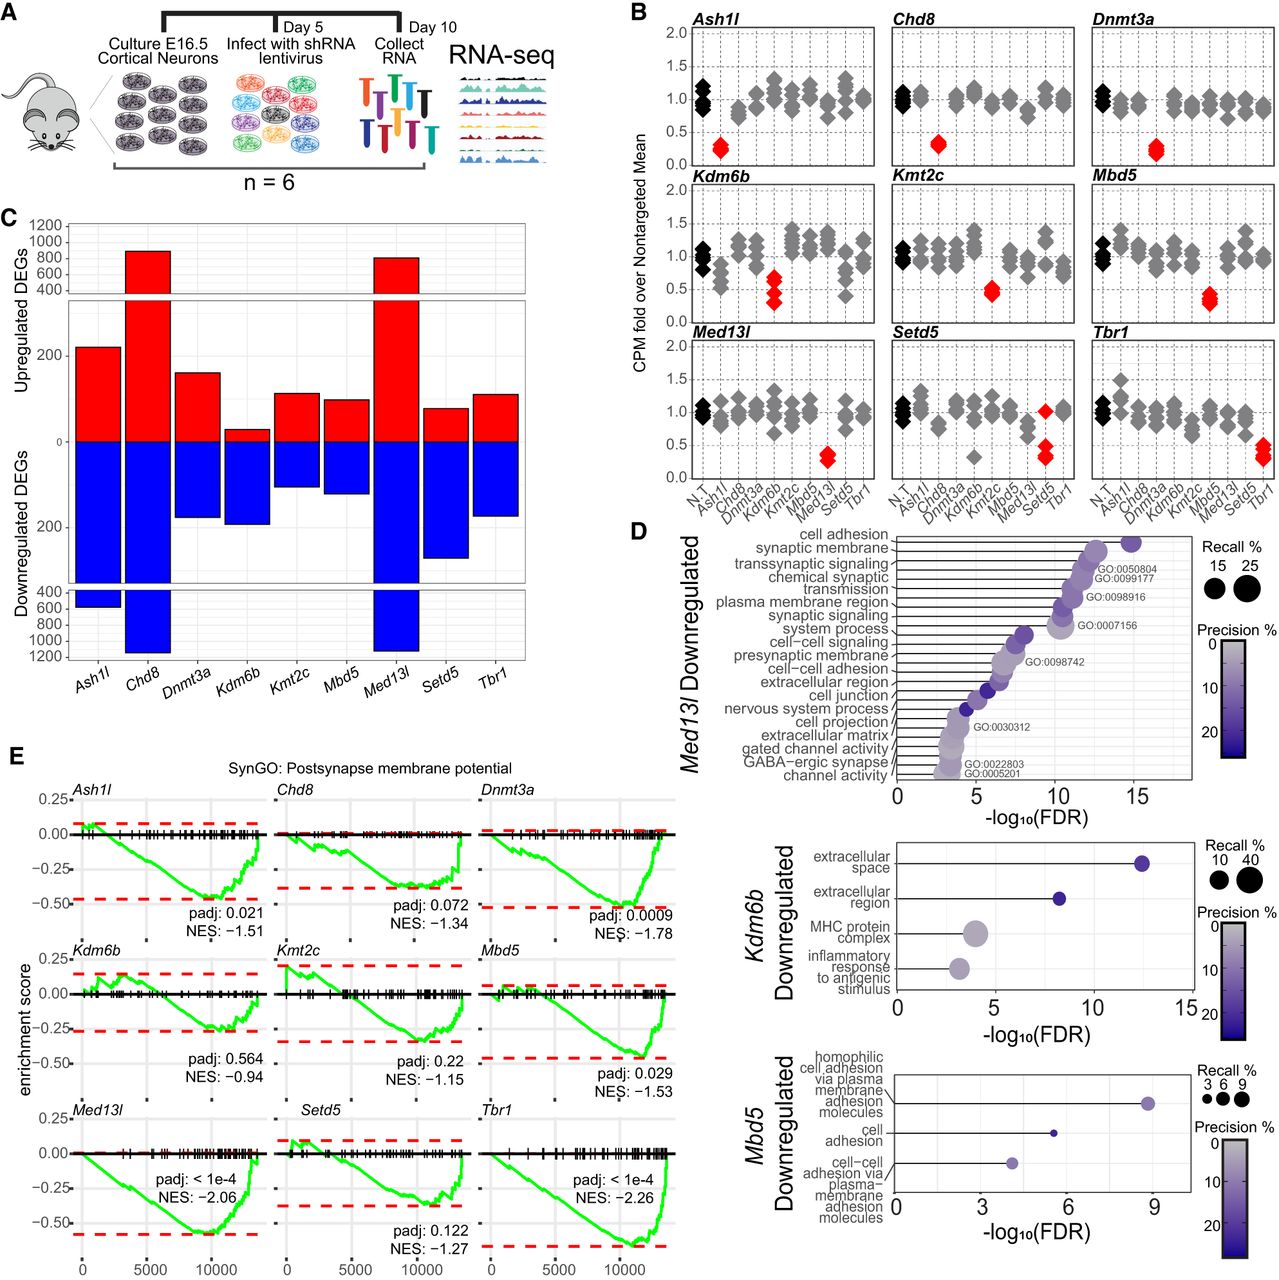
We cultured neurons derived from six wild-type E16.5 cortices (three male and three female) and infected neurons with lentivirus-containing shRNA at 5 days in vitro (DIV) to achieve partial depletion of targets and model a partial loss-of-function variant. Depletion of each target transcript was confirmed at DIV 10 (Supplemental Fig. S1A) and, when antibodies were available, was similarly confirmed at the protein level here (Supplemental Fig. S1B) or in prior work (Thudium et al. 2022). We then performed RNA sequencing at DIV 10, the time point when we previously identified robust transcriptional effects of multiple ASD risk genes (Thudium et al. 2022). We again confirmed knockdown of each target and, similar to prior findings (Thudium et al. 2022), determined that these transcriptional regulators do not directly affect gene expression of the other ASD-linked transcriptional regulators examined here (Fig. 1B). This suggests that any shared downstream effects are not simply due to one target causing disruption of another and thus also disrupting their target genes indirectly.
Next, we defined differentially expressed genes (DEGs) following depletion for all targets (Fig. 1C; Supplemental Table S1). Importantly, we detected minimal DEGs comparing nontargeting shRNA viral infection controls to noninfected neurons, indicating that the viral infection alone did not perturb gene expression in neurons (Supplemental Fig. S1C,D). All targeted transcriptional regulators caused gene expression changes as expected, although to markedly differing degrees. Notably, the degree of knockdown was not strongly correlated with the number of DEGs identified or the expression level of the target itself in this system (Supplemental Fig. S1E,F), nor were the effects correlated with modifier expression in neurons isolated from mouse brains at similar times during maturation (Supplemental Fig. S1G,H). This suggests that some ASD-linked transcriptional regulators have more robust effects on neurons during the early maturation stages compared with others because of their functional relevance to transcription in this culture system rather than because of technical factors. We also compared DEGs detected here and in separate experiments in prior work for two overlapping targets (Ash1l and Chd8). Although data sets were collected >7 years apart in time in different laboratories and were processed via different protocols and sequencing parameters, we did detect some significant overlaps in gene expression changes (Supplemental Fig. S1I,J).
To identify common functions encoded by disrupted gene, we performed Gene Ontology (GO) analysis on each group of significantly altered genes and found a wide range of enriched molecular and biological pathways across DEGs by depletion (Supplemental Table S2). Although not every gene set had significant GO outputs, those that did predominantly included downregulation of genes associated with synapse formation and function (Fig. 1D) and upregulation of metabolism genes (Supplemental Fig. S2A). For depletion conditions without these significant GO terms, individual critical synaptic genes were still detected among downregulated DEGs (Supplemental Fig. S2B). To determine the extent to which each depletion affected synaptic functioning beyond the most significant DEGs, we performed gene set enrichment analysis (GSEA) for each data set, examining expression change trends for postsynaptic membrane potential and synapse adhesion gene sets (Fig. 1E; Supplemental Fig. S2C). Seven and four, respectively, of nine showed significant downward trends for these key neuronal pathways. These analyses extend prior findings (Thudium et al. 2022) to other forms of transcriptional regulation beyond histone modifying enzymes. Interestingly, we found little overlap with high-confidence ASD and NDD risk genes (Supplemental Fig. S2D). This supports prior findings (Thudium et al. 2022) and suggests that ASD-linked transcriptional regulators cause neuronal disruption through mechanisms distinct from simply directly dysregulating other ASD-linked synaptic genes. Together, this work demonstrates that a broad range of ASD-linked transcriptional regulators serve to control expression of synaptic genes in neurons.
Depletion of ASD-linked transcriptional regulators cause shared gene expression changes
Notably, each individual shRNA can have off-target effects that may contribute to transcriptional changes. Therefore, we sought to define the shared transcriptomic outcomes across targets to detect gene sets that are most sensitive to loss of ASD-linked genes rather than off-target effects of a single shRNA. To define overlapping transcriptional changes, we first directly compared DEGs from each target and found significant overlap in 63 of 81 comparisons (Fig. 2A; Supplemental Table S3). Further, we identified multiple genes shared by three or more conditions (Fig. 2B–D) and confirmed multiple shared genes by qRT-PCR (Supplemental Fig. S2E). This fits with prior results that suggest that ASD-linked transcriptional regulators share multiple gene targets despite acting through disparate mechanisms in chromatin (Thudium et al. 2022).
Identifying transcripts that are co-dysregulated across depletions. (A) Significance of overlap for up- or downregulated DEGs after each depletion using hypergeometric tests. (B) Upset plot of up- or downregulated DEGs found in at least two depletions. Gene placement prioritizes the largest intersection possible, only showing overlaps with three or more DEGs. The darker colors correspond to a greater overlap degree. (C) DEGs that appear in at least two comparisons between depletion and the N.T. control (in blue). (D) Gene tracks of aligned transcripts over genes that were either upregulated (Myd88) or downregulated (Thbs1) in multiple depletions. (E) Gene Ontology analysis of all significantly downregulated genes found in at least two or three depletion conditions. (F) ChromHMM analysis of promoters (500 bp upstream of transcription start sites [TSSs]) of significantly up- or downregulated genes found in at least one, two, or three depletions. (Bg) All genes expressed in primary mouse neurons at DIV10.
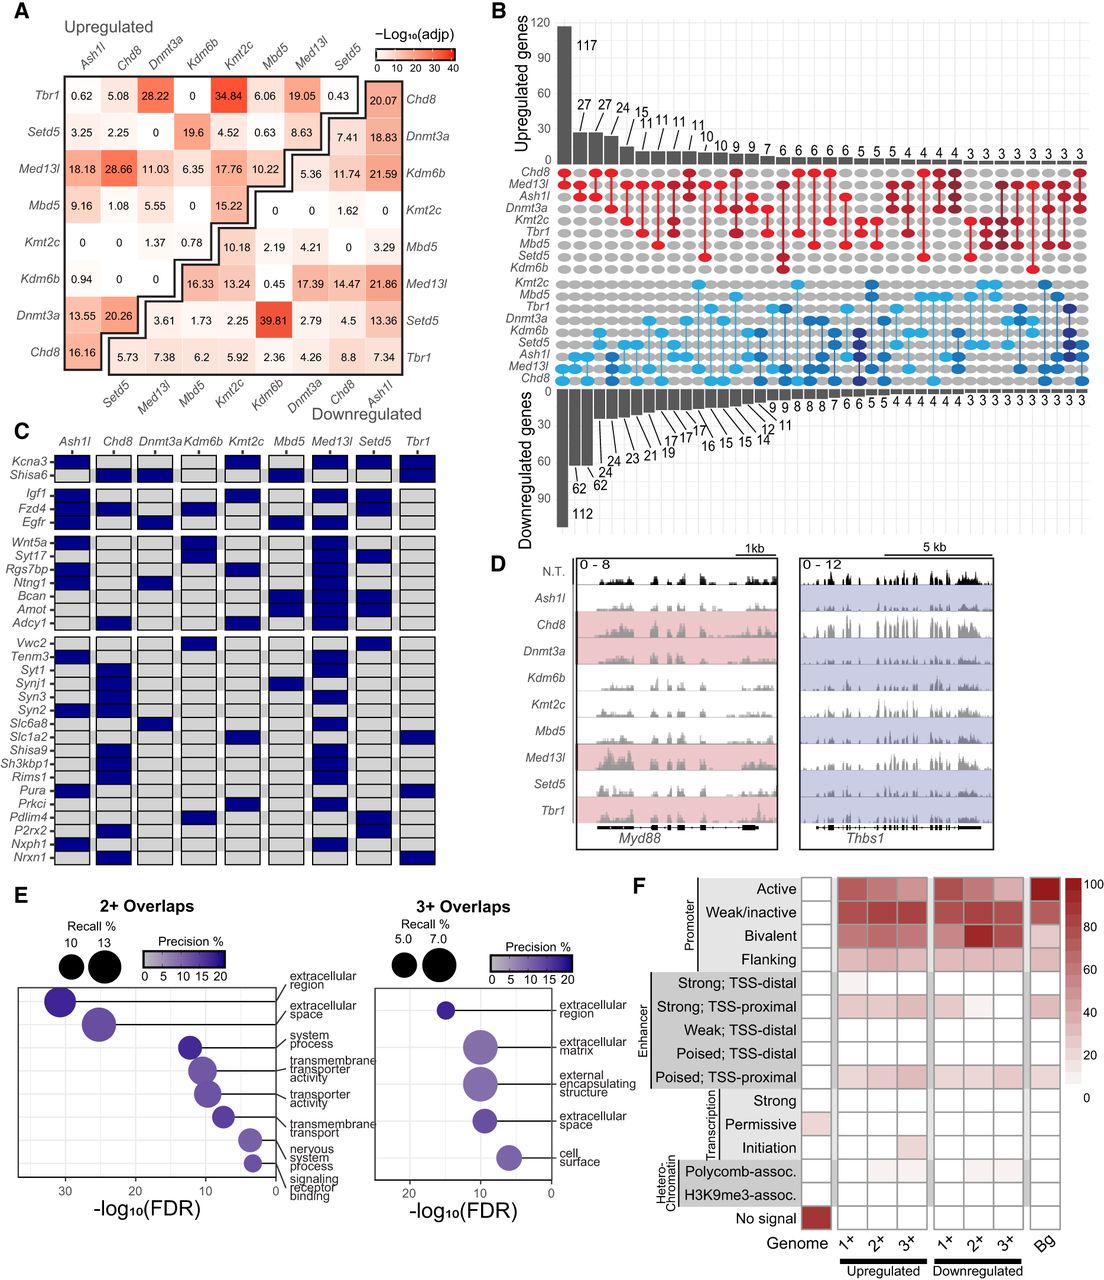
We next sought to identify functional enrichment in shared gene sets. We found that genes that were differentially expressed in at least two or three gene sets encoded proteins relevant to neuronal function such as transmembrane transporters and transsynaptic signaling components (Fig. 2E). Interestingly, these genes also shared several chromatin signatures (Fig. 2F). Gene sets detected in at least two or three conditions were enriched for genomic regions that contained bivalent domains, similar to prior findings (Thudium et al. 2022). These findings suggest that instances of specific genomic features identified in ASD risk genes (King et al. 2013; Zhao et al. 2018) are also common features of transcriptional disruptions underlying ASD. Together, these findings indicate that ASD-linked transcriptional regulators share gene targets with chromatin features that may sensitize them to disruption and have common functional outcomes in regulating expression of genes that function at neuronal synapses.
Gene expression modules influenced by ASD-linked transcriptional regulators
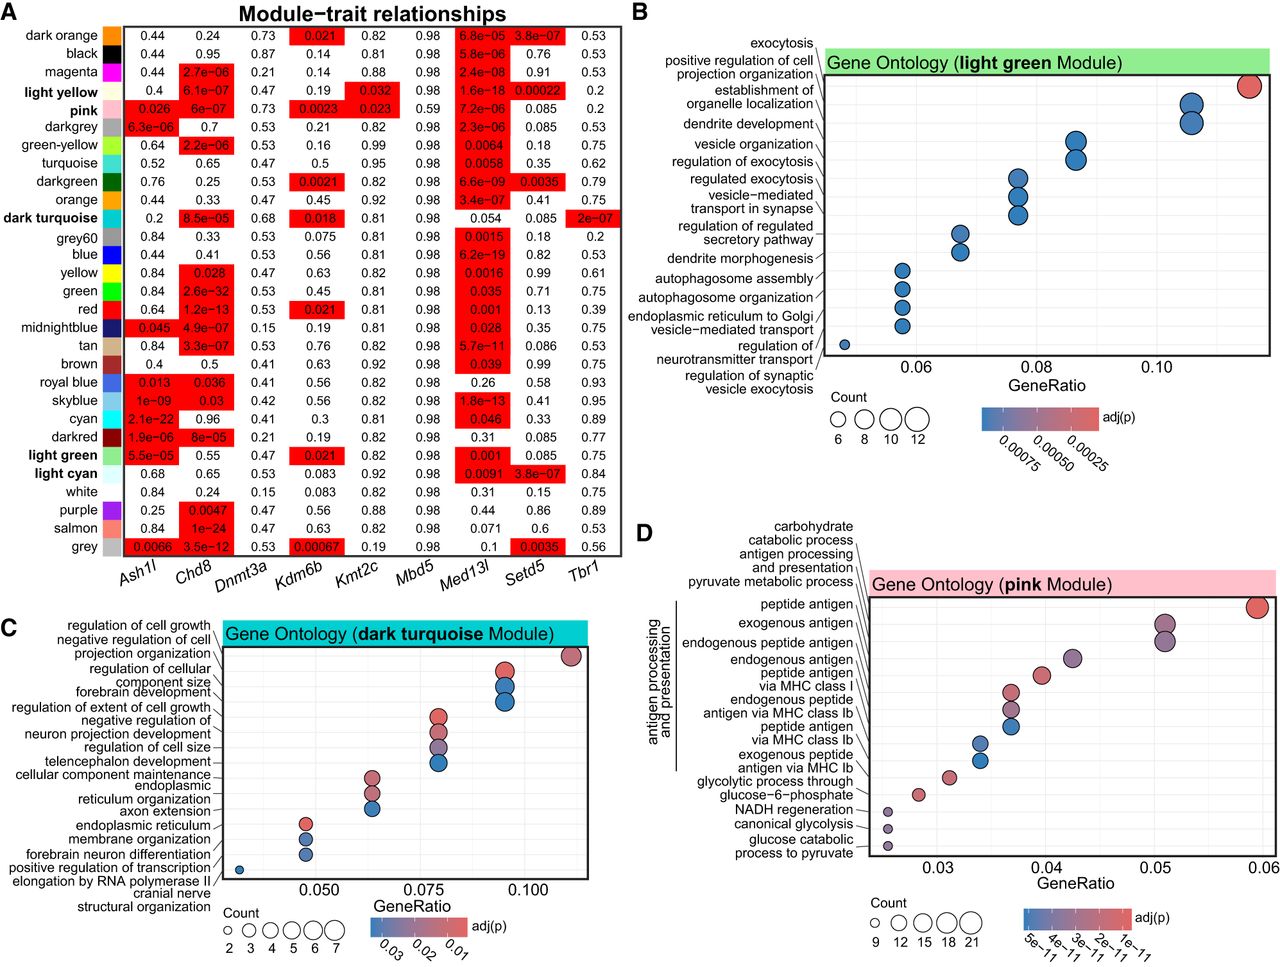
Next, we sought to expand these comparisons using more sensitive measures. We therefore used weighted gene coexpression network analysis (WGCNA) (Zhang and Horvath 2005) to capture system-level changes associated with the depletion of ASD-linked transcriptional regulators. We found multiple gene expression modules that were significantly associated with individual ASD-linked transcriptional regulators, as well as modules shared among multiple regulators (Fig. 3A; Supplemental Fig. S3A; Supplemental Table S4). In particular, we detected multiple significant modules enriched for genes involved in synapse function and neuronal development (Fig. 3B,C; Supplemental Fig. S3B), similar to other analyses (Figs. 1D and 2E). Interesting, we also detected gene modules linked to metabolism (Fig. 3D; Supplemental Fig. S3C), another major cellular function previously linked to ASD (Rossignol and Frye 2012a,b), and found among upregulated gene sets in other analyses (Supplemental Fig S2E). This suggests that this analysis may reveal more subtle gene expression changes that also contribute to cellular changes associated with ASD. These findings support the broader conclusion that ASD-linked genes have similar functional outcomes rooted in transcriptional signatures that are shared between conditions. Further, these different analyses reveal common trends observed in ASD research more broadly, including disruption of neuronal synapses, neuronal development, and metabolism.
Shared and unique gene modules between ASD-linked genes. (A) WGCNA modules identified after the coexpression network construction. Numbers are the Benjamini–Hochberg-corrected P-values for the effect of each depletion on module expression with a linear model. Bolded fonts indicate those with GO terms shown in B–D or in Supplemental Figure S3. (B–D) Gene Ontology analysis of shared modules. Counts indicate the number of genes in the GO term.
Defining common transcriptional signatures ASD-linked transcriptional regulators
We next used limma-voom analysis (Law et al. 2014; Ritchie et al. 2015) to generate a differential gene expression model factoring all transcriptional regulators together to define common transcriptional signatures that diverge from control infected neurons. We found that this multicondition modeling of the depletions together resulted in significant up- and downregulated gene sets with a greater number of downregulated genes identified (Fig. 4A; Supplemental Table S5). To understand what combinations of transcriptional regulators contributed to the transcriptional signature identified by limma, we examined the top hits and found genes with changes in expression across multiple conditions (Fig. 4B). Pairwise comparisons of the trends in gene expression of the shared limma signature model showed variable but strong correlations and overlaps between nearly every pair of targets, indicating that this approach was successful in identifying convergent gene sets that link all targets (Fig. 4C).
Multiple factor linear modeling with nine independent chromatin modifier depletions in primary mouse neurons. (A) Volcano plot of DEGs from the limma/voom model factoring all nine depletion conditions against a N.T. control. (B) Relative expression of the top DEGs identified in the multifactor model in each depletion versus the average of nontargeting (N.T.)-treated neurons. (C) Cross-correlation plots comparing the overall expression profiles of each depletion against a N.T. control. Heatmap number and colors indicate correlation coefficient. Topography plots show the distribution of expression changes for all genes between any two depletions within their relative contribution to the model. (D) Gene Ontology analysis of significantly downregulated DEGs. Recall is the proportion of functionally annotated genes in the query over the number of genes in the GO term. Precision is the number of genes found in the GO term over the total number of genes in the query. (E) ChromHMM analysis of promoters (500 bp upstream of TSSs) of significantly up- or downregulated genes in the complete model or in the models without Chd8 or Med13l. (Bg) All genes expressed in primary mouse neurons at DIV10.
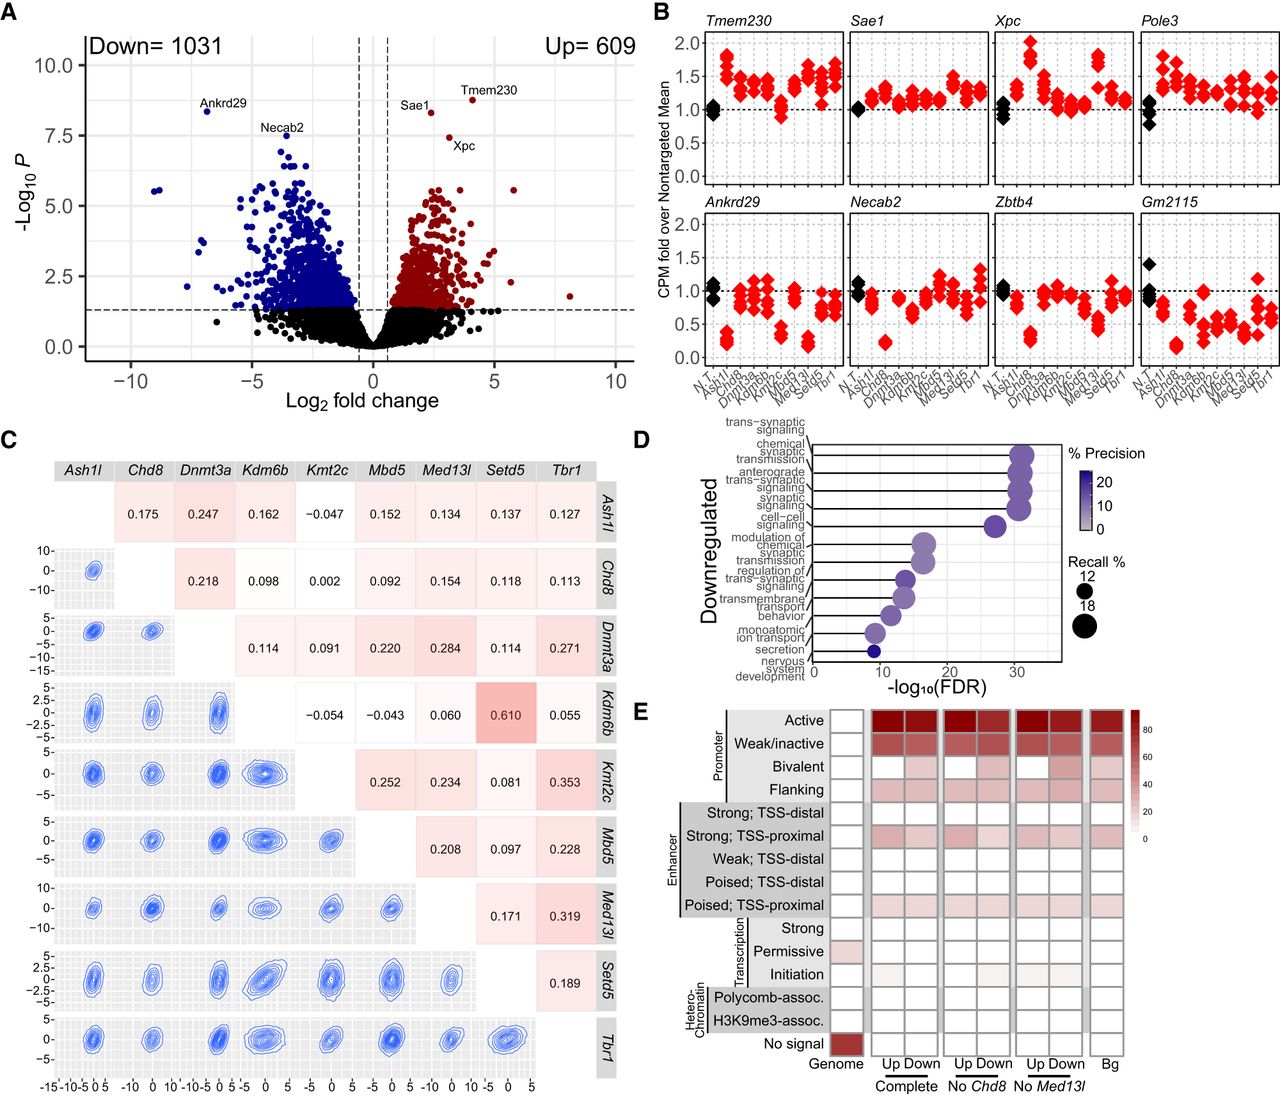
We used GO to examine the function of these gene sets and found that downregulated genes were primarily transsynaptic signaling, whereas upregulated genes were enriched for those with enzyme activity (Fig. 4D; Supplemental Fig. S4A), similar to findings from direct overlap analyses. We again found that downregulated genes are enriched for bivalent domains and that upregulated genes are enriched for chromatin features associated with strong proximal enhancers (Fig. 4E). We also observed a small but significant overlap between the downregulated signature and ASD and NDD risk genes depending on the data set used (Supplemental Fig. S4B).
To ensure that gene signatures were not being predominantly driven by single depletion conditions with disproportionately greater effects on gene expression, we repeated these analyses to generate a differential gene expression model without either the Chd8- or Med13l-depletion condition, the two targets with the greatest number of DEGs (Fig. 1C). We found that in both cases, we detected shared gene expression signatures that encoded similar functional groups and shared most genes with the full model (Supplemental Fig. S4C–G).
Finally, given the recurrent disruption of genes encoding synaptic proteins regardless of the model or target analyzed, we asked whether synaptic gene expression was sufficient to separate control conditions from depletion conditions. Using a synaptic gene list from GO as an eigengene vector, we found that this gene set was sufficient to significantly distinguish between the control and depletion conditions (Supplemental Fig. S5A). Further, we confirmed that the gene signatures we detected via limma-voom analysis, either using all conditions or using those detected in the absence of Chd8 or Med13l, were similarly able to separate control from depletion conditions as expected (Supplemental Fig. S5B–E).
Together, these findings define a transcriptional signature that is shared across the target genes of multiple ASD-linked transcriptional regulators. This signature expands upon prior work (Thudium et al. 2022) that demonstrates that long synaptic genes are highly sensitive to chromatin disruptions. Importantly, these findings demonstrate such features are true of ASD-linked transcriptional regulators more broadly than only ASD-linked chromatin modifying enzymes.
ASD-risk transcriptional regulators disrupt neuronal firing patterns
We consistently observe considerable disruptions to synaptic gene expression following depletion of both chromatin and transcriptional regulators linked to ASD, including those in studies that focused on other ASD-linked proteins (Thudium et al. 2022). We therefore asked whether these disruptions resulted in functional changes in neuronal firing patterns. To test this, we used multielectrode array (MEA) recordings to record spontaneous firing activity of neurons depleted for each transcriptional regulator individually (Fig. 5A; Supplemental Tables S6–S9). We began testing at 12 days in the culture, when spiking activity was low but detectable, and continued through 22 days in the culture. During this period, we detected no changes in the covered electrodes or resistance, suggesting neurons remained healthy throughout the assay (Supplemental Fig. S6A,B).
Changes in spontaneous firing activity owing to transcriptional regulator depletion. (A) Experimental time line and schematic for the culturing and measurements of primary neurons using the multielectrode array (MEA). The recording diagram illustrates the different metrics collected by the MEA instrument. (B) Weighted firing rate of each condition based only on electrodes with activity greater than the minimum spike rate from days in vitro (DIV) 12 to 22. (C) Evoked metrics for each condition at DIV 18. Significance based on one-way ANOVA followed by Dunnett's posttest: (***) ≤0.001, (**) ≤0.01, (*) ≤0.05, (NS) not significant. (D) Example spiking patterns over a 200 sec recording period at DIV18.
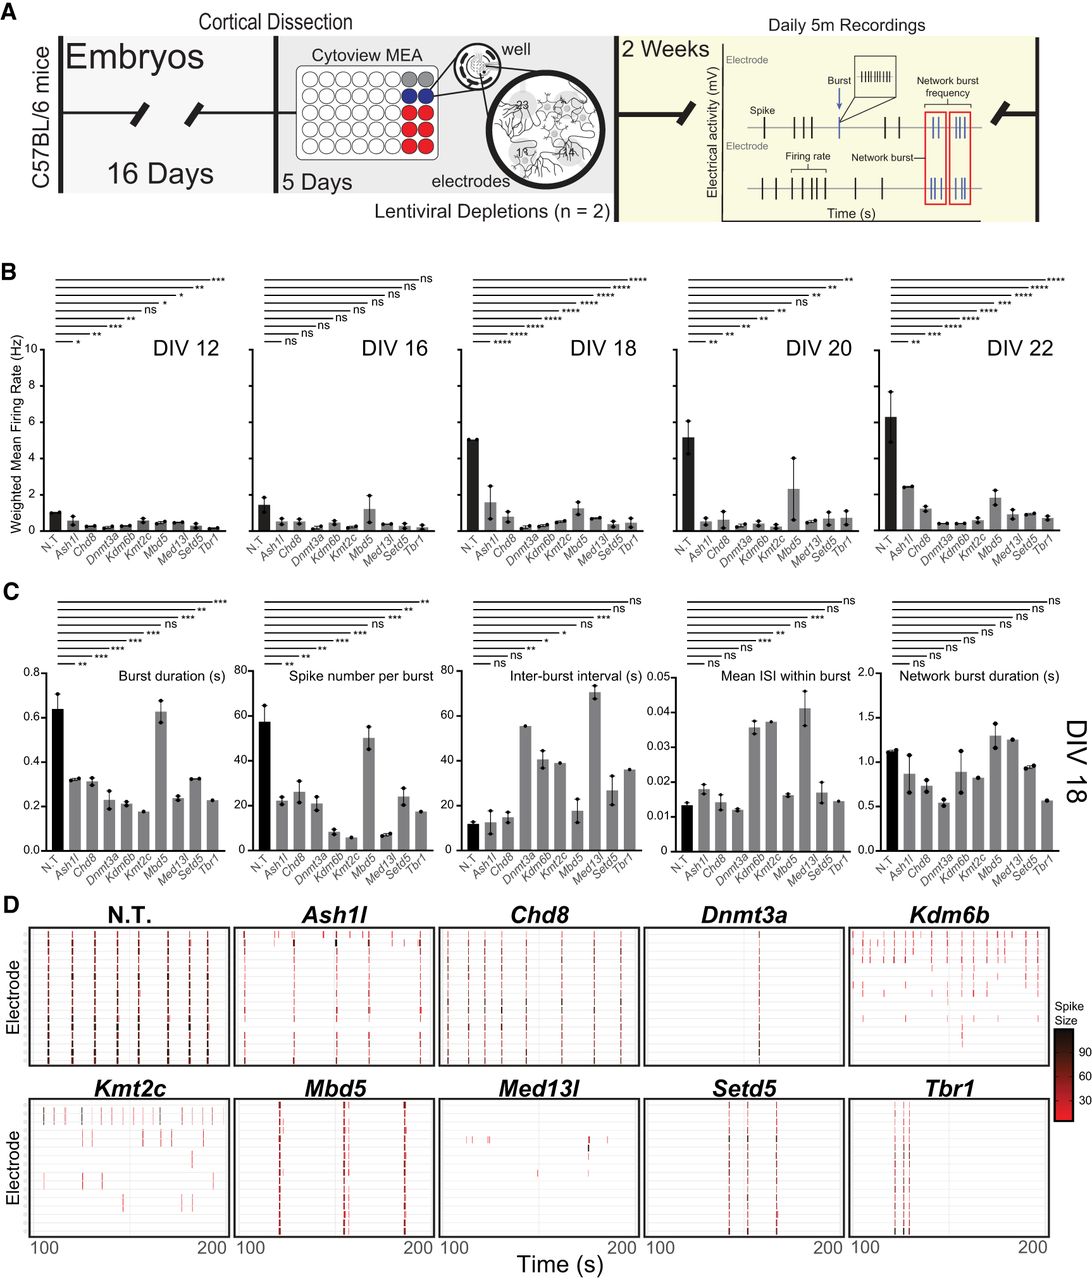
We found that disruption of every ASD-linked transcriptional regulator tested caused robust changes in firing patterns with decreased spike number over multiple developmental time points (Fig. 5B; Supplemental Fig. S6C). Notably, although control neurons show anticipated increases in spiking with maturity, depletion of nearly every transcriptional regulator dampened or fully blocked this increase with maturation. We then focused on 18 days in culture as a midpoint between early detection of spiking and endpoints when cells begin to show signs of decay after day 22. At day 18, we also observe consistent, strong firing and bursting metrics from our controls, allowing us to capture a dynamic range via multiple metrics. Following depletion of multiple transcriptional regulators, we observed decreased bursting and burst duration (Fig. 5C,D). Even when bursting was observed, regularity of bursting and synchrony were also severely disrupted (Fig. 5C; Supplemental Fig. S6D). Similar although less robust changes were detected at 16 days in culture (Supplemental Fig. S6E).
Although depletion of these transcriptional regulators caused many similar functional disruptions to neuronal firing, they also resulted in some divergent effects, particularly for spike amplitude (Supplemental Fig. S7A). Although half of the ASD-linked targets showed a decrease in spike amplitude, others showed no change. Further, although Med13l depletion caused among the most robust decreases in inter-burst interval and spikes per burst, it also was the only target to show an increase in spike amplitude. Mbd5 loss, conversely, caused the least robust effects on multiple metrics (Fig. 5C). Given these detectable differences, we sought to group these transcriptional regulators by principal component (PC) analysis based on their effects on neuronal firing. We therefore used all MEA metrics collected and examined PC1 through PC6 and found that PC1 separated a portion of the ASD-linked targets tested (Supplemental Fig. S7B). We therefore repeated limma-voom analysis on the groups that most clearly separated based on MEA metrics, comparing Tbr1, Dnmt3a, and Med13l to Chd8, Ash1l, and Mbd5 (Supplemental Fig. S7C). We found that comparisons between these subgroups identified significant gene expression changes with enriched functions relating to metabolism (Supplemental Fig. S7D; Supplemental Table S10). This suggests that divergent transcriptional disruptions may underlie functional differences between various ASD-linked genes in addition to their shared disruptions causing numerous overlapping effects. Together, these data provide evidence that a variety of gene disruptions linked to ASD are capable of severely disrupting neuronal firing and that downregulation of synaptic gene expression detected via RNA sequencing results in robust functional changes. Further, these findings provide evidence of convergent functional effects while also highlighting the subtle but detectable differences between ASD-linked transcriptional regulators.
Discussion
Here, we partially depleted chromatin regulators, DNA modifying enzymes, and transcription factors that are all strongly linked to ASD. We found that despite divergent functions, they converge on a common gene expression signature identified through multiple analyses. Using RNA sequencing, we defined gene expression signatures common between these ASD-linked transcriptional regulators. This signature encodes critical neuronal proteins including synaptic proteins, suggesting similar functional outcomes of these transcriptional disruptions. To test the functional implications of these transcriptomic changes, we measured neuronal firing patterns. Every transcriptional regulator tested affected spiking and bursting patterns throughout neuronal maturation. These data demonstrate that disruption of multiple types of ASD-linked transcriptional regulators results in shared gene expression signatures and neuronal firing patterns despite having divergent effects on chromatin and gene regulation.
This work expanded upon prior findings by testing transcriptional regulators broadly rather than just focusing on single ASD-linked genes or on only proteins that directly modify chromatin. Instead, we selected proteins with highly divergent effects on chromatin and transcription. These included chromatin modifying enzymes that target different histone sites, chromatin remodelers from different complexes, a DNA modifying enzyme, a transcription factor, and a noncatalytic chromatin-complex protein. Even with this expanded group, we successfully identified both shared gene signatures and common neuronal spiking and bursting patterns. This suggests that specific neuronal gene sets are particularly sensitive to multiple types of epigenetic manipulations and that disruption of these genes causes robust functional changes in neuronal firing.
Both the analyses overlapping individual depletion DEGs and the limma model identified several significantly downregulated genes that may be important points of convergence in the shared roles of the modifiers in affecting neuronal functioning. Topoisomerase (DNA) II alpha (Top2a) was downregulated in seven of the nine depletions in addition to being identified in the limma model. Notably, loss of TOP2A causes social deficits in mice and zebrafish (Geng et al. 2022), suggesting its decreased expression may have functional consequences that are relevant to ASD phenotypes. Additionally, both analyses identified numerous genes important in brain development, including insulin-like growth factor 1 and 2 (Igf1/2) and neuronal PAS domain protein 1 (Npas1). We also observed consistent reduction in two aquaporin genes (Aqp4 and Aqp11) that are less well studied but are also linked to social and anxiety-like behavior in animal models (Davoudi et al. 2023). Together with the overall reductions found in the expression data by GSEA and the functional results of the MEA, these findings support the convergent roles of these chromatin modifiers on neuronal biology that may contribute to NDDs. WGCNA analysis similarly identified several relevant modules, including those enriched for genes involved in cellular respiration and metabolism. Notably, metabolic dysfunction is also linked with ASD (Rossignol and Frye 2012a,b) and may contribute to neuronal aberrations in the disorder owing to the high energy demands of neurons.
Although we identified numerous genes of interest, the system used here also has several limitations. The signatures we defined are likely to be somewhat specific to the developmental time selected and the model chosen. We expect that if these assays were performed at different developmental time points, we would detect different gene expression signatures that may have very distinct effects on functional outcomes. We thus consider these results as primarily indicative of sensitive genes during this stage of neuronal maturation rather than an absolute list of transcriptional targets for any given gene studied here. In addition, it is likely that results will at least partly diverge from human systems such as iPSC-derived neurons that may more closely match human developmental trajectories. Nonetheless, we view this system as offering unique insights that emerge from the ability to test multiple ASD risk genes in parallel in a highly controlled system with genetically identical biological replicates.
Together, our findings demonstrate shared gene expression signatures and functional outcomes of disruption of multiple ASD-linked transcriptional regulators. This work provides insights into underlying cellular mechanisms that link ASD risk genes to neuronal function and highlights common pathways that are controlled by ASD-linked transcriptional regulators.
Methods
Mice
All mice used were on the C57BL/6J background, housed in a 12-h/12-h light–dark cycle, and fed a standard diet. All experiments were conducted in accordance with and approval of the IUCAC.
Primary neuronal culture
Cortices were dissected from E16.5 C57BL/6J embryos and cultured in supplemented neurobasal medium (Neurobasal [Gibco 21103-049], B27 [Gibco 17504044], GlutaMAX [Gibco 35050-061], pen-strep [Gibco 15140-122]) in TC-treated 12- or 24-well plates coated with 0.05 mg/mL poly-D-lysine (Sigma-Aldrich A-003-E). Neurons from individual embryos were seeded to 12 wells each. At three to four DIV, neurons were treated with 0.5 mM AraC. For all experiments using cultured cortical neurons, neurons were treated with lentivirus containing shRNA on DIV 5. For RNA and protein analysis, cells were collected at DIV 10.
Virus generation and validation
HEK293T cells were cultured in high-glucose DMEM growth medium (Corning 10-013-CV), 10% FBS (Sigma-Aldrich F2442-500ML), and 1% pen-strep (Gibco 15140-122). Calcium phosphate transfection was performed with Pax2 and VSVG packaging plasmids in serum-free media. shRNAs in a pLKO.1-puro backbone were purchased from the Sigma-Aldrich MISSION shRNA library (SHCLNG) and are shown in Supplemental Table S11. Media was changed 2 h after transfection, and viruses were collected 24 and 48 h later. Viral media was passed through a 0.45 µm filter and precipitated overnight with PEG-it solution (40% PEG-8000 [Sigma-Aldrich P2139-1KG], 1.2 M NaCl [Fisher Chemical S271-1]). Viral particles were pelleted at 1500g, washed, and resuspended in 200 µL PBS. Virus validation was done on E16.5 WT cortical neurons. Neurons were infected with virus on DIV 5. Depletion efficiency was measured using RT-qPCR with shRNA targeting luciferase as a nontargeting control.
Western
After DIV 10, neurons were lysed in RIPA (25 mM Tris at pH 7.6, 150 mM NaCl, 1% NP-40, 1% sodium deoxycholate, 0.1% SDS) supplemented by protease inhibitor (Roche 04693124001), phosphatase inhibitor (Roche 04906837001), 1 mM DTT, and 1 mM PMSF. Lysates were mixed with 5× loading buffer (5% SDS, 0.3 M Tris at pH 6.8, 1.1 mM bromophenol blue, 37.5% glycerol), boiled for 10 min, sonicated for 10 min, and cooled on ice. Protein was resolved by 4%–20% Tris-glycine or 3%–8% Tris-acetate SDS-PAGE (invitrogen novex gels XP04205, EA03785) followed by transfer to a 0.45 µm PVDF membrane (Sigma-Aldrich IPVH00010) for immunoblotting. Membranes were blocked for 1 h in 1%–5% BSA or 5% milk in TBST and probed with primary antibody overnight at 4°C. For antibodies, see Supplemental Table S12.
RNA isolation
Total RNA was collected from all cultures at DIV 10 using the Zymo Quick-RNA microprep kit (R1050).
RT-qPCR
Two hundred fifty nanograms of RNA per sample was used to prepare cDNA using the high-capacity cDNA reverse transcription kit (Applied Biosystems 4368813), and quantitative PCR was performed with power SYBR green PCR master mix (Applied Biosystems 4367659). For primers, see Supplemental Table S13.
RNA-seq library preparation
Sequencing libraries were prepared using the TruSeq stranded mRNA kit (Illumina 20040534). Prior to sequencing, library size distribution was confirmed by capillary electrophoresis using an Agilent 4200 TapeStation with high-sensitivity D1000 reagents (5067-5585), and libraries were quantified by qPCR using a KAPA library quantification kit (Roche 07960140001). Libraries were sequenced on an Illumina NextSeq 1000 instrument (100 bp read length, paired end).
Data processing and differential gene expression
Reads were mapped to Mus musculus genome build mm10 with STAR (v2.7.1a) (Dobin et al. 2013) and assigned to exonic features using the featureCounts function of subRead (v2.0.3). DESeq2 (v1.38.0) (Love et al. 2014) was used for pairwise differential gene expression analysis using a negative binomial model with default model fitting parameters in R (R Core Team 2018). Six WT replicates were used for downstream analysis for each condition. Batch effects introduced by differences in the sexes were regressed using a negative binomial model via ComBat-ref (Zhang 2024). Subsetting filters were applied to determine significant DEGs as follows: baseMean of normalized counts greater than 20, adjusted P-value ≤ 0.05, and |fold change| ≥ 1.5 (|log2(FC)| ≥ 0.58). Integrated Genomics Viewer (v2.16.0.01) (Robinson et al. 2011) was used to visualize RNA-seq read tracks that were normalized to the same total read number across all samples using SAMtools (Danecek et al. 2021). Multifactor gene expression analysis was performed using limma (v3.52.4) via edgeR (v3.38.4) (Robinson et al. 2010). Normalization factors were calculated, and expression values were transformed to logCPM using voom (Law et al. 2014). An empirical Bayesian distribution was calculated with weighting from all nine depletion conditions across all samples.
Downstream analysis
Hypergeometric testing of significant overlaps between gene lists was performed using the dhyper density distribution without replacement using a background size of 13713 and Bonferroni correction for multiple testing. gProfiler2 (v0.2.3) (Kolberg et al. 2020) was used for GO analysis with g:SCS correction of multiple testing, a background list of all genes expressed in the neuronal culture (base mean of normalized counts greater than 20), and a term size limit of 2000 genes. SynGO was performed using the web client (v1.2) (Koopmans et al. 2019). Gene set enrichment analysis was performed using FGSEA (v1.22.0) (Korotkevich et al. 2021). This utilized a multilevel Monte Carlo approach with default parameters. Gene lists were from REACTOME or SynGO synapse umbrella terms. ChromHMM (Ernst and Kellis 2017) analysis used validated ChIP-seq data from E12.5 mouse forebrain tissue against 500 bp windows directly upstream of query genes. Transcription factor motif analysis on 5 kb windows directly upstream of the query genes was analyzed using sequence enrichment analysis in the MEME suite (v5.5.7) (Bailey and Grant 2021). Motifs were scanned using the JASPAR 2020 Core Vertebrates database using the windows 5 kb upstream of 1000 randomly selected genes expressed in neurons. WGCNA was used to construct a signed coexpression network (v1.73) (Langfelder and Horvath 2008). Batch-corrected inputs were filtered for those with read count of 10 or more and normalized using variance stabilizing transformation of DESeq2 with design = ∼ depletion. Network construction used a soft threshold blockSize = 20000, networkType = “Signed,” power of 20, scale-free topology fit of 0.83, and minimum module size of 40. For each module, we calculated its expression (module eigengene [ME]) as the first PC of normalized expression. We used a linear model to test the effect of each depletion on module expression compared to nontargeting control. P-values were corrected using Benjamini–Hochberg correction. GO for WGCNA was performed using the enrichGO function from clusterProfiler (v4.10.1) (Yu et al. 2012) with the BP ontology database, Benjamini–Hochberg correction, P-value cutoff of 0.05, and Q-value cutoff of 0.05. The top 15 terms per analysis were selected for figures.
MEA analysis
Primary neuronal culturing was performed as described above using E16.5 embryos derived from the mating of female mice (C57BL/6N). Cerebral cortices were isolated from two pups from two separate litters and dissociated as described above and then plated in poly-D-lysine/laminin-coated MEA plates (Axion Biosystems M768-tMEA-48W) using the dot plate method, at 70,000 cells/well. For viral infections, each well was uniquely infected with one of the nine ASD targets or nontargeting shRNA at DIV 5. Viral media was removed after 20 h of exposure and replaced with enriched neurobasal media. After 11 days, the synaptic activity of cultured neurons was recorded daily using the Maestro MEA system (Axion Biosystems). Recordings were done 5 and 30 min after placing in MEA machine at 5% CO2 and at 37°C. Metrics were further processed using Prism with a one-way ANOVA followed by Dunnet's posttest and R.
Data access
All raw and processed sequencing data generated in this study have been submitted to the NCBI Gene Expression Omnibus (GEO; https://www.ncbi.nlm.nih.gov/geo/) under accession number GSE286067.
Competing interest statement
The authors declare no competing interests.
Acknowledgments
E.K. and R.A. were supported by National Institutes of Health (NIH) National Institute of Mental Health (NIMH) (1DP2MH129985) and NIH National Institute of Neurological Disorders and Stroke (NINDS) (R01NS134755), Autism Spectrum Program of Excellence at the University of Pennsylvania (ASPE), and the Eagles Autism Foundation. A.P. was supported by NIH grant T32-ES019851. J.E.P-C. was supported by NIH NIMH (1R01MH120269; 1DP1MH129957); NIH NINDS (5-R01-NS114226). S.S. was supported by University of Pennsylvania Center for Undergraduate Research and Fellowships (CURF) grants. S.Z. was supported by the University of Pennsylvania Epigenetics Institute. We acknowledge the use of microelectrode array equipment purchased through use of a NIH shared equipment grant (1S10OD032363 to J.E.P-C. and E.K.).
Author contributions: R.A. performed cell culture and MEA assays and generated RNA sequencing libraries. A.P. analyzed sequencing and MEA data. S.S. provided analysis support for MEA data. S.Z. provided WGCNA analysis. J.E.P-C. and A.J.W. provided MEA access and guidance. E.K. wrote the manuscript and led the project.
Notes
[2] Supplementary material [Supplemental material is available for this article.]
[3] Article published online before print. Article, supplemental material, and publication date are at https://www.genome.org/cgi/doi/10.1101/gr.280698.125.
References
- ↵Adegbola A, Musante L, Callewaert B, Maciel P, Hu H, Isidor B, Picker-Minh S, Le Caignec C, Delle Chiaie B, Vanakker O, 2015. Redefining the MED13L syndrome. Eur J Hum Genet 23: 1308–1317. 10.1038/ejhg.2015.26
- ↵Bailey TL, Grant CE. 2021. SEA: Simple Enrichment Analysis of motifs. bioRxiv 10.1101/2021.08.23.457422
- ↵Beighley JS, Hudac CM, Arnett AB, Peterson JL, Gerdts J, Wallace AS, Mefford HC, Hoekzema K, Turner TN, O'Roak BJ, 2020. Clinical phenotypes of carriers of mutations in CHD8 or its conserved target genes. Biol Psychiatry 87: 123–131. 10.1016/j.biopsych.2019.07.020
- ↵Bernier R, Golzio C, Xiong B, Stessman HA, Coe BP, Penn O, Witherspoon K, Gerdts J, Baker C, Vulto-van Silfhout AT, 2014. Disruptive CHD8 mutations define a subtype of autism early in development. Cell 158: 263–276. 10.1016/j.cell.2014.06.017
- ↵Brauer B, Merino-Veliz N, Ahumada-Marchant C, Arriagada G, Bustos FJ. 2023. KMT2C knockout generates ASD-like behaviors in mice. Front Cell Dev Biol 11: 1227723. 10.3389/fcell.2023.1227723
- ↵Camarena V, Cao L, Abad C, Abrams A, Toledo Y, Araki K, Araki M, Walz K, Young JI. 2014. Disruption of Mbd5 in mice causes neuronal functional deficits and neurobehavioral abnormalities consistent with 2q23.1 microdeletion syndrome. EMBO Mol Med 6: 1003–1015. 10.15252/emmm.201404044
- ↵Chatterjee I, Getselter D, Ghanayem N, Harari R, Davis L, Bel S, Elliott E. 2023. CHD8 regulates gut epithelial cell function and affects autism-related behaviors through the gut-brain axis. Transl Psychiatry 13: 305. 10.1038/s41398-023-02611-2
- ↵Christian DL, Wu DY, Martin JR, Moore JR, Liu YR, Clemens AW, Nettles SA, Kirkland NM, Papouin T, Hill CA, 2020. DNMT3A haploinsufficiency results in behavioral deficits and global epigenomic dysregulation shared across neurodevelopmental disorders. Cell Rep 33: 108416. 10.1016/j.celrep.2020.108416
- ↵Danecek P, Bonfield JK, Liddle J, Marshall J, Ohan V, Pollard MO, Whitwham A, Keane T, McCarthy SA, Davies RM, 2021. Twelve years of SAMtools and BCFtools. GigaScience 10: giab008. 10.1093/gigascience/giab008
- ↵Davoudi S, Rahdar M, Hosseinmardi N, Behzadi G, Janahmadi M. 2023. Chronic inhibition of astrocytic aquaporin-4 induces autistic-like behavior in control rat offspring similar to maternal exposure to valproic acid. Physiol Behav 269: 114286. 10.1016/j.physbeh.2023.114286
- ↵de la Torre-Ubieta L, Won H, Stein JL, Geschwind DH. 2016. Advancing the understanding of autism disease mechanisms through genetics. Nat Med 22: 345–361. 10.1038/nm.4071
- ↵De Rubeis S, He X, Goldberg AP, Poultney CS, Samocha K, Cicek AE, Kou Y, Liu L, Fromer M, Walker S, 2014. Synaptic, transcriptional and chromatin genes disrupted in autism. Nature 515: 209–215. 10.1038/nature13772
- ↵Dobin A, Davis CA, Schlesinger F, Drenkow J, Zaleski C, Jha S, Batut P, Chaisson M, Gingeras TR. 2013. STAR: ultrafast universal RNA-seq aligner. Bioinformatics 29: 15–21. 10.1093/bioinformatics/bts635
- ↵Ernst J, Kellis M. 2017. Chromatin-state discovery and genome annotation with ChromHMM. Nat Protoc 12: 2478–2492. 10.1038/nprot.2017.124
- ↵Fu JM, Satterstrom FK, Peng M, Brand H, Collins RL, Dong S, Wamsley B, Klei L, Wang L, Hao SP, 2022. Rare coding variation provides insight into the genetic architecture and phenotypic context of autism. Nat Genet 54: 1320–1331. 10.1038/s41588-022-01104-0
- ↵Gao Y, Duque-Wilckens N, Aljazi MB, Wu Y, Moeser AJ, Mias GI, Robison AJ, He J. 2021. Loss of histone methyltransferase ASH1L in the developing mouse brain causes autistic-like behaviors. Commun Biol 4: 756. 10.1038/s42003-020-01566-0
- ↵Geng Y, Zhang T, Alonzo IG, Godar SC, Yates C, Pluimer BR, Harrison DL, Nath AK, Yeh J-RJ, Drummond IA, 2022. Top2a promotes the development of social behavior via PRC2 and H3K27me3. Sci Adv 8: eabm7069. 10.1126/sciadv.abm7069
- ↵Huang T-N, Yen T-L, Qiu LR, Chuang H-C, Lerch JP, Hsueh Y-P. 2019. Haploinsufficiency of autism causative gene Tbr1 impairs olfactory discrimination and neuronal activation of the olfactory system in mice. Mol Autism 10: 5. 10.1186/s13229-019-0257-5
- ↵Hurley S, Mohan C, Suetterlin P, Ellingford R, Riegman KLH, Ellegood J, Caruso A, Michetti C, Brock O, Evans R, 2021. Distinct, dosage-sensitive requirements for the autism-associated factor CHD8 during cortical development. Mol Autism 12: 16. 10.1186/s13229-020-00409-3
- ↵Iossifov I, O'Roak BJ, Sanders SJ, Ronemus M, Krumm N, Levy D, Stessman HA, Witherspoon KT, Vives L, Patterson KE, 2014. The contribution of de novo coding mutations to autism spectrum disorder. Nature 515: 216–221. 10.1038/nature13908
- ↵King IF, Yandava CN, Mabb AM, Hsiao JS, Huang H-S, Pearson BL, Calabrese JM, Starmer J, Parker JS, Magnuson T, 2013. Topoisomerases facilitate transcription of long genes linked to autism. Nature 501: 58–62. 10.1038/nature12504
- ↵Kolberg L, Raudvere U, Kuzmin I, Vilo J, Peterson H. 2020. gprofiler2: an R package for gene list functional enrichment analysis and namespace conversion toolset g:Profiler. F1000Res 9: ELIXIR-709. 10.12688/f1000research.24956.2
- ↵Koopmans F, van Nierop P, Andres-Alonso M, Byrnes A, Cijsouw T, Coba MP, Cornelisse LN, Farrell RJ, Goldschmidt HL, Howrigan DP, 2019. SynGO: an evidence-based, expert-curated knowledge base for the synapse. Neuron 103: 217–234.e4. 10.1016/j.neuron.2019.05.002
- ↵Korotkevich G, Sukhov V, Budin N, Shpak B, Artyomov MN, Sergushichev A. 2021. Fast gene set enrichment analysis. bioRxiv 10.1101/060012
- ↵Langfelder P, Horvath S. 2008. WGCNA: an R package for weighted correlation network analysis. BMC Bioinformatics 9: 559. 10.1186/1471-2105-9-559
- ↵Lavery WJ, Barski A, Wiley S, Schorry EK, Lindsley AW. 2020. KMT2C/D COMPASS complex-associated diseases [KCDCOM-ADs]: an emerging class of congenital regulopathies. Clin Epigenetics 12: 10. 10.1186/s13148-019-0802-2
- ↵Law CW, Chen Y, Shi W, Smyth GK. 2014. voom: precision weights unlock linear model analysis tools for RNA-seq read counts. Genome Biol 15: R29. 10.1186/gb-2014-15-2-r29”
- ↵Li J, Pinto-Duarte A, Zander M, Cuoco MS, Lai C-Y, Osteen J, Fang L, Luo C, Lucero JD, Gomez-Castanon R, 2022. Dnmt3a knockout in excitatory neurons impairs postnatal synapse maturation and increases the repressive histone modification H3K27me3. eLife 11: e66909. 10.7554/eLife.66909
- ↵Love MI, Huber W, Anders S. 2014. Moderated estimation of fold change and dispersion for RNA-seq data with DESeq2. Genome Biol 15: 550. 10.1186/s13059-014-0550-8
- ↵Moore SM, Seidman JS, Ellegood J, Gao R, Savchenko A, Troutman TD, Abe Y, Stender J, Lee D, Wang S, 2019. Setd5 haploinsufficiency alters neuronal network connectivity and leads to autistic-like behaviors in mice. Transl Psychiatry 9: 24. 10.1038/s41398-018-0344-y
- ↵Mullegama SV, Elsea SH. 2016. Clinical and molecular aspects of MBD5-associated neurodevelopmental disorder (MAND). Eur J Hum Genet 24: 1235–1243. 10.1038/ejhg.2016.35
- ↵Nakamura T, Yoshihara T, Tanegashima C, Kadota M, Kobayashi Y, Honda K, Ishiwata M, Ueda J, Hara T, Nakanishi M, 2024. Transcriptomic dysregulation and autistic-like behaviors in Kmt2c haploinsufficient mice rescued by an LSD1 inhibitor. Mol Psychiatry 29: 2888–2904. 10.1038/s41380-024-02479-8
- ↵O'Roak BJ, Vives L, Girirajan S, Karakoc E, Krumm N, Coe BP, Levy R, Ko A, Lee C, Smith JD, 2012. Sporadic autism exomes reveal a highly interconnected protein network of de novo mutations. Nature 485: 246–250. 10.1038/nature10989
- ↵Parikshak NN, Luo R, Zhang A, Won H, Lowe JK, Chandran V, Horvath S, Geschwind DH. 2013. Integrative functional genomic analyses implicate specific molecular pathways and circuits in autism. Cell 155: 1008–1021. 10.1016/j.cell.2013.10.031
- ↵Rajarajan P, Borrman T, Liao W, Schrode N, Flaherty E, Casiño C, Powell S, Yashaswini C, LaMarca EA, Kassim B, 2018. Neuron-specific signatures in the chromosomal connectome associated with schizophrenia risk. Science 362: eaat4311. 10.1126/science.aat4311
- ↵R Core Team. 2018. R: a language and environment for statistical computing. R Foundation for Statistical Computing, Vienna. https://www.R-project.org/.
- ↵Ritchie ME, Phipson B, Wu D, Hu Y, Law CW, Shi W, Smyth GK. 2015. limma powers differential expression analyses for RNA-sequencing and microarray studies. Nucleic Acids Res 43: e47. 10.1093/nar/gkv007
- ↵Robinson MD, McCarthy DJ, Smyth GK. 2010. edgeR: a Bioconductor package for differential expression analysis of digital gene expression data. Bioinformatics 26: 139–140. 10.1093/bioinformatics/btp616
- ↵Robinson JT, Thorvaldsdóttir H, Winckler W, Guttman M, Lander ES, Getz G, Mesirov JP. 2011. Integrative genomics viewer. Nat Biotechnol 29: 24–26. 10.1038/nbt.1754
- ↵Rossignol DA, Frye RE. 2012a. A review of research trends in physiological abnormalities in autism spectrum disorders: immune dysregulation, inflammation, oxidative stress, mitochondrial dysfunction and environmental toxicant exposures. Mol Psychiatry 17: 389–401. 10.1038/mp.2011.165
- ↵Rossignol DA, Frye RE. 2012b. Mitochondrial dysfunction in autism spectrum disorders: a systematic review and meta-analysis. Mol Psychiatry 17: 290–314. 10.1038/mp.2010.136
- ↵Satterstrom FK, Kosmicki JA, Wang J, Breen MS, Rubeis SD, An J-Y, Peng M, Collins R, Grove J, Klei L, 2020. Large-scale exome sequencing study implicates both developmental and functional changes in the neurobiology of autism. Cell 180: 568–584.e23. 10.1016/j.cell.2019.12.036
- ↵Schrode N, Ho S-M, Yamamuro K, Dobbyn A, Huckins L, Matos MR, Cheng E, Deans PJM, Flaherty E, Barretto N, 2019. Synergistic effects of common schizophrenia risk variants. Nat Genet 51: 1475–1485. 10.1038/s41588-019-0497-5
- ↵Shen W, Krautscheid P, Rutz AM, Bayrak-Toydemir P, Dugan SL. 2019. De novo loss-of-function variants of ASH1L are associated with an emergent neurodevelopmental disorder. Eur J Med Genet 62: 55–60. 10.1016/j.ejmg.2018.05.003
- ↵Sullivan PF, Geschwind DH. 2019. Defining the genetic, genomic, cellular, and diagnostic architectures of psychiatric disorders. Cell 177: 162–183. 10.1016/j.cell.2019.01.015
- ↵Thudium S, Palozola K, L'Her É, Korb E. 2022. Identification of a transcriptional signature found in multiple models of ASD and related disorders. Genome Res 32: 1642–1654. 10.1101/gr.276591.122
- ↵Yu G, Wang L-G, Han Y, He Q-Y. 2012. clusterProfiler: an R package for comparing biological themes among gene clusters. OMICS 16: 284–287. 10.1089/omi.2011.0118
- ↵Zhang X. 2024. Highly effective batch effect correction method for RNA-seq count data. Comput Struct Biotechnol J 27: 58–64. 10.1016/j.csbj.2024.12.010
- ↵Zhang B, Horvath S. 2005. A general framework for weighted gene co-expression network analysis. Stat Appl Genet Mol Biol 4: Article17. 10.2202/1544-6115.1128
- ↵Zhao Y-T, Kwon DY, Johnson BS, Fasolino M, Lamonica JM, Kim YJ, Zhao BS, He C, Vahedi G, Kim TH, 2018. Long genes linked to autism spectrum disorders harbor broad enhancer-like chromatin domains. Genome Res 28: 933–942. 10.1101/gr.233775.117