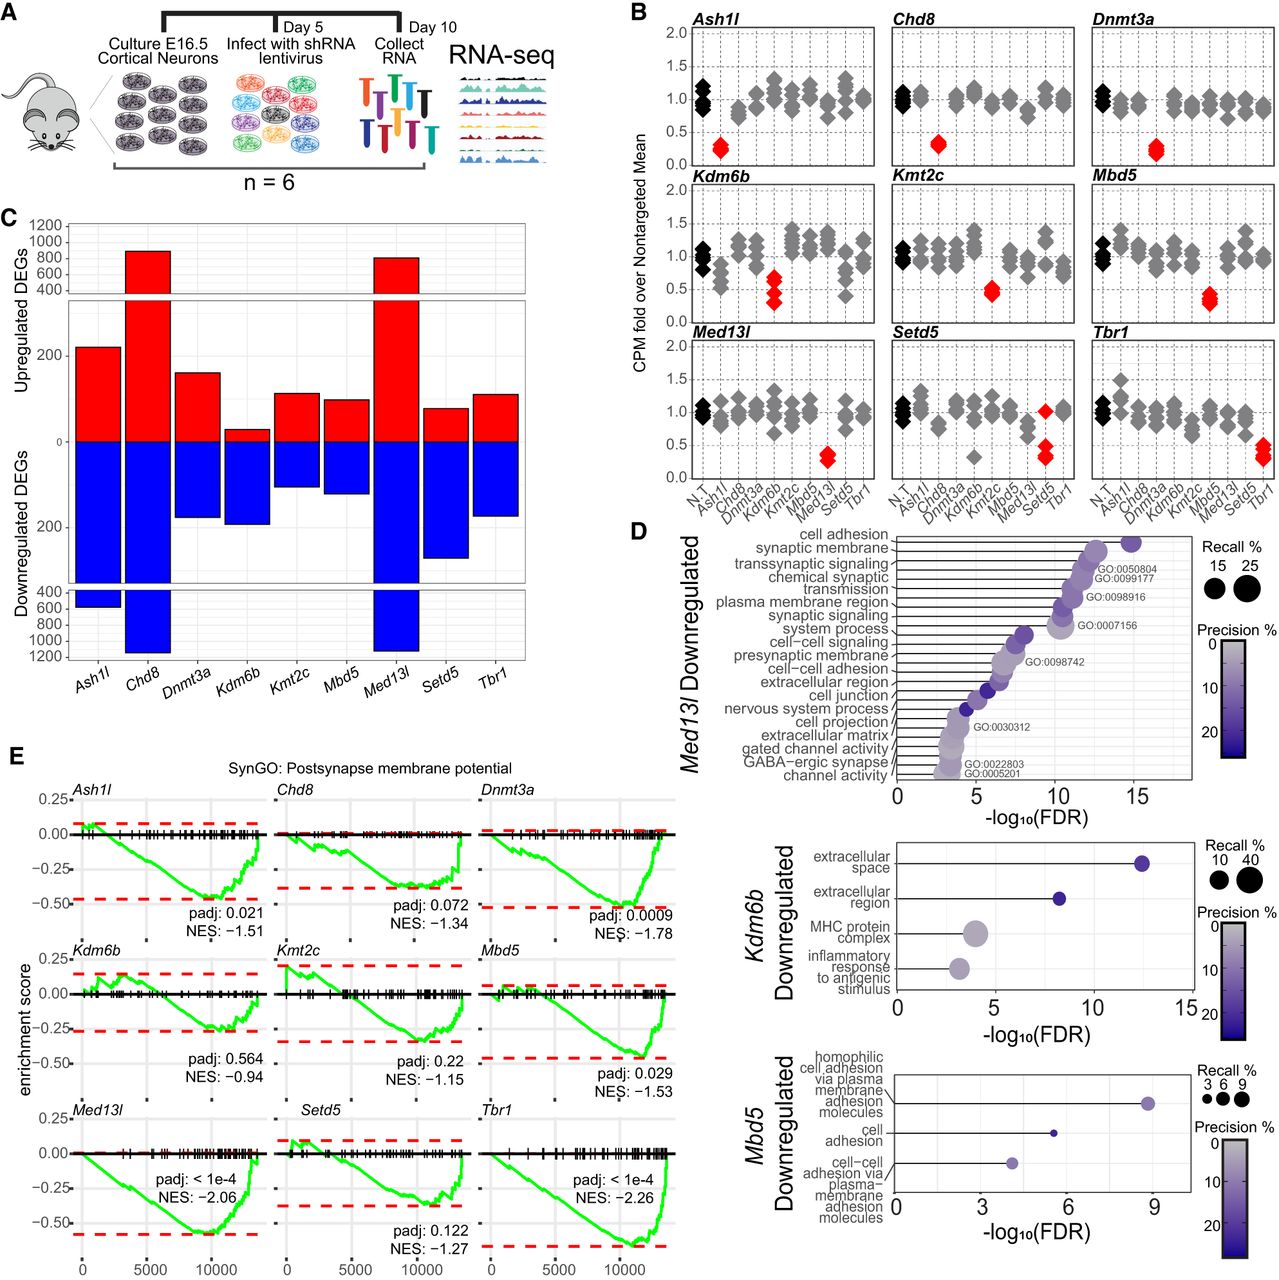
Gene expression analysis of nine independent chromatin modifier depletions in primary mouse neurons. (A) Schematic of the experimental time line for the comparison of transcriptomes between chromatin modifier depletions. (B) Counts per million (CPM) for the nine chromatin modifiers following lentivirus-mediated shRNA depletion of each target, relative to the average of nontargeting (N.T.)-treated neurons (n = 6). Red shows significant changes. Gray indicates that no others pass statistical significance by the DESeq2 negative binomial distribution with multiple testing correction. (C) Total up- or downregulated differentially expressed genes (DEGs) in the pairwise comparison of each depletion versus N.T.-treated neurons. For full DEG lists, see Supplemental Table S3. (D) Gene Ontology analysis of significantly downregulated gene sets. Recall is the proportion of functionally annotated genes in the query over the number of genes in the GO term. Precision is the number of genes found in the GO term over the total number of genes in the query. For results for other targets, see Supplemental Table S4. (E) GSEA of genes in the SynGO postsynaptic membrane potential term for each depletion transcriptional signature. The green line is the running, normalized enrichment score across all genes ranked by their change in expression from most increased at one to least increased. The red dotted lines specify the maximum and minimum running enrichment score per depletion. (NES) Directional normalized enrichment score across all genes.