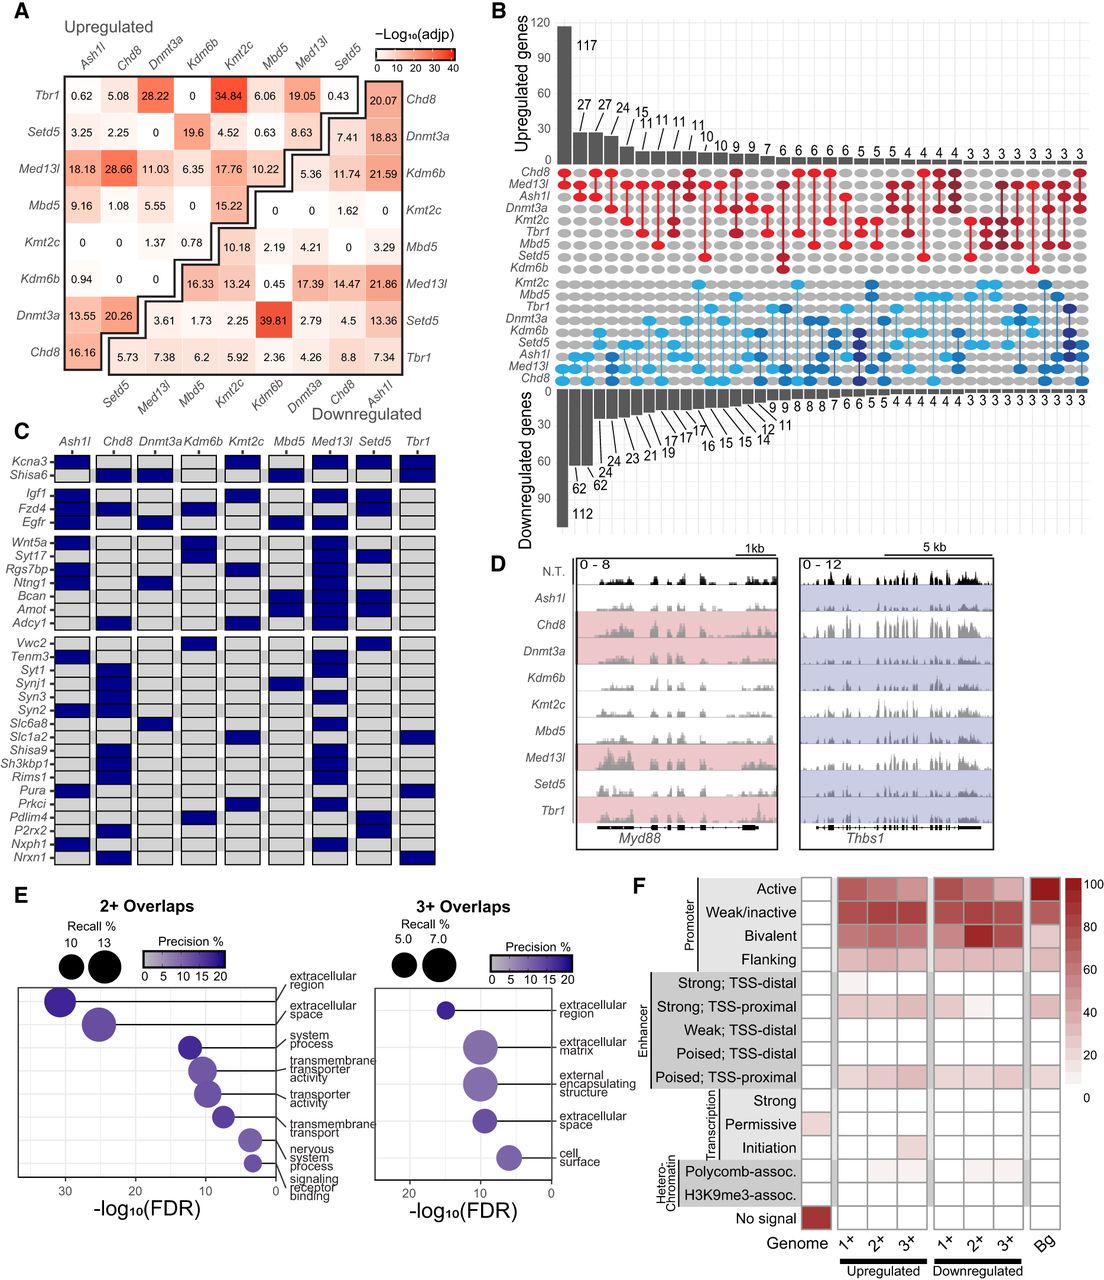
Identifying transcripts that are co-dysregulated across depletions. (A) Significance of overlap for up- or downregulated DEGs after each depletion using hypergeometric tests. (B) Upset plot of up- or downregulated DEGs found in at least two depletions. Gene placement prioritizes the largest intersection possible, only showing overlaps with three or more DEGs. The darker colors correspond to a greater overlap degree. (C) DEGs that appear in at least two comparisons between depletion and the N.T. control (in blue). (D) Gene tracks of aligned transcripts over genes that were either upregulated (Myd88) or downregulated (Thbs1) in multiple depletions. (E) Gene Ontology analysis of all significantly downregulated genes found in at least two or three depletion conditions. (F) ChromHMM analysis of promoters (500 bp upstream of transcription start sites [TSSs]) of significantly up- or downregulated genes found in at least one, two, or three depletions. (Bg) All genes expressed in primary mouse neurons at DIV10.