
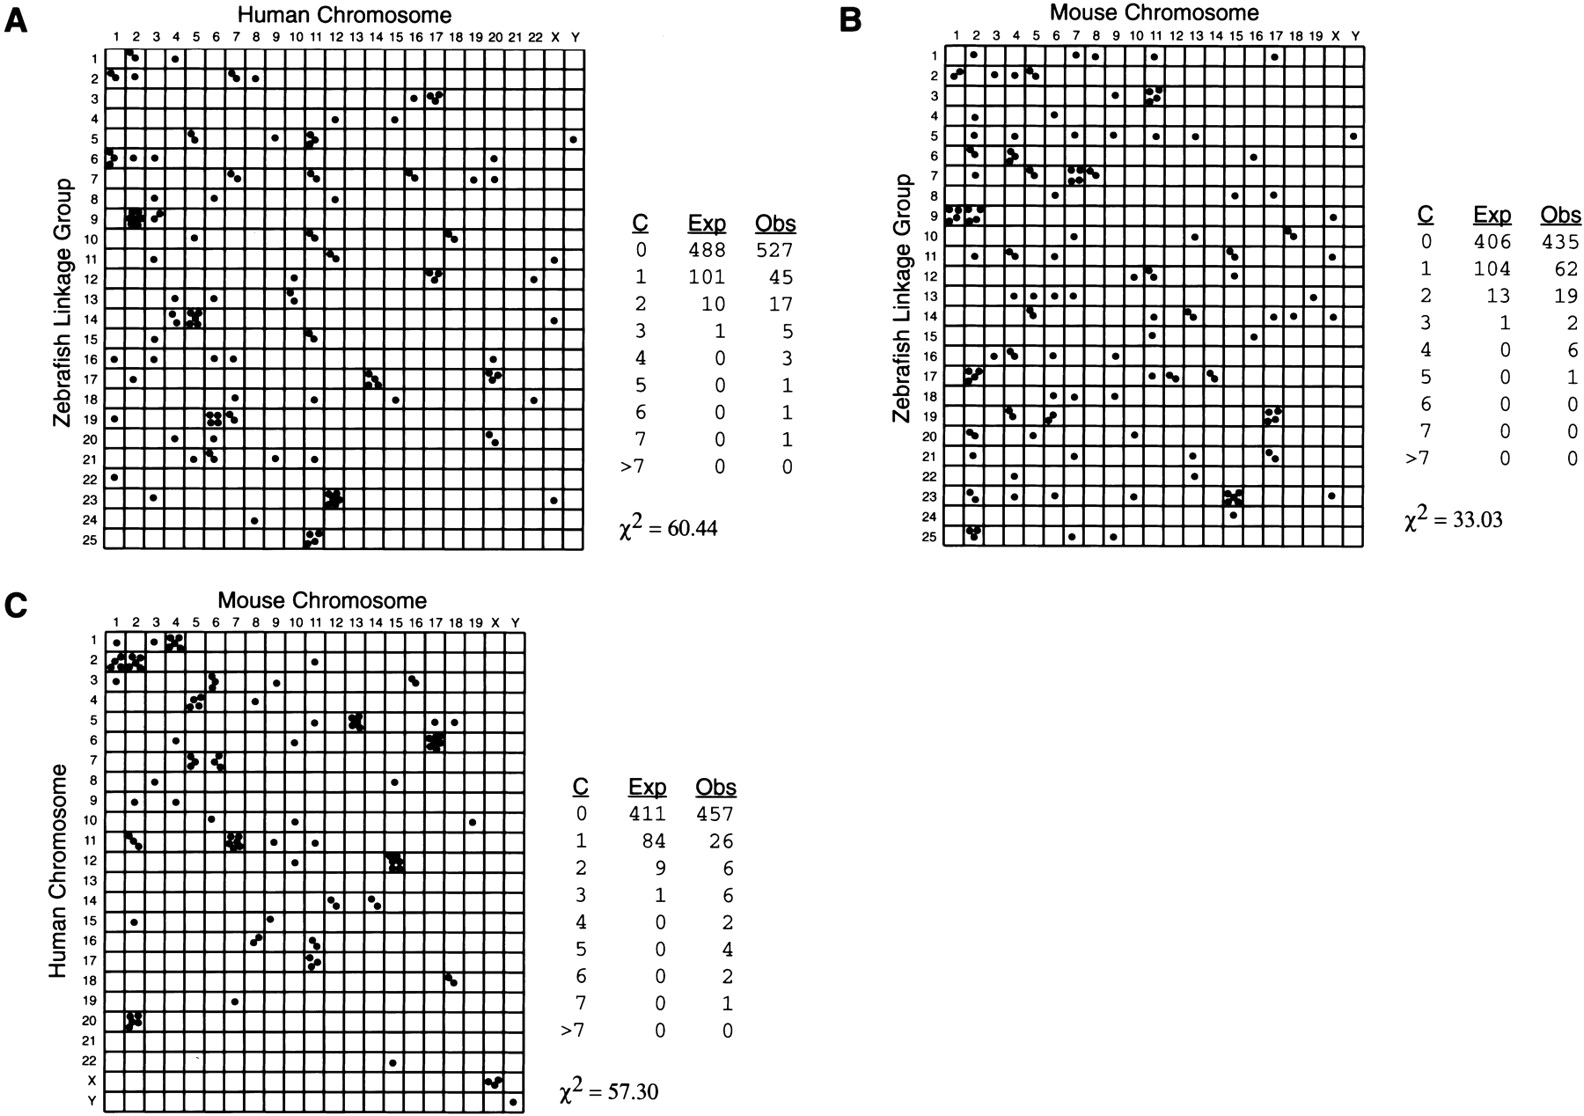
Conservation of synteny among zebrafish, human, and mouse. Each point in the Oxford grids represents an othologous gene pair plotted by map position in the two organisms compared. Conserved syntenies are evident as bins containing more than one point. (A) Comparison between zebrafish and human. (B) Comparison between zebrafish and mouse. (C) Comparison between human and mouse. Orthology relationships and map positions used to construct the Oxford grids are shown in Tables 1 and 3, except for the zebrafish Hox clusters whose orthology and position are from Amores et al. (1998). For tandem clusters of Hox, globin, and MHC genes, each cluster is represented by a single point in the Oxford grid and in the Poisson calculations. Tables associated with each grid evaluate the statistical significance of conserved syntenies. (C) Classes of bins according to the number of genes that occupy the bin; (Exp) the expected number of occurrences of bins in each class (see Methods for Poisson calculation); (Obs) the actual number we observed. To calculate the χ2 value, the Exp and Obs were assigned to three categories, corresponding to classes of bins with 0, 1, or >1 gene occupying the bin. For 1 degree of freedom, a χ2 > 6.64 implies a significant difference at a level P < 0.01.


