
A Cluster of ABA-Regulated Genes on Arabidopsis thaliana BAC T07M07
Abstract
Arabidopsis thaliana BAC T07M07 encoding the abscisic acid-insensitive 4 (ABI4) locus has been sequenced completely. It contains a 95,713-bp insert and 24 predicted genes. Most putative genes were confirmed by gel-based RNA profiling and a cluster of ABA-regulated genes was identified. One of the 24 genes, designatedPP2C5, encodes a putative protein phosphatase 2C. The encoded protein was expressed in Escherichia coli, and its enzyme activity in vitro was confirmed.
[The sequence data described in this paper have been submitted to GenBank under accession no. AF085279.]
Sequencing the entire genomes of model organisms is fundamentally shifting the way we study gene expression and function. Traditionally, the search for gene function started with a phenotypic mutant and proceeded to gene cloning and functional analysis—“from phenotype to gene”. Now, as genome sequencing is revealing the whole genotype of an organism, in principle, a reverse approach can be taken—“from gene to phenotype” (reverse genetics). Rather than studying a single gene’s function and expression, with the use of sequence arrays one can view the genome as a whole to study multiple genes’ function and expression (functional genomics) (DeRisi et al. 1997; Rowen et al. 1997).
Arabidopsis thaliana is an excellent plant organism for both genome and biological studies because of its small genome size, small physical size, and short life cycle (Meyerowitz 1994; Goodman et al. 1995). In addition, an international effort has been established for sequencing the A. thaliana genome (Kaiser 1996). We have been concentrating our efforts on Arabidopsis chromosome 2. We constructed a yeast artificial chromosome (YAC) physical map for chromosome 2 (Zachgo et al. 1996) and in a 2-Mb region in the vicinity of 80 cM, a higher resolution physical map composed primarily of bacterial artificial chromosome (BAC) clones (Wang et al. 1997). This 2-Mb region is being sequenced in collaboration with The Institute for Genome Research (TIGR). As part of this effort, we have sequenced several BACs on chromosome 2, and have begun to examine the encoded genes. Different software and database search tools (Xu et al. 1994;Burge and Karlin 1997) were used for gene prediction. Prior to functional studies, a gel-based RNA profiling method was used to confirm whether these putative genes were indeed expressed. In general, the model that emerged by comparison of all the predictions was in good agreement with the experimental data. We report here the sequence of BAC T07M07, prediction of putative genes, confirmation by gel-based RNA profiling, and identification of a cluster of ABA-regulated genes on this BAC.
RESULTS
Subcloning and Sequencing of BAC DNA
Random fragmentation of high molecular weight (HMW) BAC DNA and size selection were critical for obtaining a complete set of sequencing clones. An initial T07M07 library created from a nebulized DNA sample with a broad range of size fragments (0.5–4.0 kb) did not appear to be random, as sequence assembly from 1269 reads formed deep, but not extended contigs. A second successful library used less DNA (4 vs. 6 μg) and nebulization produced a more narrow range of fragment sizes (primarily 0.5–1.6 kb). From this second library, three contigs were assembled from 2211 reads prior to gap closure by directed sequencing. Bacterial contamination as judged by blast matches was ∼1% to 2%, a number lower than that reported for the yeast genomic DNA contamination (∼9%) when sequencing libraries were constructed fromCaenorhabditis elegans YAC DNA (Vaudin et al. 1995).
Structural Features of the Sequenced BAC T07M07
BAC T07M07 contained a 95,713-bp insert (GenBank accession no.AF085279). The generally high A+T content of A. thaliana was reflected in this BAC that had a level of 64.9%. Overall, this BAC was devoid of repetitive sequences and did not contain any CpG islands (CG-rich regions) commonly found in human sequences. This was consistent with our fingerprint and Southern hybridization results (M.L. Wang, unpubl.). Working primarily from the Grail predictions, genes were spaced relatively evenly every ∼4.0 kb (average 3988 bp). In one exceptional region, between basepair positions 2300 and 11,400, there were no predicted genes and no significant blast sequence similarities. Most genes (17 of 24 predicted genes) contained introns, with an average intron size of 141 nucleotides (range 24–723). Of the genes with introns, the average number of introns in a gene was 4 (range 1–9). The average exon size for the 7 predicted genes without introns was 1091 bp (range 528–1794), whereas for the 17 predicted genes with introns, it was 217 bp (range 35–1352). For genes with introns, the average size of the gene was 1759 bp (range 376–3505), and the average predicted amino acid coding region was 1149 bp (range 209–2397). The genes were distributed evenly on the upper and lower strands.
Identifying Gene Function by Sequence Similarity
A summary of the results of blast analysis of the BAC sequence is shown in Table 1. These putative genes can be classified into five groups: (1) identical to knownArabidopsis genes [2 genes, gene 5 identical toAtEm6 and gene 10 identical to ABI4(abscisic acid insensitive 4)]; (2) similar to an Arabidopsis EST or an Arabidopsispredicted protein (11 genes, 3, 4, 9, 12, 13, 14, 16, 19, 22, 23, and24); (3) similar to other plant sequences (6 genes, 2, 6, 8, 11, 15, and 18); (4) similar to nonplant sequences but with no significant match to plant sequences (4 genes, 1, 7, 17, and21); (5) not similar to any database sequence (1 gene, 20).
Predicted Genes Encoded by BAC T07M07
Of the 24 predicted genes, 15 genes had matches with a level of significance (P < 1.0 e−20) that suggested that they might have a function related to their matched sequences. We would not normally consider a BLASTP P_value in the range of 0.001–0.0001 as significant. However, it is worth noting that the best two matches to gene 21 (mouse cation-dependent mannose-6-phosphate receptor and a Schizosaccharomyces pombehypothetical protein) were to the same region of the gene, and many of the residues that were conserved between sequences were conserved in all three proteins. The match region included part of the mouse receptor’s transmembrane domain and cytoplasmic tail which (in the bovine homolog) is important to proper trafficking of the protein (Rohrer et al. 1995). It is interesting that two small gene families seem to be present on the BAC. The first, genes, 4 and22, produced significant matches to the same set of hypothetical proteins. The second, represented by ABI4 and gene 24, both contain the AP2 DNA-binding motif. Finally, one predicted gene had no significant match to any known gene. Some putative genes (3, 5, and 15) are probably highly expressed, because several ESTs were identified (data not shown).
ABI4 and AtEm6 are both regulated by ABA.AtEm6 (gene 5) is ABA-inducible and highly expressed in immature and dry seeds (Finkelstein 1993; Gaubier et al. 1993). Interestingly, database searching identified another potential ABA-related gene, 6, that has homology to ABI1 andABI2 and is tentatively designated as PP2C5. BothABI1 and ABI2 are protein phosphatase 2C (PP2C) proteins and have a high degree of sequence similarity to one another. Mutants in ABI1 and ABI2 have identical amino acid substitutions (Gly → Asp) in the same relative positions, residues 168 and 180, respectively (Leung et al. 1997). The amino acids in the ABI1 and ABI2 mutated region, as well as in the other metal and the phosphate-binding sites, are also conserved inPP2C5 (Fig. 5, below). The closest BLAST match (GenBank release 107) to the predicted PP2C5 amino acid sequence was toMSMP2C, a PP2C from alfalfa shown to be active in the stress-activated MAPK pathway (Meskiene et al. 1998). The other significant Arabidopsis matches to PP2C5 identified through database searching included the recently described AtP2C–HA (Rodriguez 1998; GenBank accession no. 3242077) and AthPP2Ca, a PP2C gene identified through yeast complementation studies (Kuromori and Yamamoto 1994; GenBank accession no. D38109).
Peptide sequence comparison of PP2C genes. Multiple sequence alignment of PP2C5 to Medicago sativa MSMP2C (Y11607) and A. thaliana PP2C proteins; ABI1 (GenBank accession no. X77116), ABI2 (Y08965), AtP2C-HA (ATAJ3119), and ATHPP2Ca (D38109). Note the high level of conservation at the putative phosphate-binding site (○), putative metal binding sites (●) and the position of the ABI1 and ABI2 mutation (■). Sites were determined from homology to previously characterized PP2C proteins (Leung et al. 1994, 1997; Meyer et al. 1994; Das et al. 1996). Shading, on the basis of the PP2C5 sequence, shows conserved residues with a black background and similar residues with a gray background.
Confirmation of Putative Genes by Reverse Northern Analysis
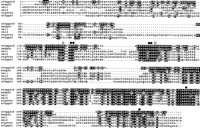
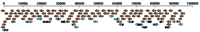
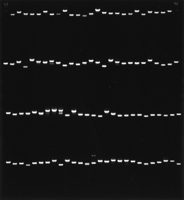
The positions of the putative genes relative to a minimal set of plasmid sequencing subclones of BAC T07M07 are schematically shown in Figure 1. Most of the putative genes spanned two to four plasmid clones, and individual plasmid clones represented only two putative genes (5 and 20). DNA fragments amplified from the plasmid clones by PCR using primers designed from the pBluescript II KS+ vector sequences were checked on a 1% agarose gel (Fig. 2). As shown in Figure 2, PCR was highly specific. A single major band was amplified from most plasmid clones (a minor second band was observed for only three clones that may have come from amplification of contaminating DNA templates). After gel electrophoresis, the amplified DNA was transferred to a nylon membrane and hybridized with a single-stranded cDNA probe synthesized from wholeArabidopsis seedling poly(A) RNA. The expression signals seen in the reverse Northern analysis (gel-based RNA profiling, Fig.3) of nine putative genes (1, 5, 6, 11, 17, 18, 20, 21, and 23) were as predicted. For 15 of the predicted genes, the expression signals were in the expected region but either extended into slightly different plasmid clones or showed uneven signals across the plasmid clones. These differences may be explained, at least in part, by the presence in the probe of the 5′- and 3′-untranslated regions of the corresponding mRNA that could hybridize and extend the region of hybridization beyond that predicated by the computer programs and/or the existence of nonhybridizing nonpredicted introns within the genomic fragments. However, in addition to the expected regions of expression, there were expression signals in some regions of the BAC (N1–N5) that were not predicted to encode genes on the basis of the gene finding software. For example, there was no putative gene prediction in the region between 2300–11,400 bp, but there were clear hybridization signals (N1) in this region.
Relative positions of putative genes and plasmid clones sequenced on BAC T07M07. (Brown arrows) Plasmid clones; (blue arrows) predicted genes with arrowheads indicating the direction of transcription. Bent lines between the blue exons indicate predicted introns. The scale is in base pairs.
Amplified DNA fragments and putative genes on BAC T07M07. A minimal set of 104 sequencing clone inserts were amplified with primers designed from the pBluescript II KS+ vector sequences. The DNA samples were electrophoresed for 30 min at 60 V in a 1% agarose gel and stained with ethidium bromide. A 1-kb ladder is in each corner lane of the first row. The DNA samples for each set were loaded on the gel in the order corresponding to their positions on the BAC (Fig. 1).
Gene expression profile of BAC T07M07 as determined by reverse Northern (gel-based RNA profiling). Following electrophoresis, DNA samples (see Fig. 2) were transferred onto a nylon membrane and the blot was hybridized to a single-stranded cDNA probe synthesized from wholeArabidopsis seedling poly(A) RNA. Hybridization signals indicate the presence of a transcript from the cloned region or gene region (with the caveat that transcripts from genes of similar sequence may also cross-hybridize). Dashed lines indicate the positions of predicted genes numbered above the line. Arrows indicate that the predicted gene extends to the next row. Small numbers mark the DNA sample in every tenth lane. New (N) indicates expression from regions not predicted to encode a gene. A Actin gene (A) used as an internal control for gene expression.
Because there were two characterized ABA-regulated genes identified on this BAC, we examined the entire BAC for genes whose expression was regulated by ABA. Using probes developed from RNA isolated from ABA treated or water (control) treated plants, we found by reverse Northern analysis that gene 3, a zinc finger protein, was also ABA responsive (data not shown, but see Northern analysis below). We have thus identified a small cluster of three ABA-regulated genes, located within 25 kb on BAC T07M07.
Confirmation of Putative Genes by Northern Analysis
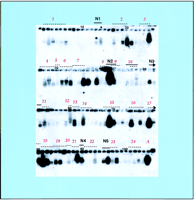
To verify the results of reverse Northern analysis, three ABA-regulated genes (3, 5, and 10) and one unregulated gene (15, as a control) were chosen for standard Northern analysis (Fig.4). Transcripts (2.0, 0.7, 1.8, and 2.5 kb) were detected for genes 3, 5, 10, and 15, respectively, confirming the results of the reverse Northern analysis. Relative to the control water treatment, gene 3 (zinc finger protein) expression was repressed (approximately threefold) by ABA at the seedling stage (Fig. 4, lane 2) but not at the flowering or silique stages (Fig. 4, lanes 4 and 6, respectively). Gene 5 (AtEm6, late embryogenesis abundant protein) expression was induced (∼3- to 10-fold) by ABA at the seedling and flowering stages; however, at the silique stage, it is highly expressed in both control and ABA-treated plants. Gene10 (ABI4, regulatory protein) expression was induced (approximately two- to threefold) by ABA at the flowering and silique stages but not at the seedling stage, at which there was a high level of expression in both the control and treated plants. Gene 15was not responsive to ABA treatment (only seedling stage data shown).
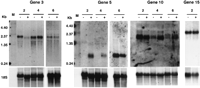
Level of RNA regulated by ABA treatment in selected putative genes. Total RNAs were isolated from tissues of 2-, 4-, and 6-week-old plants (seedling, flowering, and silique stages, respectively) and probed with gene-specific DNAs. (Lane M) RNA marker; (−) water-treated plants; (+) ABA-treated plants. The main hybridization bands corresponded to the transcripts predicted for each putative gene. The18S rDNA hybridization band serves as a sample loading control.
Functional Analysis of PP2C5 in Vitro
The coding region of PP2C5 (Fig. 5) was amplified by PCR from a cDNA library with primers designed from the predicted gene sequence. The amplified DNA fragment was cloned and sequenced. Comparison of the cDNA to the genomic sequence exactly confirmed the two predicted splicing sites (data not shown). Recombinant protein encoded by PP2C5 was expressed in E. coli and purified from cell culture by affinity chromatography.PP2C5 encodes an ∼35-kD protein (Fig.6A). Because the enzymatic activity of a PP2C protein is phosphate cleavage, the recombinant protein was assayed by measuring its ability to release 32P into solution from labeled casein. Column-purified labeled casein used as the substrate contained only 1% unincorporated 32P in solution (data not shown). Within 140 min of reaction initiation, a plateau was reached and the enzyme had dephosphorylated close to 30% of the labeled casein when 10 mm Mg2+ and 10 mm Mn2+ were provided in the reaction (Fig. 6B). The enzyme activity was abolished when 20 mm EDTA was added to the solution (Fig. 6B). These results were reproducible in two different experiments and consistent with the activity of other known PP2C enzymes (Stone et al. 1994;Bertauche et al. 1996; Leube et al. 1998; McGowan et al. 1988).
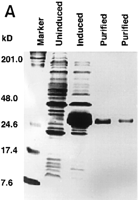
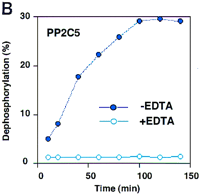
Purification of recombinant protein and enzyme activity assay. (A) Gene expression and protein purification of PP2C5. E. coli containing the recombinant expression plasmid was grown for 3 hr either under inducing or noninducing conditions. Following protein isolation, samples were analyzed on a 12% SDS-polyacrylamide gel. Fromleft to right, the samples were as follows: protein marker (prestained SDS-PAGE standards, Bio-Rad, 25 μg in 20 μl); PP2C5-noninduced total protein (40 μg in 40 μl); PP2C5-induced total protein (40 μg in 40 μl); purified PP2C5 protein (5 μg in 5 μl); and purified PP2C5 protein (2.5 μg in 2.5 μl). (B) Enzymatic activity assay for PP2C. One microgram of purified PP2C5 was used in each reaction. Each experiment was repeated twice. Each value represents the average of the two different experiments. Labeled protein was dephosphorylated at 30°C in a 10-μl solution [containing 50 mm Tris-HCl at pH 7.0, 0.1% (vol/vol) 2-mercaptoethanol, ∼3 × 10⁵ cpm32P-labeled casein, ∼1 μg of recombinant protein, and either 10 mm Mg2+ and 10 mmMn2+ or the same concentration of cations plus 10 mm EDTA]. At each time point (min), 100 μl of 20% trichloroacetic acid (TCA) was added, incubated on ice for 5 min, and microcentrifuged at room temperature for 5 min to precipitate the protein. Radioactivity in 90 μl of supernatant and 20 μl of pellet was measured by scintillation counting. Dephosphorylation was expressed as a percentage of 32P released into the supernatant. (●) −EDTA; (○) +EDTA.
DISCUSSION
Although gene prediction programs continue to improve, it will always be necessary to confirm the existence of the putative genes prior to gene functional studies. For BAC T07M07, the software prediction programs had a stringent bias, all of the predicted genes were confirmed (no false predictions), but several genes were missed. In a strict sense, expression has only been confirmed from the cloned regions, but not the exact exon sequences of the predicted genes. Where genes span an entire clone, there is of course, no concern that the hybridization signal might arise from a neighboring gene. However, we cannot tell from the reverse Northern blots which region of the amplified clone produced the positive hybridization signal. A traditional method to confirm the existence of the computer-predicted genes is to amplify them by PCR, clone, and sequence the clones to compare with genomic sequences. If the putative genes have introns, after cloning and sequencing, the splicing sites are accurately determined (PP2C5 as an example); if the putative genes have no introns, they need to be amplified from total mRNA by RT–PCR (e.g., 3′ rapid amplification of cDNA ends) and then cloned. After sequencing, the presence of a poly(A) tail on the cDNA clone confirms gene expression and eliminates the possibility of genomic DNA contamination as a possible template source. This approach can only confirm gene existence one by one, with a low efficiency, but with high fidelity. The development of DNA-expression chip technology provides a powerful new tool for confirmation of the existence of putative genes. The method we describe here, gel-based RNA profiling (reverse Northern blot) is an alternative to DNA microarray technology. The only difference is spotting expressed sequence tags (ESTs) on glass slides versus transferring amplified genomic DNA fragments from plasmid clones onto nylon membranes. One limitation of the technique relative to DNA microarray technology is lower spotting density, resulting in low rates of data accumulation. Another more fundamental limitation with this technique, as well as microarray technology, is that gene identification relies on mRNA isolated from a limited set of treatment time points and physiological growth stages. mRNAs that are expressed in a small number of cells, for short time periods or at low levels, may be missed in the assay. It is therefore possible that the five genes that were identified on the hybridization but missed by the gene prediction software actually underestimate the number of missed genes. This is a tempting speculation given the large gap between the predicted genes 1 and 2. Despite the limitations, our results demonstrate that gel-based RNA profiling is an efficient method for gene confirmation and is especially useful and practical for conducting experiments on a small scale in laboratories without DNA microarray facilities.
We have made profitable use of the technique to examine changes in mRNA levels following Abscisic acid (ABA) treatment. ABA, a plant phytohormone, regulates many aspects of plant growth and development (such as seed development, dormancy, and germination) and adaptation to environmental stimuli (such as cold, wounding, and water or salt stress). Regulation of ABA-related gene expression in crop plants has the potential to be of agricultural importance. Interestingly, there is a cluster of ABA-regulated genes on this BAC. AtEm6 (gene5) encodes one member of the late embryogenesis-abundant protein (lea) family that is ABA inducible and highly expressed in immature and dry seeds (for review, see Skriver and Mundy 1990). Its expression level is also regulated by some ABIgenes (especially ABI3, ABI4, and ABI5) (Finkelstein 1993, 1994; Parcy et al. 1994). While positional cloningABI4 (Finkelstein et al. 1998), we found that bothABI4 and AtEm6 were located on the same BAC, 17 kb apart from each other. ABI4 (gene 10), a new member of the AP2 domain family, encodes a regulatory protein. Intriguingly, we identified another ABA-related gene in the vicinity of the locusAtEm6. Gene 3 (Cys–3-His zinc finger protein) is 500 bp downstream from AtEm6. Its expression is repressed by ABA at the seedling stage. Gene 6, PP2C5, which has high sequence similarity to ABI1 and ABI2 in the metal and phosphate-binding domains, is also located within the ABA-related cluster (2 kb upstream of AtEm6). However, unlikeABI1 and ABI2 that are up-regulated by ABA treatment, we did not detect a significant PP2C5 response to ABA in the Northern analysis experiments (data not shown). Plant tissue samples for mRNA isolation were collected 24 hr after treatment with ABA; therefore, the gene expression changes identified are probably an indirect response (secondary message) to ABA application. Because the reverse Northern profiling relied on mRNA samples from whole plants, and examined only a limited portion of the life cycle, it is an open question as to whether there are other ABA-regulated genes around theAtEm6 locus. It is an interesting, but as yet unanswered question, whether the spacial proximity of these genes and other genes reflects a functional interaction. One possible approach to answer this question would be to introduce a genomic fragment encompassing all of these genes into transgenic plants. Phenotypic changes might be observed, and changes in other gene expression patterns might be observed on a cDNA microarray (Schena et al. 1995; Lashkari et al. 1997). Such an analysis might help discern the transgene function(s) in vivo. The binary bacterial artificial chromosome (BIBAC) system that has been developed recently for the delivery of HMW DNA into plants (Hamilton et al. 1996) should be useful in this regard.
The reversible phosphorylation of proteins, catalyzed by protein kinases and phosphatases, is a major mechanism for the regulation of many cellular functions from metabolism to signal transduction. PP2C is a Mg2+-dependent enzyme (Ingebritsen and Cohen 1983). There are at least five genes for protein phosphatase 2Cs experimentally characterized in Arabidopsis and several more putative PP2C proteins identified on sequenced Arabidopsis BACs. Although these five gene paralogs for protein phosphatases 2C are all expressed in Arabidopsis, they may not serve a single function, spacial and temporal expression patterns have yet to be completely determined and may be expected to vary between the genes. As shown in Figure 5, the regions of similarity among characterized PP2C proteins is primarily in the carboxy-terminal end and this also appears to be true of the putative PP2C proteins from sequenced BACs (F17I5, F28M20, F21O9, T01B08, T20B5, T29F13; data not shown). It is inviting to speculate that amino-terminal domains will be shown to determine substrate specificity. ABI1, ABI2, ATP2CHA, and ATHPP2C are actually more closely related to each other than alfalfa MsMP2c and PP2C5, suggesting a divergence of functional partners. The three PP2C proteins ABI1, ABI2, and AthPP2Ca have been studied in vivo. In our case, the enzyme activity of PP2C5 was only tested in vitro. Recently, it has been demonstrated that in plants, ABI1, ATHPP2C, andMsMP2c function as negative regulators in ABA or stress-activated MAPK pathways (Meskiene et al. 1998; Sheen 1998). A single cell system (Sheen 1996) is a rapid way to characterize in vivo activity of PP2C5 genes. Expression of PP2C5, perhaps in combination with known kinases or phosphatases in vivo, may provide additional insights into the ABA signal-transduction pathway.
METHODS
DNA Nebulization and Library Construction
BAC T07M07 from the TAMU Arabidopsis library (Choi et al. 1995) was isolated from a 500-ml culture by a modified alkaline lysis method. BAC DNA (4–6 μg) was resuspended in 2 ml of 50 mm Tris (pH 8.0), 15 mm MgCl2, 25% glycerol and transferred into a prepared nebulizer (IPI Medical Products). DNA was nebulized for 150 sec at 30 psi at the tank outlet. The fragmented DNA sample (1800 μl) was collected and concentrated to 400 μl by five to six butanol extractions, precipitated with 2.5 volumes of ethanol (2 hr at −20°C) and pelleted by microcentrifugation at 4°C for 15 min. The DNA pellet was washed with 70% cold ethanol, dried at room temperature and dissolved in ∼100 μl of 1× TE. Ends of the fragmented DNA (∼1.5 μg) were filled in by Pfu DNA polymerase (Stratagene). The reaction solution was loaded onto a 1%, 8-cm-long low melting point (LMP) agarose (Kodak) gel in 1× TBE and subjected to electrophoresis. Gel slices containing DNA fragments ranging from 500 bp to 3.0 kb were excised. The gel was melted at 65°C for 10 min and the agarose digested with β-agarase I (New England Biolabs) at 40°C for 2 hr. The digested agarose solution was chilled on ice for 15 min and microcentrifuged at 4°C for 15 min to pellet any undigested agarose. The supernatant was extracted with an equal volume of phenol/chloroform, then chloroform, and the DNA was precipitated with two volumes of isopropanol. Following centrifugation, the DNA pellet was washed with 70% cold ethanol, dried at room temperature for 15 min, dissolved in 20 μl of 1× TE, and stored at 4°C for later ligation. Bluescript II KS+ vector (Stratagene) DNA was digested with EcoRV at 37°C for 3 hr and dephosphorylated with calf intestinal alkaline phosphatase (CIP) (NEB). The dephosphorylated vector DNA (∼100 ng) was mixed with the size-selected BAC DNA (∼100 ng) and ligated with T4 DNA ligase (NEB) at 16°C overnight. After ligation, the ligase was heat inhibited at 65°C for 10 min. DNA in the ligation solution was electrotransformed into E. coli DH5α-competent cells by use of a Bio-Rad gene pulser. Transformants were recovered in 1 ml of SOC (2% Bacto-tryptone, 0.5% Bacto-yeast extract, 10 mm NaCl, 2.5 mm KCl, 10 mm MgCl2, 10 mm MgSO4, 10 mm glucose) at 37°C with shaking at 300 rpm for 1 hr. Transformants in the recovery solution were mixed with an equal volume of 30% glycerol, divided into aliquots (100 μl), and stored at −80°C for later use.
DNA Sequencing
The frozen transformant stock was thawed briefly and diluted 50 times with LB liquid medium and then plated onto selective LB agar plates containing 50 μg/ml ampicillin. Recombinants were identified with a blue-white (X-gal and IPTG indicator) screening system. White colonies were inoculated into 96-well titer plates (each well containing 1.3 ml of liquid LB medium) and cultured at 37°C with shaking at 300 rpm for 22 hr. Plasmid DNA was isolated by rapid extraction alkaline plasmid kits (QIAGEN) and dissolved in 50 μl of double-distilled water for later use as DNA-sequencing templates. DNA was sequenced on an ABIprism 377 DNA sequencer by dye terminator chemistry as described by the manufacturer (Perkin Elmer). The Phred, Phrap, and Consed sequence assembly and viewing programs (Ewing and Green 1998; Ewing et al. 1998; Gordon et al. 1998) were used to remove BAC vector sequences and to assemble contigs. After large sequence contigs were assembled and only two gaps remained, the gaps were closed by amplifying the intervening DNA by PCR from the original BAC DNA with primers on the basis of adjacent sequences.
Gene Prediction
Putative genes were identified by a combination of three gene-prediction programs. Grail (Xu et al. 1994) was run with client server software and selecting for Arabidopsis as the DNA source. Gene assembly for the Grail program requires the investigator to define a region of the DNA sequence to assemble. This was done somewhat subjectively on the basis of the clustering of the predicted exons. Genscan (Burge and Karlin 1997) was run with theArabidopsis organism option and an exon cutoff of 1.0. Genefinder (P. Green, pers. comm.) was run with theArabidopsis tables developed by ESSA (European Scientists Sequencing Arabidopsis). As partial confirmation of the predicted genes, the BAC sequence was compared with sequences deposited in GenBank by use of blastn and blastx, and translations of the predicted genes were compared by use of blastp (Altschul et al. 1990;Gish et al. 1993).
Amplification from the BAC Sequences; Northern and Reverse Northern Analysis
Minimum-overlapping plasmid clones were selected and insert DNAs were amplified by use of primers designed from pBluescript II KS+ vector sequences. The DNA concentration in PCR was quantified, 1 μg of DNA was electrophoresed on a 1% agarose gel for 30 min, and DNA fragments were transferred onto a nylon membrane (Biodyne, Pal Biosupport, East Hills, NY; 0.45 μm) by alkaline transfer. These blots were used for reverse Northern analysis. Tissue was collected from 2-, 4-, and 6-week-old glass-house-grown whole plants 24 hr following spraying with water (control) or ABA (100 μM), immediately frozen in liquid nitrogen, and stored at −80°C. Stage-specific, total or poly(A) RNA were isolated with Trizol (GIBCO-BRL) and the Oligotex mRNA mini kit (Qiagen). Total RNA for each sample (10 μg) was separated on a 1% agarose gel and transferred onto a nylon membrane. For reverse Northern analysis, a labeled single-stranded cDNA probe was synthesized from wholeArabidopsis seedling poly(A) RNA and used as probes on Southern blots containing DNA fragments covering the whole BAC T07M07. After hybridization, the blots were washed four times at 65°C for 15 min with 40 mm Na2HPO4 (pH 7.2), 1% SDS, and 1 mm EDTA (pH 8.0). For Northern analysis, DNA fragments encompassing putative genes were amplified from BAC T07M07, labeled by [α-32P]dATP and used as probes for hybridization. Primers were designed on the basis of the sequences of putative genes from start codons to stop codons and synthesized in the Department of Molecular Biology core facility. The blots were washed with 1× SSC, 0.1% SDS, at 65°C for 15 min twice; 0.1× SSC, 0.1% SDS, at 65°C for 15 min twice, and then exposed to X-ray film.
Amplification and Cloning of PCR Fragments from a cDNA Library
DNAs prepared from a cDNA library (Minet et al. 1992) were used as DNA templates for PCR amplification of putative genes. High-fidelity enzyme mix (Boehringer Mannheim) and Taq extender (Stratagene) were used in the PCR. PCR-amplified fragments corresponding to the ABA regulated genes on T07M07 were extracted with phenol/chloroform/isoamylalcohol (25:24:1), then chloroform/isoamylalcohol (24:1), precipitated with ethanol, dried at room temperature, dissolved in 1× TE and cloned into the pET-19b expression vector (Novagen) that encodes 10 histidine residues at the amino terminus of the expressed protein. PCR fragments (∼1000 ng) and pET-19b vector (500 ng) DNA were digested with XhoI and dephosphorylated with CIP. The digested PCR fragment DNA was electrophoresed on a 1% LMP agarose gel. The gel slice containing the DNA band was excised under long UV light and melted at 65°C. Digested vector DNA and PCR-amplified DNA were ligated at 16°C for 16 hr and then electroporated into E. coli DH5α-competent cells. Recombinants were identified by outgrowth on LB agar plates containing ampicilin (50 μg/ml). Four clones from each putative gene were sequenced and aligned with genomic sequences. Plasmid DNA from a sense clone without mutations and pET-19b vector DNA (as a control) were transformed into E. coli BL21pLysS-competent cells (Novagen) (expression host) by heat-shock for later gene expression.
Expression and Purification of Recombinant Protein
A single colony was picked from LB agar plates containing 50 μg/ml ampicillin and 34 μg/ml chloramphenical and inoculated into 5 ml of LB solution with the same antibiotics and cultured at 37°C with shaking at 300 rpm for 16 hr. Five milliliters of cultured cell solution was inoculated into 500 ml of LB solution with the same antibiotics. When the OD600 reached 0.6–0.7, isopropyl β-d-thiogalactoside (IPTG, 1 mm) was added to the culture for induction of expression from the T7 promoter. The solution was cultured for another 3 hr to allow accumulation of recombinant protein. Cells were harvested by centrifugation and suspended in 5 mm imidazole, 500 mm NaCl, 20 mm Tris-HCl (pH 7.9), and lysed by sonication at the following settings (time, hold; duty cycle, 80; output control, 9) on a Sonifier 250 (Branson) at 4°C for 1 min. Protein was purified by nickel affinity chromatography Novagen kits (His-bind resin; His-bind buffer) and dialyzed at 4°C overnight. Protein was concentrated by use of centricon concentrators (Amicon) and its concentration determined by a Bio-Rad protein assay.
Casein Labeling and Protein Enzyme Activity Assay
J.M. Stone (pers. comm.) provided the casein-labeling method. Before labeling, 5× incubation buffer (250 mm Tris at pH 7.4, 0.5 mm EGTA, 50% glycerol, 0.5% β-mercaptoethanol) and stop buffer (100 mm EDTA, 500 mm NaF) were prepared, and 250 units of the catalytic subunit of protein kinase from bovine heart (Sigma) were dissolved in 25 μl of 40 mmdithiothreitol (DTT). Partially dephosphorylated casein from bovine milk (Sigma) was labeled by [γ-32P]ATP (NEN/DuPont) in a total volume of 500 μl (containing 1× incubation buffer, 10 mm Mg-acetate, 1 U/μl protein kinase, 0.4 μCi/μl [32P]ATP, 11.2 μg/μl casein) at room temperature for 16 hr. The reaction was terminated by adding 55 μl of stop buffer and left at room temperature for 10 min. Denatured protein was removed by brief centrifugation. To remove unincorporated [32P]ATP, the reaction solution was chromatographed on a 10-ml size Sephadex G-50 column pre-equilibrated with 1× incubation buffer. The labeled protein solution was loaded onto the column, 32 fractions (500 μl each) were eluted by addition of 1× incubation buffer, collected into 1.5-ml Eppendorf tubes and stored at 4°C. Incorporated label in each fraction was determined by scintillation counting and the initial highly radioactive fraction (4 × 10⁵cpm/μl) was used as a substrate for the protein assay. Phosphatase activity was determined as described (Stone et al. 1994).
Acknowledgments
We thank Drs. Jen Sheen and Gabor Lazar for suggestions and stimulating discussions regarding the experiments, Dr. Julie M. Stone for instructions for the casein labeling and the recombinant protein assay, Dr. Hawk-Bin Kwon for suggestions in RNA isolation, and Dr. Julie Nardone for critical reading of the manuscript. We acknowledge Dr. Michèle Minet for providing the Arabidopsis pFL61 cDNA library. This work was supported by a grant from Hoechst to H.M.G.
The publication costs of this article were defrayed in part by payment of page charges. This article must therefore be hereby marked “advertisement” in accordance with 18 USC section 1734 solely to indicate this fact.
Footnotes
-
Present addresses: 3Cereon Genomics, LLC., Cambridge, Massachusetts 02139 USA; 4Marine Biological Laboratory, Woods Hole, Massachusetts 02543 USA; 5DuPont Agricultural Products, Newark, Delaware 19711 USA; 6Millennium Pharmaceuticals Inc., Cambridge, Massachusetts 02139 USA.
-
↵7 Corresponding author.
-
E-MAIL Howard.Goodman{at}molbio.mgh.harvard.edu; FAX (617) 726-3535.
-
- Received November 5, 1998.
- Accepted January 29, 1999.
- Cold Spring Harbor Laboratory Press


