
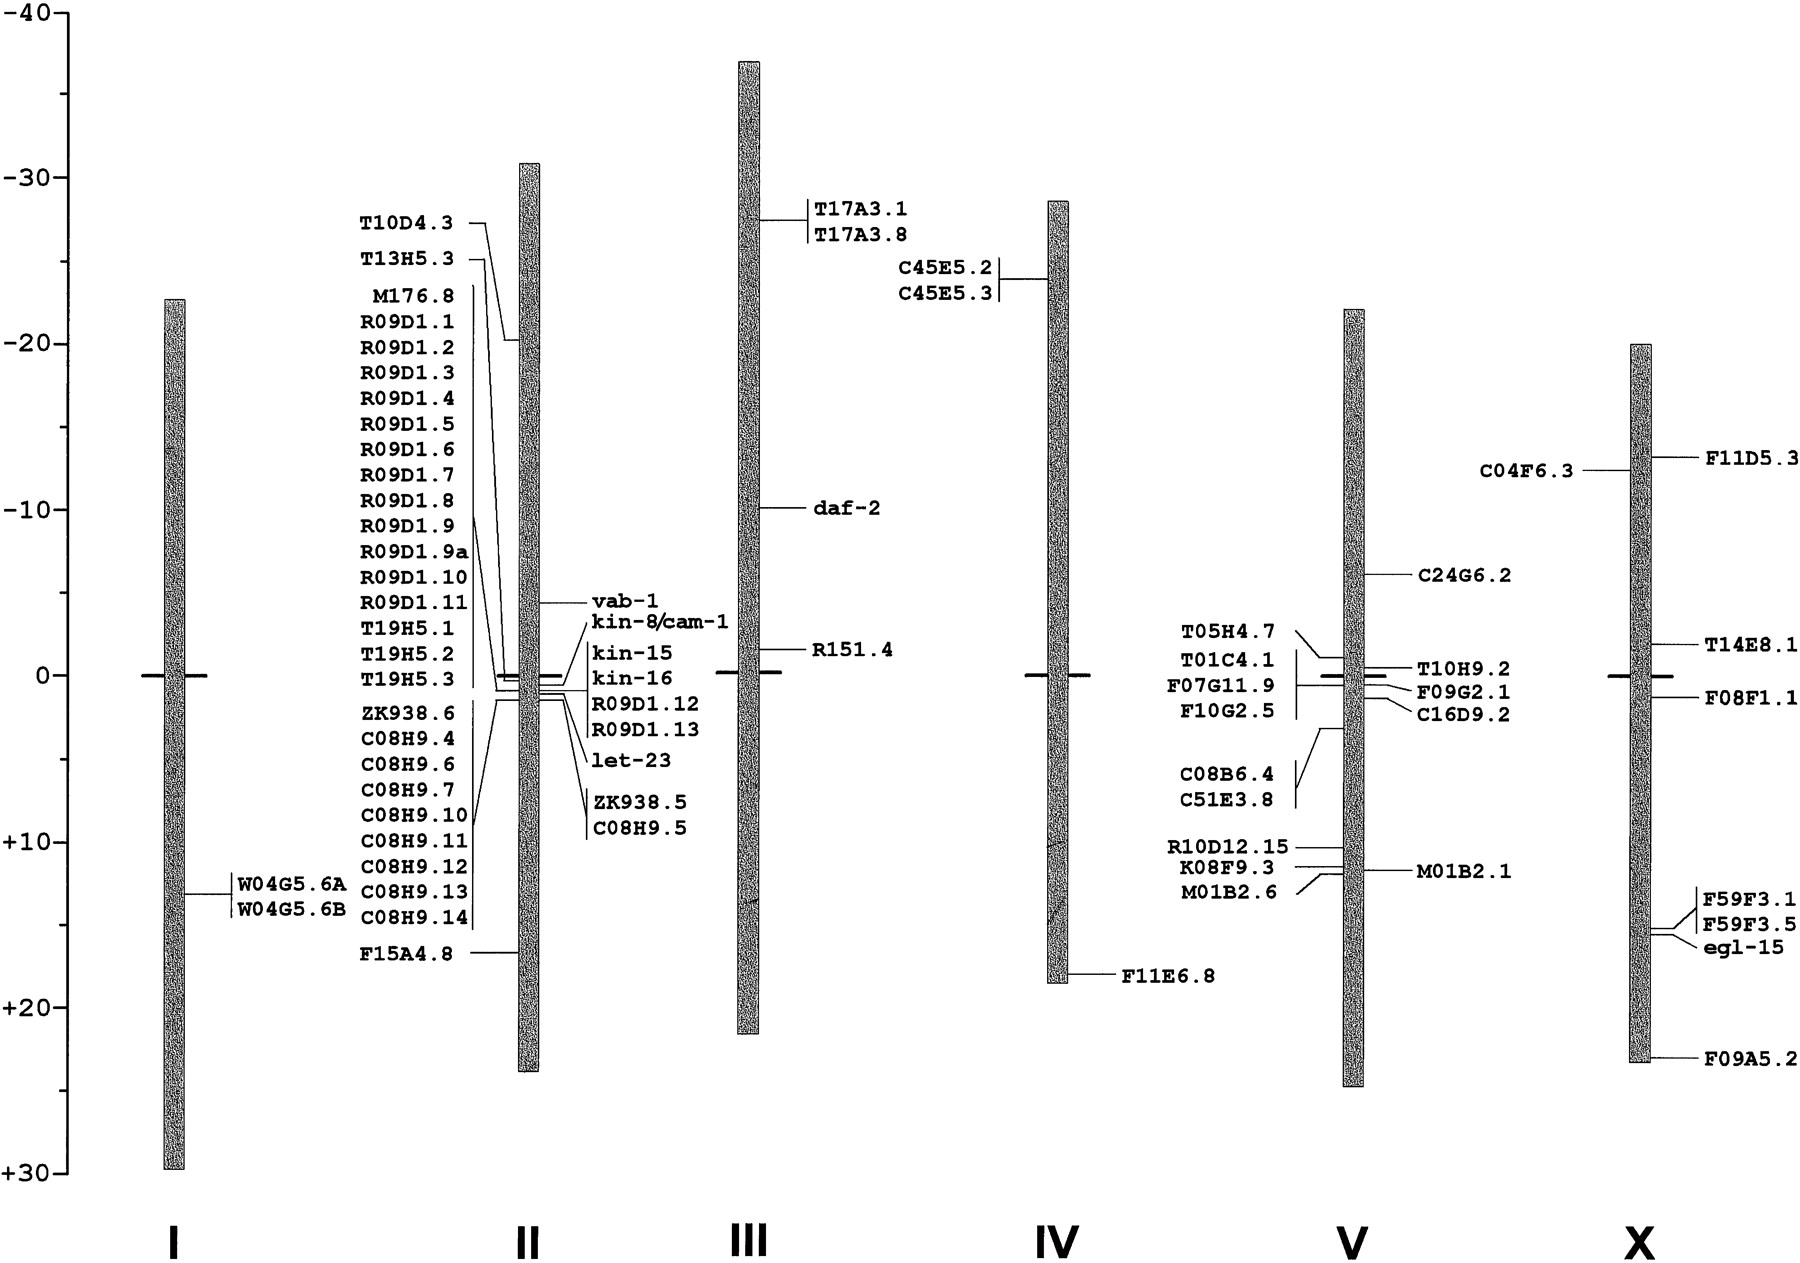
Figure 1.
Distribution of RTK genes (at right of the chromosomes) and chitinase genes (at left) in the C. elegans genome. The genetic distances are indicated on a scale bar at left.
(Downloading may take up to 30 seconds. If the slide opens in your browser, select File -> Save As to save it.)
Click on image to view larger version.
Distribution of RTK genes (at right of the chromosomes) and chitinase genes (at left) in the C. elegans genome. The genetic distances are indicated on a scale bar at left.
 CiteULike
 Delicious
 Digg
Digg Facebook
 Google+
 Reddit
 Twitter
