
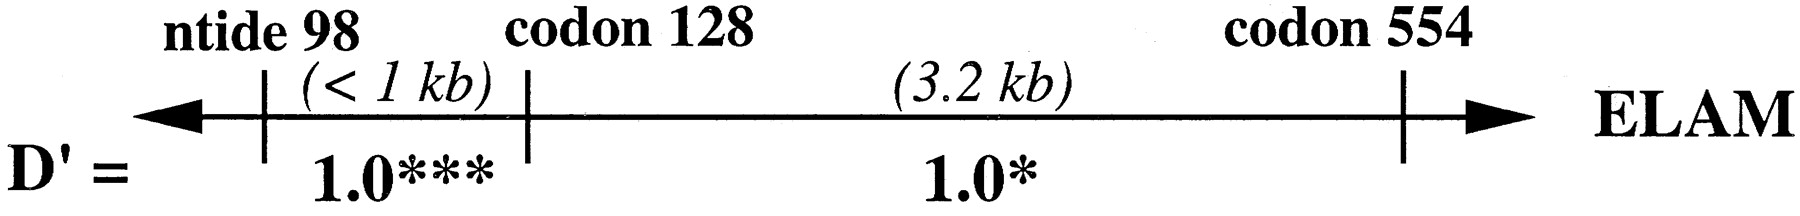


Figure 3.
Linkage disequilibrium values (D′) estimated from the intragenic haplotypes for the ELAM, LPL, and apoCIII genes that were observed among 275 families from the Stanislas cohort. Above each gene represented by a horizontal line, the genotyped sites are labeled by nucleotide (ntide) or codon position. Distances between adjacent sites are given in kilobases; the spacing is not to scale. (†)P > 0.1; (*) P < 0.05; (***)P < 0.001.


