
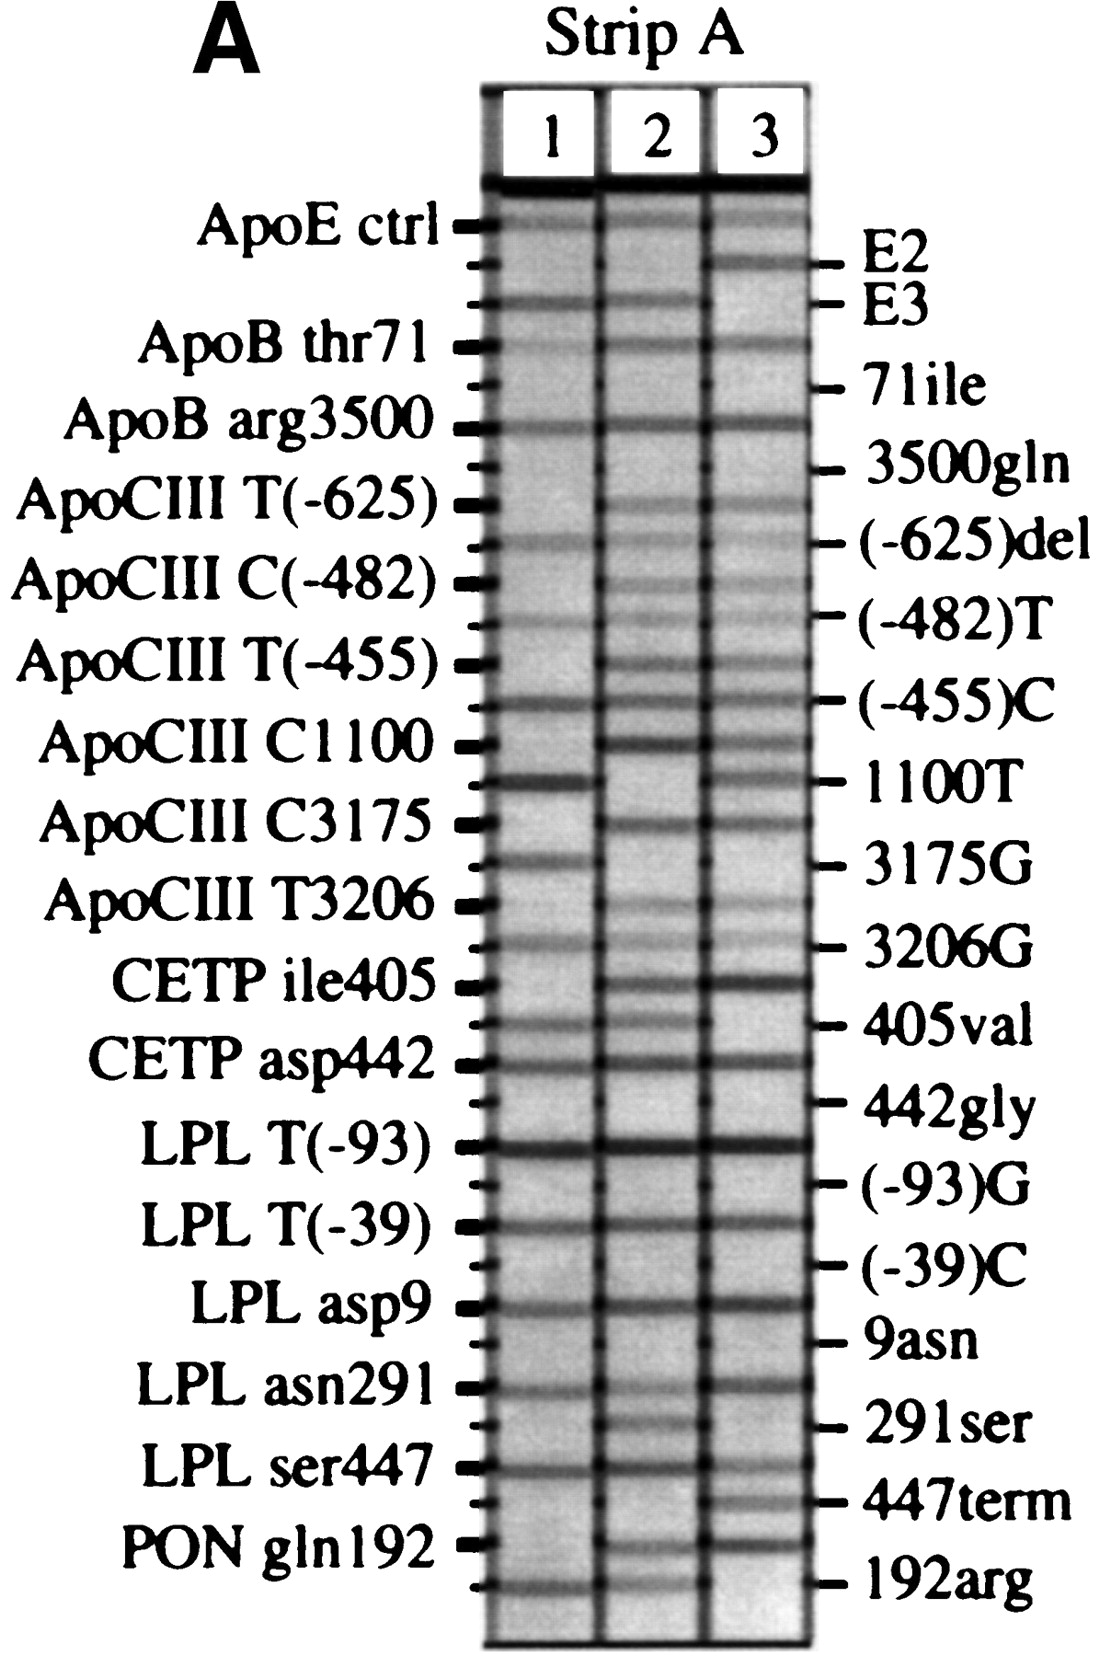
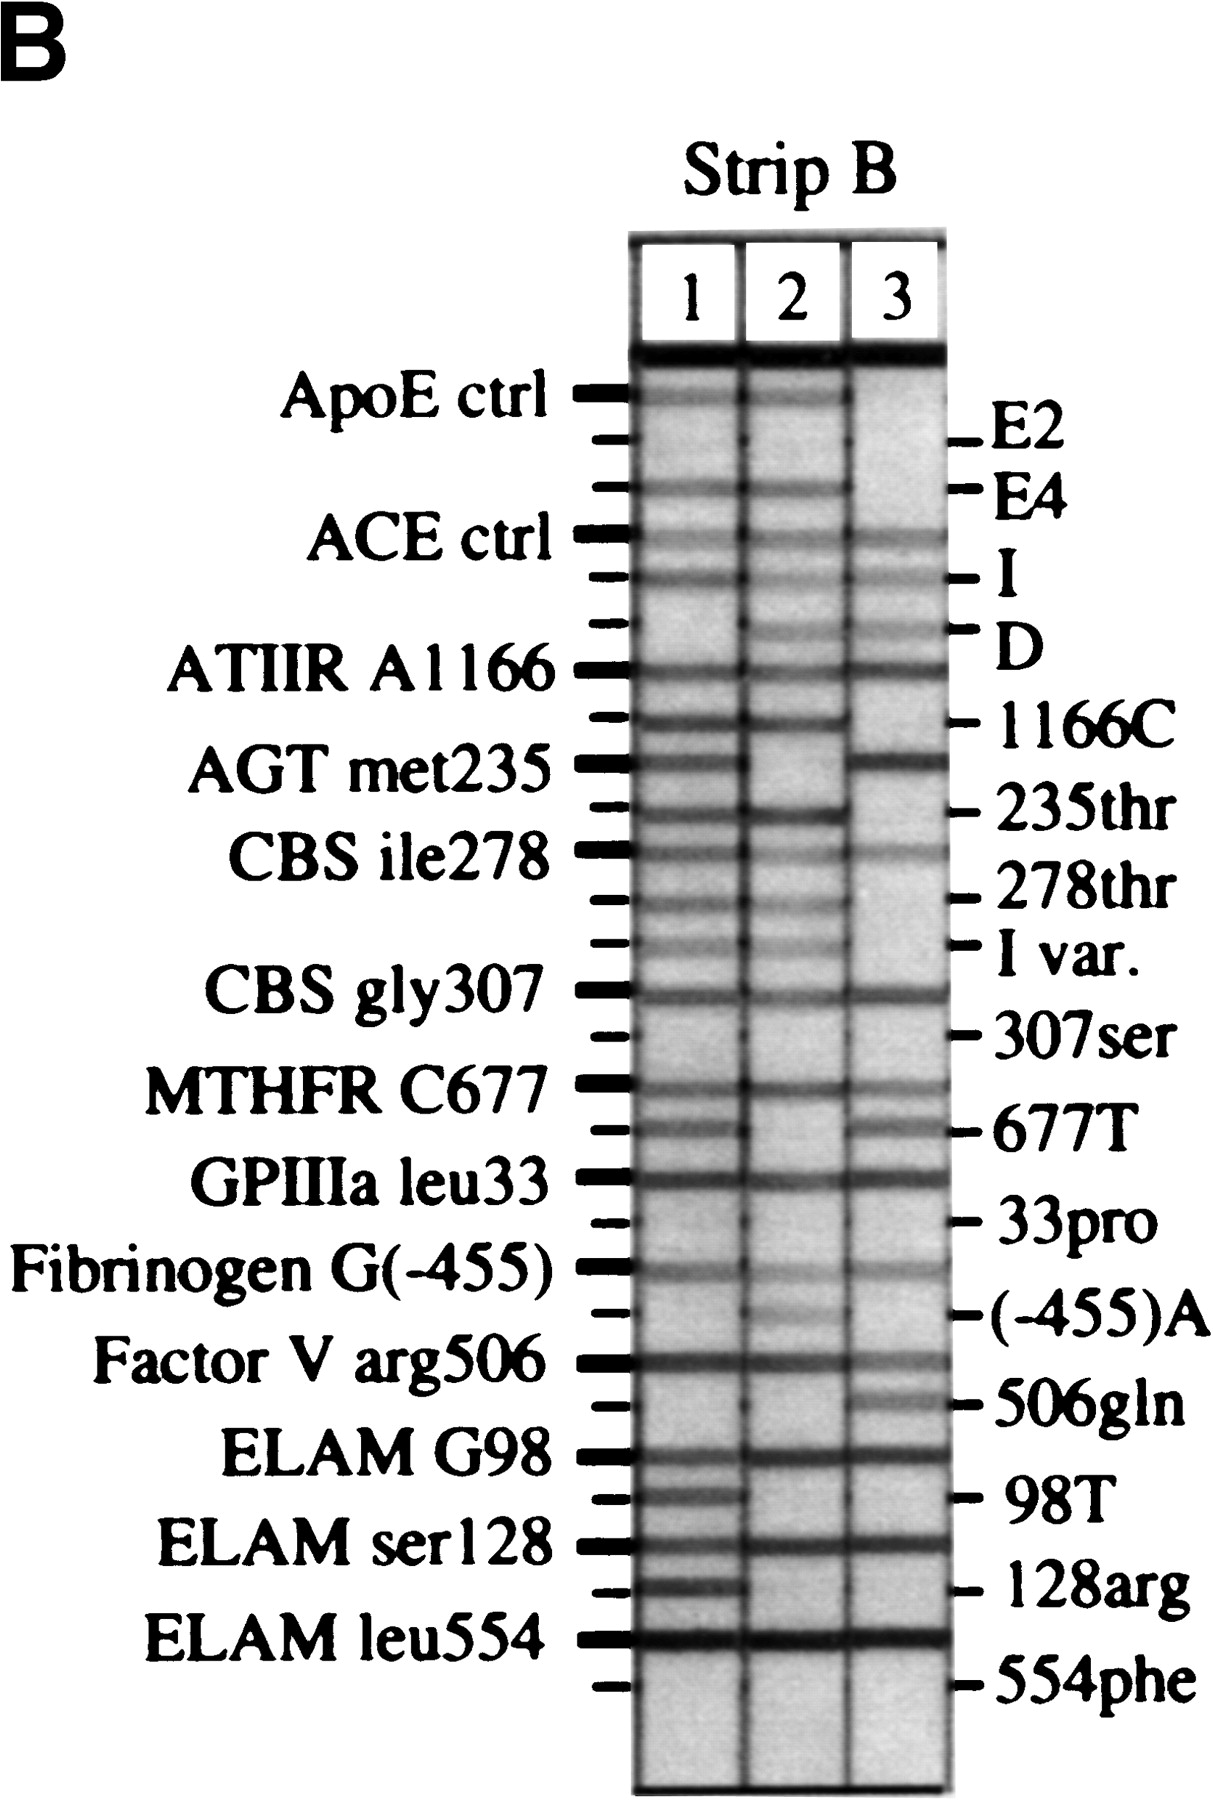
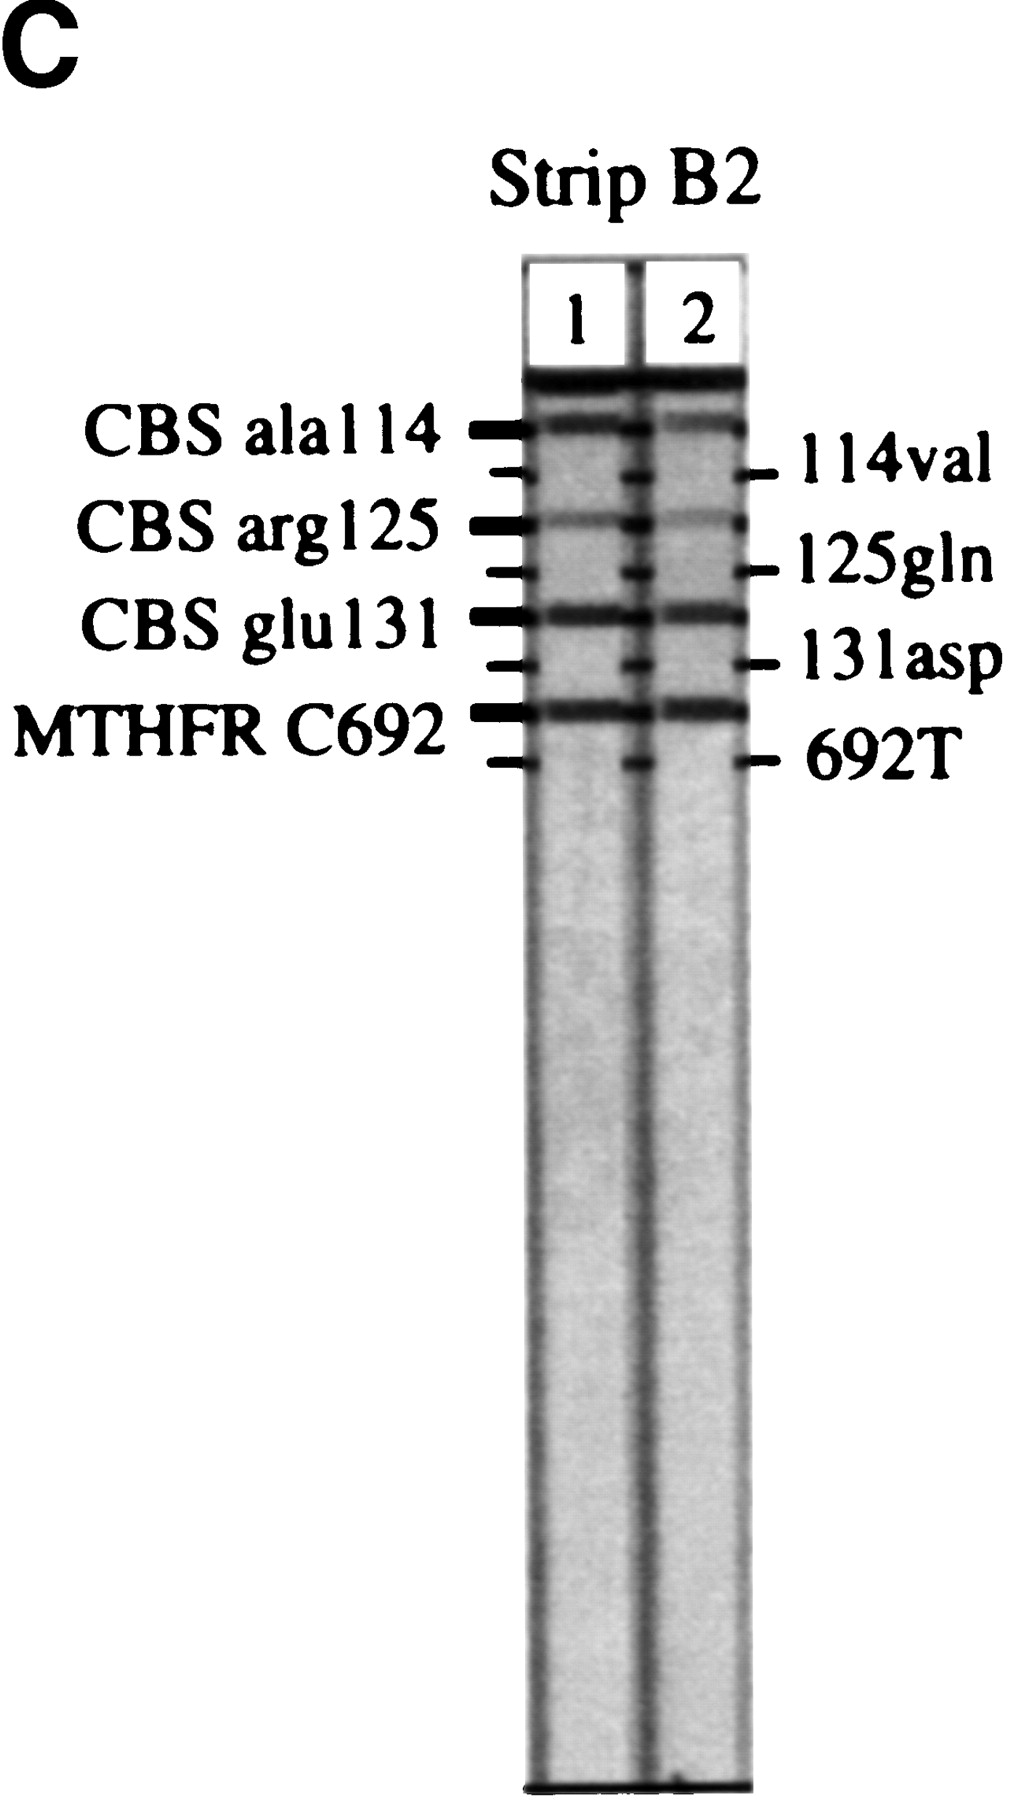
Representative probe strips demonstrating the identification of different alleles. Genomic DNA samples were amplified with either the multiplex A (A) or the multiplex B (B,C) primer pool, then hybridized to the corresponding immobilized probe strips, as described under Methods. Five examples each of probe strips A and B are shown; only two examples of probe strip B2 are shown. For the purpose of illustrating a range of different genotypes, the individuals typed here in A do not correspond to those inB or C. On each vertical strip, alleles amplified from the original sample are indicated by horizontal lines. The template guides at the left and right identify the allele detected at each probe position. With the exception of apoE3, ACE-I, andACE-D, the less prevalent genetic variant for each marker is listed on the right. Differences in the relative efficiencies of amplification and probe hybridization contribute to the variation in the actual intensity among the loci. (In actual size, each strip is ∼8 cm long.)


