


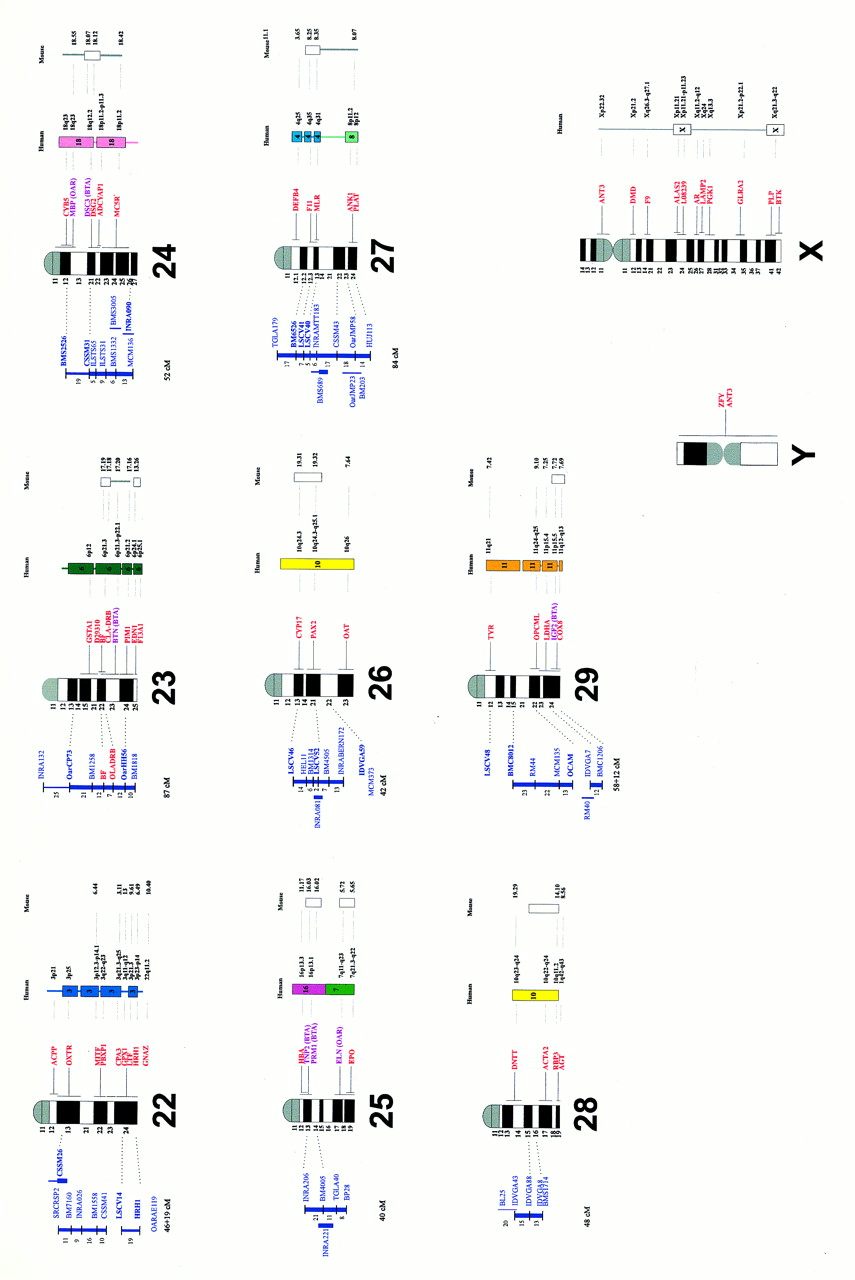
The goat genetic and cytogenetic integrated map. Genetic maps are drawn in blue on the left of the standard karyotype. Distances are reported in cm without the correction of Kosambi. The thickness of the lines is based on the two-point lod score between adjacent markers: thick lines for lods >3, medium for lods comprised between 2 and 3, and thin for lods <2. Markers that could not be positioned precisely in linkage groups are displayed in the most probable interval, by a line parallel to the chromosome. Markers cytogenetically mapped are figured in bold. (Right) Gene localizations are drawn in red (present work), in red with an asterisk (mapped previously in goat), and in violet (mapped in cattle or sheep). When known, human and mouse localizations are shown with regard to goat localization. Corresponding human chromosome regions are represented by colored lines for synteny (one color for each human chromosome) or boxes for conserved segments. Murine homologous regions are shown likewise by lines or open boxes.


