
Comparative Gene Mapping: A Fine-Scale Survey of Chromosome Rearrangements between Ruminants and Humans
Abstract
A total of 202 genes were cytogenetically mapped to goat chromosomes, multiplying by five the total number of regional gene localizations in domestic ruminants (255). This map encompasses 249 and 173 common anchor loci regularly spaced along human and murine chromosomes, respectively, which makes it possible to perform a genome-wide comparison between three mammalian orders. Twice as many rearrangements as revealed by ZOO-FISH were observed. The average size of conserved fragments could be estimated at 27 and 8 cm with humans and mice, respectively. The position of evolutionary breakpoints often correspond with human chromosome sites known to be vulnerable to rearrangement in neoplasia. Furthermore, 75 microsatellite markers, 30 of which were isolated from gene-containing bacterial artificial chromosomes (BACs), were added to the previous goat genetic map, achieving 88% genome coverage. Finally, 124 microsatellites were cytogenetically mapped, which made it possible to physically anchor and orient all the linkage groups. We believe that this comprehensive map will speed up positional cloning projects in domestic ruminants and clarify some aspects of mammalian chromosomal evolution.
[The sequence data described in this paper have been submitted to the GenBank data library under accession nos. G40978–G41020,AF083170–AF083184, AF088286, AF08287, AF083401–AF083406, AF082884, and AF082885.]
The accurate comparison of genomes of large mammals has never been achieved. The available tools consisted originally of somatic cell hybrids, which only provided synteny information. Despite these limits, somatic cell hybrids paved the way to comparative gene-mapping projects, leading to a comparative physical map for 28 species from eight mammalian orders in the early 1990s (O’Brien and Marshall Graves 1991). A set of anchored reference loci suitable for comparative mapping in mammals was proposed to speed up collaborative work in this research field (O’Brien et al. 1993). Later, comparative anchor-tagged sequences (CATS) were suggested as a universal tool for generating an effective dialog between comparative maps (Lyons et al. 1997). The impressive development of comprehensive maps for mice and humans has encouraged the construction of mammalian gene-oriented maps. This was considered as the most efficient way to identify relevant genes in livestock (Georges and Andersson 1996), as illustrated by the recent identification of the muscular hypertrophy cattle gene (Grobet et al. 1997; Kambadur et al. 1997; McPherron and Lee 1997).
Recently, human flow-sorted chromosomes have been used extensively to perform cross-genome comparisons by interspecific hybridization [ZOO-(FISH)]. This whole-chromosome painting technique made it possible to quickly and directly identify conserved chromosomal segments between primates (Jauch et al. 1992; Wienberg et al. 1992;Scherthan et al. 1994), between humans and pigs (Wienberg et al. 1992;Goureau et al. 1996), cattle (Hayes 1995; Solinas-Toldo et al. 1995;Chowdhary et al. 1996), horses (Raudsepp et al. 1996), cats (Rettenberger et al. 1995), and minks (Hameister et al. 1997). Whereas both chromosome painting and somatic cell hybrid mapping represent complementary approaches to define interspecific homologous chromosome segments, neither addresses the problem of gene order within conserved syntenies. Indeed, the human/mouse comparison has demonstrated an unsuspected level of internal rearrangements in several occurrences (Carver and Stubbs 1997). Similarly, a few alterations in gene order have been described between ruminants and humans (see Barendse et al. 1997; Sun et al. 1997; Yang et al. 1998), but data are very scarce at the whole-genome scale. Extensive comparative mapping data would nonetheless be indispensable to make use of the wealth of data generated by the human and mouse genome projects. Indeed, livestock genomic maps lack the resolution required either to reduce mapping intervals (an essential prerequisite for an efficient marker-assisted selection), or to possibly identify underlying genes. The possibility of a precise cross talk between human/mouse and ruminant genomes could be an efficient way to attain these goals. Such a cross talk could be based upon the regional mapping of a sufficient number of coding sequences in the species of interest. This can be addressed either by discovering polymorphisms inside or close to genes, and positioning them by linkage inside reference families, or by cytogenetics. The first approach has resulted in the mapping of 132 genes in the last release of the international bovine map (Barendse et al. 1997). By contrast in 1997, <30 genes were located by the second approach. This strikingly low number is because of the specific difficulties of obtaining gene-containing probes long enough to be amenable to FISH analysis. The recent construction of arrayed genomic libraries of large inserts for ruminants, however, constitutes a noteworthy improvement over classical cosmid probes, which are often chimeric and imply long screening steps. Such libraries have been made available recently for cattle, sheep, and goats in yeast artificial chromosomes (YACs) (Libert et al. 1993; Broom and Hill 1994; Smith et al. 1996) or bacterial artificial chromosomes (BACs) (Cai et al. 1995; Schibler et al. 1998), and have made it possible to obtain straightforwardly gene-specific probes.
In this study, we describe the generation of the first integrated and comparative map for the ruminants, established on the goat. This map comprises 307 microsatellite markers and 257 genes. Among these type I and type II markers, 124 microsatellites were assigned by FISH and 29 genes were included in the linkage map. This map constitutes the most significant effort so far to finely compare the genomes of primates and ruminants. It will make it possible to define accurately the human regions homologous to economically relevant loci in ruminants, and facilitate the switch from candidate regions to candidate genes within limited chromosome segments. Finally, this comparative map will provide a solid basis for addressing some aspects of mammalian genome evolution that have been until now inaccessible for fine analysis.
RESULTS
A Second-Generation Linkage Map for the Goat Genome
The previous goat genetic-linkage map was improved by incorporating 77 microsatellites, 34 of which were isolated from goat BACs and 43 were bovine or sheep published microsatellites (primers are listed in Goatmap database at http://locus.jouy.inra.fr). A total of 33 BACs corresponding to known genes and 2 random BACs were subcloned and screened for microsatellites. At least one microsatellite marker was isolated for 30 BACs out of the 35 subcloned, under stringent screening conditions. On average, 1.6 microsatellites per BAC were found, with a maximum of three microsatellites. Twenty-five genetic localizations consistent with FISH mapping were obtained with these new microsatellites. Three markers could not be linked because of insufficient informativeness and seven resulted in inconsistent localizations. The average number of informative meioses was 114 (±70) for this set of markers. To complete the genetic map, 130 bovine and 25 ovine new microsatellites were chosen and tested in goat families. A polymorphic PCR product could be obtained for 43 bovine (33%) and 11 ovine (44%) markers. Out of these, 40 could be linked to at least one other and were included in the genetic map. The mean number of informative meioses was 91 (±66) for this marker set.
The total number of genotyped markers was 307, among which 40 were located at or near coding sequences, 243 were mapped in common with cattle, and 127 with sheep, whereas 93 were mapped in the three ruminant species. Among the 307 markers of the goat linkage map (Fig.1), 284 were linked to at least one other marker, and could be assigned to 40 linkage groups on the 29 pairs of autosomes. Among these, 237 could be positioned unambiguously using the “build” option of the CRI-MAP software (Green et al. 1989). For the 47 others, position inside the linkage group could not be ascertained, and they were consequently drawn near solid bars on the side of maps, at the most likely localization. The map covers 2737 cM >88% genomic coverage assuming a total autosomal length of 3100 cm, as computed in (Vaiman et al. 1996), with an average interval of 14.5 cm(±3.8 cm) between contiguous markers positioned unambiguously in linkage groups. The mean interval is reduced to 10 cm (±3 cm) when all the markers are taken into account. Chromosome-specific variations were observed in the average interval size, which ranged from 8.4 (chromosome 26) to 22.8 cm (chromosome 8). The largest linkage group is 182 cm in length (chromosome 1) and the smallest covers 8 cm (part of chromosome 5). Comparison with the bovine map shows that only three gaps span more than 30 cm. Moreover, eight ordered marker intervals are >30 cm in length, and one chromosome (13) harbors a linkage group spanning less than half of its probable length.
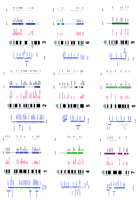
The goat genetic and cytogenetic integrated map. Genetic maps are drawn in blue on the left of the standard karyotype. Distances are reported in cm without the correction of Kosambi. The thickness of the lines is based on the two-point lod score between adjacent markers: thick lines for lods >3, medium for lods comprised between 2 and 3, and thin for lods <2. Markers that could not be positioned precisely in linkage groups are displayed in the most probable interval, by a line parallel to the chromosome. Markers cytogenetically mapped are figured in bold. (Right) Gene localizations are drawn in red (present work), in red with an asterisk (mapped previously in goat), and in violet (mapped in cattle or sheep). When known, human and mouse localizations are shown with regard to goat localization. Corresponding human chromosome regions are represented by colored lines for synteny (one color for each human chromosome) or boxes for conserved segments. Murine homologous regions are shown likewise by lines or open boxes.
A First Integrated Cytogenetic Map for Ruminants
The genetic map was anchored physically and every linkage group was oriented relative to the centromere by FISH mapping of 124 microsatellite-containing BACs or cosmids (Fig. 1). At least three markers were mapped cytogenetically for each chromosome, except chromosomes 12, 16, 25, and 28 (two markers only). Primers originating from 120 microsatellite sequences were used for screening the goat BAC library (Schibler et al. 1998). Positive clones could not be isolated in three cases (2.5%) because of too complex amplification products. Cytogenetic localizations were inconsistent with the linkage analysis for 10 isolated BACs (8%) and six BACs failed to be mapped.
Primer pairs were designed for 297 genes, using 148 human, 99 cattle, 22 sheep, 12 goat, and 16 other species sequences. In addition, 64 human expressed sequence tags (ESTs) provided by Genethon and 25 CATS (Lyons et al. 1997), both types being conserved in cattle, were tested for PCR-amplification on the goat. It was possible to isolate 235 positive BAC clones from these three sources. FISH mapping of these clones led to ZOO-FISH-consistent localizations for 150 genes (59 human, 57 bovine, 16 ovine, 11 caprine, and 7 from other genomes), three CATS, and 14 ESTs. FISH experiments failed to map eight gene-containing BACs despite a second DNA preparation. Inconsistent localizations were observed in 60 cases (40 genes, 6 CATs, and 14 ESTs). In these cases, a second independent clone was isolated, which resulted in a consistent localization in seven additional cases (five genes, one CAT, one EST).
A sample of 28 consecutive clones (23 genes, 4 ESTs, and 1 CAT, representing 15.6% of these coding sequences) were sequenced
either directly or after cloning the PCR product. Highly significant homology with the species of origin was revealed in all
these cases (in average 90.3% sequence similarity, but higher of course when the sequences were of bovine origin). This sampling
result shows that the proportion of nonhomologous sequences is <
 , indicating a maximum of 11 inconsistent localizations for the complete set of coding sequences (95% interval). Amplification
products from 10 inconsistently mapped clones were also sequenced to assess the sequence similarity. For five clones, the
sequence revealed the highest homology with a gene different from the initial target, but often belonging to the same gene
family (COX4P1, GLI2, FGF6, OXTR, EN1, instead of COX4, ALPI, FGF4, AVPR1, and EN2, respectively). The five others did not display clear similarity with known coding sequences.
, indicating a maximum of 11 inconsistent localizations for the complete set of coding sequences (95% interval). Amplification
products from 10 inconsistently mapped clones were also sequenced to assess the sequence similarity. For five clones, the
sequence revealed the highest homology with a gene different from the initial target, but often belonging to the same gene
family (COX4P1, GLI2, FGF6, OXTR, EN1, instead of COX4, ALPI, FGF4, AVPR1, and EN2, respectively). The five others did not display clear similarity with known coding sequences.
The BAC library was also screened for 23 microsatellite loci located in the vicinity or inside coding sequences (12 of which mapped in the previous version of the goat map).
In conclusion, the goat cytogenetic map encompasses 202 newly localized type I loci, 160 being genes (62 derived from human sequences, 63 from cattle, 17 from sheep, 11 from goat sequences, and 7 from other species), 23 microsatellites near coding sequences, 4 CATs, and 15 ESTs. The primers used for screening are listed in the Goatmap database at http://locus.jouy.inra.fr. The final usefulness of each marker type is reported in Table 1. In the course of the work, seven goat BACs were also mapped in cattle (4 genes, three microsatellites) and 18 in sheep (11 genes, four ESTs, and three microsatellites) at homologous localizations. Cytogenetic localization of previously mapped genes in the three species were obtained in either the BovMap (http://locus.jouy.inra.fr/), the BovGbase (http://bos.cvm.tamu.edu/), or the SheepGbase (http://dirk.invermay.cri.nz/) databases. Taking into account the loci and gene clusters mapped in common (∼90 genes have been mapped previously in ruminants), our study results in a ruminant gene map including 255 loci, with on average of one gene every 18 cm(±7 cm), or roughly one gene per two cytogenetic bands.
Interspecific Use of the Different Probe Types
Comparative Mapping with Humans and Mice
Within the 255-gene map presented here, regional information on 249 coding sequences were available in humans, which was obtained either by FISH, radiation hybrid mapping, or YAC contigs. For two loci, MAP2 and LYZ, only chromosomal information is available, and the three remaining loci are not positioned in humans. These common locations improve the regional boundaries of conserved segments from ruminants to humans (Fig. 1), as well as, in a reciprocal way, from humans towards ruminants (Fig.2). Furthermore, among the 255 loci, 173 have been mapped in mice by linkage analysis providing the basis of a rodent/ruminant comparison (Fig. 1).
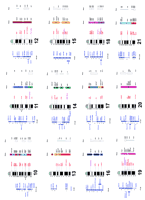
Human and goat comparative map. Human localizations are presented aligned to the standard G-banded karyotype. The cytogenetic localizations in goats are printed at right. Syntenic loci are joined by vertical narrow lines, according to data from this study and chromosome assignments in cattle obtained previously by somatic hybrid analysis [BovGbase (http://bos.cvm.tamu.edu/)]. Furthermore, when our results revealed conserved segments, solid lines were drawn. (Small scissors) Position of human chromosome translocations associated with neoplasia; (large scissors) sites also correlated with an evolutionary breakpoint between humans and ruminants.
Two new synteny groups were detected and 16 were enlarged or delimited more precisely. The regional localization by FISH made it possible to identify precisely conserved segments within synteny groups and thus to detect numerous rearrangements. We identified 107 conserved fragments based upon gene order preservation between humans and goats, 62 of which included at least two genes. Between mice and goats, 46 conserved segments were observed by carrying out the same analysis. Human genetic localizations were searched at Unigen (http://www.ncbi.nlm.nih.gov/UniGene) and at the Whitehead Institute (www.genome.wi.mit.edu) for the outermost genes defining these segments, to evaluate the mean size of conserved chromosome fragments between humans and ruminants. Mouse genetic localizations were searched likewise in the Mouse Genome Database (MGD, The Jackson Laboratory, Bar Harbor, Maine, http://www.informatics.jax.org/) and are presented in Figure 1. Our data made it possible to compute a mean fragment size of 27 cm (±5 cm), according to the calculation method described by Nadeau et al. (Nadeau and Taylor 1984). This calculation implies that at least 100 disruptions (±15) have taken place since the divergence of humans and goats, at least 70 million years ago. The same computation was undertaken from the mice/goats data, and the mean conserved segment size could be estimated at 7.7 cm (±2.5 cm), indicating a value of at least 187 (±68) disruptions of linkage since the divergence of mice and goats, at least 100 million years ago.
Break sites over the whole goat genome were compared with the different sites of chromosomal abnormalities associated with neoplasia in humans (Mitelman et al. 1997). When taking into account the only translocation-associated cases, 115 regions were detected along human autosomes. On the other hand, we detected 103 evolutionary breakpoints between humans and ruminants. Surprisingly, we could observe that a large proportion of these breakpoints (65) shared a homologous location. Twelve could constitute further potential breakpoints, although gene density is not sufficient to be completely positive. Statistical analysis of these data revealed a highly significant correlation, suggesting the existence of chromosome regions prone to instability in mammalian genomes. These sites of fragility can result in chromosomal abnormalities leading to cancer diseases inside a given species. At the evolutionary time scale, however, they behave presumably as privileged spots of chromosome rearrangements, conducting or setting speciation events.
The comparative map presented here made it possible to deduce homologous human segments for all the published bovine/ovine genes or quantitative trait loci (QTL) (Table 2). In the particular case of the mapping of the polled/intersex syndrome (PIS) to the distal region of goat chromosome 1, we screened the BAC library for human genes located within the HSA 3q21—3q27 region and could isolate 16 clones. This work demonstrated that at least five segments are conserved between goats and humans and found intricately on goat chromosomes 1 and 22. The localization of CPA3 andPBXP on chromosome 22 specifies the breakpoint position in the human region homologous to goat chromosomes 1 and 22, confirming the assignment of RHO (HSA 3q21–q24) to cattle chromosome 22 (homologous to goat chromosome 22).
Most Probable Human Localizations of Previously Identified Ruminant Genes or QTLs
DISCUSSION
Our purpose was to estimate the true number of conserved segments between two orders of large mammals on a large physical scale, the number probably underestimated by ZOO-FISH experiments. Obviously our results prove that the number of conserved segments is double that detected by painting and emphasize the importance of studying intrachromosomal rearrangements to evaluate genomic conservation in mammals.
The Goat Genome as a Model for the Genomic Organization of Domestic Ruminants
In this study, the goat genome is considered a model genome for ruminants. As such, all the comparisons established with humans are supposed to be relevant in cattle and sheep. The assumption of wide genomic interspecific similarity between the three main domestic species of ruminants is now well substantiated, and is based upon banding homology (Evans et al. 1973; ISCNDA1989 1990) and molecular evidences (Crawford et al. 1995; Vaiman et al. 1996; Barendse et al. 1997; Kappes et al. 1997). Separating the three centric fusions differentiating sheep chromosomes from those of goats and cattle, the major discrepancies are because of the well-known 9–14 translocation differentiating Bovinae and Caprinae (Crawford et al. 1995; Vaiman et al. 1996) and to the X chromosomes (Ponce de Leon et al. 1996; Piumi et al. 1998).
Our present goat linkage map, which incorporates 93 of these shared markers, confirmed an almost perfect conservation in loci order, and a similar map size. Among the 252 genes now mapped in goat, 30 genes have been cytogenetically mapped and 79 assigned by somatic-cell hybrids in cattle. Similarly, 35 genes have been mapped in common with sheep, either genetically or cytogenetically.
Comparative Gene Mapping Demonstrates a High Number of Chromosome Rearrangements between Ruminants, Humans, and Mice
When considering gene order, >100 human/ruminant-conserved segments of 25 cm on average were defined in our study, demonstrating a higher level of genomic rearrangements than detected by ZOO-FISH analysis. The interchromosomal rearrangements observed between humans and goats are nonetheless in good agreement with previous heterologous painting findings in cattle (Hayes 1995; Solinas-Toldo et al. 1995; Chowdhary et al. 1996) and sheep (Burkin et al. 1997). Thus, intrachromosomal rearrangements occurred frequently within syntenic fragments. This is illustrated by the case of ruminant chromosomes painted by either several or one human chromosomes. For instance, our results confirm the complexity observed by ZOO-FISH for cattle chromosome 10 (Hayes 1995) or sheep chromosome 7 (Burkin et al. 1997), an intricate patchwork of segments partly homologous to human chromosomes 5, 14, and 15. Moreover, they demonstrate that even chromosomes painted by only one human chromosome, such as cattle or sheep chromosome 4 painted by human chromosome 7, can be extremely fragmented. In the latter case, at least five noncontiguous fragments are appended. We can thus infer securely that intrachromosomal differences between humans and ruminants are as frequent as interchromosomal rearrangements, although not as easily detectable. Whereas 173 loci have been mapped in common between goats and mice, only 46 conserved synteny segments could be observed. This suggests a higher level of rearrangements between rodents and ruminants than between primates and ruminants, which is consistent with previous observations concerning the high fluidity of rodent genomes, subjected to very rapid alterations (Barendse et al. 1997; Garagna et al. 1997).
The correlation observed between human chromosomal abnormalities leading to neoplasia with a translocation event and evolutionary breakpoints was suggested previously by previous studies (Carver and Stubbs 1997; Puech et al. 1997). However, in most cases, limited chromosomal regions were taken into account, matching generally only humans and mice (Amadou et al. 1995; Weterman et al. 1996). To our knowledge, our study is the first involving a genome-wide scan, leading to an identification of preferential breakpoints over the whole genome. The implications of these results enlighten some particular aspects of mammalian chromosomal evolution. Indeed, the DNA content of mammalian cells is fairly constant, consisting in six picograms per diploid cell, in which they differ strikingly from other classes of vertebrates, such as fish or amphibians. In fact, the major differences between mammalian genomes seem to involve translocations of relatively large chromosome segments. In 1993, O’Brien et al. proposed the existence of smallest conserved evolutionary units (SCEUs) to define a common language for comparative mapping in mammals. One possible flaw would have been an ongoing dwindling of the evolutionary unit size with the number of mammalian genomes studied. Our results seem to indicate that, if rodents are excepted, the position of chromosome breaks might be conserved in the evolutionary course of large mammal species, and that roughly 100–120 segments were the base of mammalian autosomal shuffling. The conserved positions of genomic rearrangements might be caused by repeated sequences, often clusters of gene families, as has been observed previously in some particular mouse/human comparisons (Amadou et al. 1995; Weterman et al. 1996).
A Model of Chromosome Evolution
The number of ∼40–50 conserved segments [comparisons between humans and pig, humans and muntjac, and humans and horses revealed 47, 48, and 43 conserved regions, respectively (Fronicke et al. 1996;Raudsepp et al. 1996; Yang et al. 1997] appears to be preserved even if human chromosomes are not used as the probe origin: The hybridization of pig-sorted chromosomes on human (Goureau et al. 1996) or cattle chromosomes (Schmitz et al. 1998) revealed 40 and 45 segments, respectively. These observations suggest that numerous rearrangements of large segments from a basic “mammalian material” explain the main differences in the chromosome structure between primates, artiodactyls, perissodactyls, or carnivores. In a second step, rearrangements occurred inside these segments such as those shown by our results. A last step of mammalian chromosomal evolution might have consisted mainly of more moderate chromosome alterations, such as centric fusions in Bovidae (Crawford et al. 1995; Vassart et al. 1995) or inversions in Pongidae/Hominidae (Dutrillaux et al. 1986).
Rodents appear to not fit this general model. Obviously, rodent chromosomes have been subjected to an overwhelming number of rearrangements per unit of evolutionary time relative to other mammals (Graves 1996). Indeed, abundant data have now been collected from the genomes of the house mouse and the domestic rat, showing a startling number of differences between these two related mammals (Kondo et al. 1993). Even inside the house mouse genome itself, amazingly rapid alterations occur (Garagna et al. 1997). One can suppose that both the rodent way of life and their genomic characteristics have entangled their chromosomal evolution. Indeed, peculiar mechanisms of population dynamics (reticulated evolution, in connection with the abundant number of ecological niches available for small animals), seem to be at work for speeding up the fixation of chromosome rearrangements (Bonhomme et al. 1984). Together with the reality of this population dynamics, the particularities of rodent chromosome structures [large telomeric structures, length of repetitive sequences (Zijlmans et al. 1997)] might have favored chromosome rearrangements. All these facts are illustrated by the extreme difficulty of reconstructing the genuine history of rodent chromosomes as compared with other mammals, whatever the resolution level at which the chromosomes are observed (see Carver and Stubbs 1997). In regard to our results, although comparisons between humans and goats seem relatively straightforward, the same comparisons carried out with mice are unsuccessful for most of the genome length, despite the relatively high number of genes mapped in common (173).
Comparative Gene Mapping as an Efficient Tool for Positional Cloning in Livestock Species
Since 1993, ∼15 genes or QTLs have been genetically mapped in domestic ruminants. Given the limited resolution of ruminant maps, which achieve at best medium density and given the difficulty of precisely estimating QTL effects, localization accuracy is limited roughly at 5 and 15 cm for genes and QTLs, respectively. Thus, it becomes more and more apparent that data from the human or mouse genome should be implemented to get close to these loci. The cytogenetic gene localizations presented here yield an average cytogenetic resolution of two bands. Moreover, we have demonstrated that the average conserved fragment size is of 25 cm (more or less equivalent to two cytogenetic bands) between ruminants and humans. Therefore, our map is especially workable for rapidly focusing on a candidate human region and identifying positional candidates, which will at least serve to produce new polymorphic markers in the region. This strategy was applied to the goat PIS region. ThePIS locus has been mapped previously on goat chromosome 1 between two markers corresponding to bands 1q43–1q44 (Vaiman et al. 1997), in a region homologous to human chromosomes 3 and 21. Our results indicate that complex rearrangements occurred within this chromosomal segment. It was, however, possible to delineate the human segments homologous to the goat PIS region. We could conclude that the gene lies either on a segment containing TFDP2–TF (HSA 3q23) or on a segment containing AGTR1–GYG (HSA 3q24–25.1). Typing new microsatellites isolated from these BACs will undoubtedly reduce the mapping interval and enable the selection of the true homologous segment.
In conclusion, the number of genes mapped cytogenetically is still largely insufficient for achieving direct comparisons with the murine genome, because of the small size of the conserved segments. By contrast, the human/ruminant comparative map, which reveals 107 conserved segments, seems to be almost definitive, as roughly all the genome is covered by the 255 coding sequences mapped in common. We hope that this update of the goat map with many type I loci will help in utilizing human data in livestock research and evolutionary biology.
METHODS
Primer Selection
Microsatellites were chosen to anchor the genetic map and make it possible to orient all the linkage groups. Genes were chosen from the human gene map or among anchored reference loci (O’Brien et al. 1993), focusing particularly on regions of synteny breakage (boundaries) or regions where no gene has been assigned previously in cattle. Genes were also selected within synteny regions to address internal rearrangements. We used Genome Data Base (GDB) (at the mirror sitewww.gdb.infobiogen.fr) to select genes within desired regions and to find the corresponding sequences. When the intron/exon structure was known, the BLAST algorithm was used at National Center for Biotechnology Information (NCBI) (www.ncbi.nlm.nih.gov) to look for homologous genes and to define consensus exonic sequences between different species (rat, mouse, pig, horse, cattle, and sheep in most cases). For human genes with an unknown structure, BLAST or ENTREZ were used to find this information in other species. Genes were generally rejected when no structural information was available. Consensus primers were then selected within conserved exons in order to produce amplified fragments averaging 100–200 bp.
BAC Library Screening and FISH Mapping
Clones were isolated from a goat BAC library using PCR and miniprepped as described previously (Schibler et al. 1998). Insert size and DNA concentration were evaluated by field inversion gel electrophoresis (FIGE) on 1% agarose gels. FISH mapping experiments were carried out according to classical protocols (Piumi et al. 1998). Goat metaphase spreads were obtained from a 59 XY rob (6;15) primary cell line (Guillemot et al. 1991), cultivated in the presence of 5′ bromodeoxyuridine during the S phase of the cell cycle. R-banded chromosomes were identified according to the recommendations of the last cattle karyotype standardization meeting (Popescu et al. 1996).
BAC Subcloning and Microsatellite Isolation
Clones were grown for 16 hr in 3 ml of Luria-Bertani broth with 12.5 μg/ml chloramphenicol, starting from a single colony. BAC DNA was miniprepped using the standard protocol, digested to completion with Sau3A, and cloned in dephosphorylated pGEM4Z (Promega). Sublibraries were then screened using (TG)10 and (TC)10 oligonucleotides labeled with the Boehringer DIG 3′-end labeling kit. Positive clones were detected after two stringency washes (0.5× SSC, 0.1% SDS at 58°C), using the Boehringer DIG luminescent detection kit.
Microsatellite Typing and Linkage Analysis
Microsatellite typing was carried out using the goat families described previously and the protocol described in Vaiman et al. (1996)with minor modifications: Genotypes were determined by PCR using 50 ng of DNA, 1 unit of Taq polymerase (Promega), 1 μCi [α33P] dATP, and 1.5 mm MgCl2 in a 10-μl reaction volume. Deoxynucleotide concentrations were 100 μm for dCTP, dGTP, and dTTP and 10 μm for dATP.
Linkage analysis was performed using CRI-MAP software (Green et al. 1989) according to the following procedure: Preliminary linkage groups were established according to the two-point lod score values (>3). These groups were then analyzed with the additional markers with the “build” option of CRI-MAP (PUK_LIKE_TOL fixed to 1.5), using cytogenetically mapped markers as ordered loci. The resulting orders were tested against alternative orders using the “flips” option of the software. Finally the “chrompic” option was used to check for unlikely double recombinants and to eliminate typing errors. The localization of markers that could not be incorporated was displayed in the most probable interval, by a line parallel to the linkage group.
Acknowledgments
This work was partly supported by grants from the Groupement de Recherches et d’Etudes sur les Génomes (GREG) and the AIP Genome et Fonction (cartographie comparée).
The publication costs of this article were defrayed in part by payment of page charges. This article must therefore be hereby marked “advertisement” in accordance with 18 USC section 1734 solely to indicate this fact.
Footnotes
-
↵1 Corresponding author.
-
E-MAIL schibler{at}biotec.jouy.inra.fr; FAX 33-1-34652478.
-
- Received April 23, 1998.
- Accepted July 23, 1998.
- Cold Spring Harbor Laboratory Press


