
Two Large Families of Chemoreceptor Genes in the NematodesCaenorhabditis elegans and Caenorhabditis briggsae Reveal Extensive Gene Duplication, Diversification, Movement, and Intron Loss
Abstract
The str family of genes encoding seven-transmembrane G-protein-coupled or serpentine receptors related to the ODR-10 diacetyl chemoreceptor is very large, with at least 197 members in theCaenorhabditis elegans genome. The closely relatedstl family has 43 genes, and both families are distantly related to the srd family with 55 genes. Analysis of the structures of these genes indicates that a third of them are clearly or likely pseudogenes. Preliminary surveys of other candidate chemoreceptor families indicates that as many as 800 genes and pseudogenes or 6% of the genome might encode 550 functional chemoreceptors constituting 4% of the C. elegans protein complement. Phylogenetic analyses of the str and stlfamilies, and comparisons with a few orthologs in Caenorhabditis briggsae, reveal ongoing processes of gene duplication, diversification, and movement. The reconstructed ancestral gene structures for these two families have eight introns each, four of which are homologous. Mapping of intron distributions on the phylogenetic tree reveals that each intron has been lost many times independently. Most of these introns were lost individually, which might best be explained by precise in-frame deletions involving nonhomologous recombination between short direct repeats at their termini.
[Alignment of the putatively functional proteins in the str and stl families is available from Pfam (http://genome.wustl.edu/Pfam); alignments of all translations are available at http://cshl.org/gr; alignments of the genes are available from the author at hughrobe{at}uiuc.edu]
Olfaction in mammals appears to involve combinatorial perception of particular chemicals by olfactory receptor proteins expressed by a very large family of genes, as many as 1000 or at least 1% of the mammalian gene complement (Buck and Axel 1991; Issel-Tarver and Rine 1997). These chemoreceptors are members of the large serpentine receptor superfamily having seven transmembrane regions and linking to G-proteins within the cell, and are most similar to the seritonin, adrenergic, and adenosine receptors (Buck and Axel 1991). One has been demonstrated recently to mediate perception of octanal and related chemicals in rats (Zhao et al. 1998). The genes are intronless and commonly occur in tandem arrays (e.g., Ben-Arie et al. 1993;Sullivan et al. 1996), as do homologs in fish (Barth et al. 1997). In addition, two quite different families of candidate receptors with seven transmembrane regions not obviously related to this superfamily by amino acid sequence, are expressed in the mammalian vomeronasal organ (Dulac and Axel 1995; Herrada and Dulac 1997; Matsunami and Buck 1997). The only other animal group in which progress has been made in characterizing chemoreceptors is the nematode Caenorhabditis elegans, in which five divergent families of candidate chemoreceptors were identified as annotated genes in clones from the nematode genome project (Troemel et al. 1995). These too are serpentine receptors, at best very distantly related to the large superfamily containing the mammalian olfactory receptors. The families were namedsra, srb, srd, sre, and srg, and at that time had 2–13 members each. Subsequently, Sengupta et al. (1996) used a genetic screen to identify animals defective only in the ability to detect diacetyl, an attractant chemical, and on cloning and sequencing found that this odr-10 gene encodes a distinct receptor expressed in the AWA sensory neuron that mediates attraction to volatile chemicals (Bargmann and Mori 1997). Expression of this ODR-10 receptor protein in sensory neuron AWB, which is known to mediate repulsion from diverse chemical stimuli (Bargmann and Mori 1997), led to repulsion from diacetyl, elegantly confirming the chemical specificity of the ODR-10 receptor and providing a simple mechanism for olfactory coding in nematodes (Troemel et al. 1997). Furthermore, this ODR-10 chemoreceptor mediates perception of diacetyl when expressed in mammalian cells (Zhang et al. 1997).
Here I show that odr-10 is a member of a very large family of genes (at least 197 members), called str genes by Troemel et al. (1997) who noted the large size of the family. This gene family is closely related to another, which is called the stl family (for str-like) here, with at least 43 members. Approximately 70 of these are clearly or likely pseudogenes. These two families are more distantly related to the srd family (Troemel et al. 1995), which broadly defined, currently has ∼55 members. Examination of their phylogenetic relationships reveals many instances of typical gene family evolution by duplication in tandem arrays and subsequent divergence with frequent reduction to pseudogene status. Comparison with orthologs in Caenorhabditis briggsae indicates that this process is ongoing, with relatively recent gene duplications, movement of genes, and loss of introns. Reconstruction of ancestral intron/exon arrangements for the two families reveals a regular process of intron loss during evolution of these three families, with only occasional intron gain before and since these families originated. Together with the sra, srb, srd, sre, and srg families, as well as another large and several smaller previously unrecognized families, the number of candidate chemoreceptor genes and pseudogenes in the nematode genome approaches 800, of which perhaps 550 are functional, constituting 4% of their protein complement.
RESULTS
Two Large Gene Families
The C. elegans nematode genome project is ongoing, so searches for, and alignments of, genes were completed at the end of August 1997, at which time ∼70 Mbp of completed sequence and another 20 Mbp of incomplete sequence representing 80% of the genome was available. All publicly available sequences in GenBank were employed, as well as many unreleased (at the time) sequences from the Washington University Genome Sequencing Center (GSC) database and a few from the Sanger Centre in the HTGS database at the National Center for Biotechnology Information (NCBI). Aligned reconstructions of these genes were communicated to those annotating the sequences and have been used in the annotations for many of the apparently functional genes. Some of the pseudogenes that are identified by their close similarity to other chemoreceptors can, nevertheless, be annotated as apparently reasonable genes by removal or truncation of exons with in-frame stop codons or frameshifting insertions/deletions (indels); therefore, their present annotations are questionable. Comparison with the closest functional gene in the phylogenetic trees below readily reveals their pseudogene status. Most of these clones have now been completed, annotated, and deposited in GenBank, and so the genes are identified herein by the gene numbers given in the annotations in the format Clone#.gene# (the remainder are identified by letters for gene numbers, particularly the C. briggsae genes below).
A total of 197 C. elegans genes were identified in thestr family, defined somewhat arbitrarily as those whose intron positions are alignable with those of the odr-10 gene, of which 57 (29%) are certain or likely pseudogenes. The proteins encoded by these genes are readily alignable with each other for most of their length yet share as little as 15% amino acid identity with each other (Fig. 1). Forty-three C. elegans genes were identified in the closely related stl family, with 14 (33%) certain or likely pseudogenes. They form a more cohesive grouping, with distinct placement of four of eight ancestral introns relative to those of the str family (see below) and share at least 25% amino acid identity with each other. They are readily aligned with thestr family members, with only a few possible ambiguities in the transmembrane (TM) domain 4 and 5 regions, but generally share <15% amino acid identity with str family members. A Kyte–Doolittle hydrophobicity plot (Fig. 2) for one of these, F37B4.11, shows how the seven transmembrane regions are usually readily identified. Because there have been several independent intron gains within the family the distantly related srdfamily is less readily defined, and by various definitions, could be split into two to four families. This family is more distantly related to the str and stl families, with no introns in placements clearly identical to those of the str orstl families. It contains 55 C. elegans genes, and alignment with the str and stl families lacks confidence in the TM domains 4 and 5; it is used here only to orient analysis of the str and stl families.Sonnhammer and Durbin (1997) provide an alignment and phylogenetic analysis of the srd family. Many of the apparent pseudogenes in these families have multiple stop codons, frameshifts, or large indels that are unlikely to be sequencing errors, therefore it is reasonable to conclude that even those with singe stop codons or single-base indels are pseudogenes, rather than resulting from sequencing errors as Troemel et al. (1995) suggested. In addition, the sequencing accuracy rate of 99.99% for the nematode genome project (Waterston et al. 1997) makes it unlikely that these apparent pseudogenes result from sequencing errors.
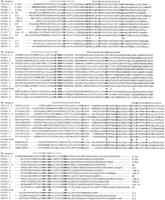
Alignment of the encoded amino acids of representative chemoreceptors. Single and double representatives of each of the small and largestr subfamilies, and three representatives of the stlfamily are shown, with the subfamily/family designations indicated at the beginning and end of the sequences. The seven TM domains are indicated above the alignments following Sengupta et al. (1996) for ODR-10 (C53B7.5). The alignments readily divide into blocks corresponding to these domains, with length variants between them. The conserved amino acid positions used to anchor the alignments are highlighted in bold, and shown on the line between the str andstl families, as are the inferred ancestral intron positions.
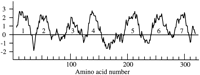
Kyte-Doolittle hydrophobicity plot for the protein encoded by gene F37B4.11, representative of the stl family of chemoreceptors. The transmembrane regions are numbered.
Phylogenetic analysis of the 257 str and stl family members was performed by use of maximum parsimony. Figure3 is an arbitrary representative of the 72 equally parsimonious trees of 30,208 steps obtained, rooted by designating the stl family as the outgroup (on the basis of analyses of representatives of the three families, with thesrd family as the outgroup). This tree length was obtained by just 1 of 12 replications; therefore, it may not be the most parsimonious possible. A single tree is shown in detail to reveal the level of similarity between the proteins encoded by various genes, by use of the ACCTRANS algorithm to reconstruct branch lengths, which yields actual distances for close relatives (Swofford 1993). Bootstrap confidences for the branching patterns in this tree were evaluated separately for each of the major subfamilies in the strfamily, and for a reduced data set of 95 representative sequences to evaluate the reliability of the subfamily definitions (see below). Generally, there is good bootstrap support for many terminal relationships, many small and large clades within subfamilies, and most subfamilies; however, within the large subfamilies there is usually little bootstrap support for the overall architecture of the relationships, and there is no support for the relationships of the subfamilies to each other.
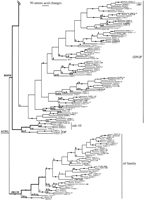
Phylogenetic tree relating 257 members of the str andstl families of chemoreceptors. The str subfamilies are indicated. Branch lengths are proportional to the number of inferred amino acid changes. Bootstrap support above 75% is indicated by a large dot on the branch supporting the relevant node, with a small dot indicating bootstrap support of 50%–75%. Lowercase letters above branches indicate inferred intron loss, whereas uppercase letters indicate intron gain. Double thickness lines connect hypothetical ancestral genes inferred to have retained the full complement of eight introns in each family. C. briggsae genes are indicated by boldface type and all start with the letter G. Pseudogene status is indicated by symbols after each gene name: (?) Loss of start codon or questionable intron boundary; (*) in-frame stop codon; (#) frameshift or large indel.
Subfamilies are recognized and named for several lineages of thestr family to facilitate descriptions (no subfamilies are readily recognized within the stl family, consistent with its greater homogeneity). Definition of these subfamilies by amino acid sequence and/or intron loss is not absolute, because several share features, and within otherwise well-defined subfamilies sometimes one of the defining sequences has changed in a subgroup. For simplicity, the only sequence features used are the usually conserved DP pair in TM domain 7 (Fig. 1), but intron losses also help define subfamilies (Fig.3). The tiny DP subfamily has just three members, all of which have lost introns b, e, and f. The odr-10 subfamily is a heterogeneous group without obvious unifying sequence features or intron losses that nevertheless groups together consistently in phylogenetic analyses and includes the canonical odr-10 gene (gene C53B7.5). Most members of the large (DN)P subfamily encode DP, but there is a subgroup encoding NP within it, and all have lost intron e. The EP subfamily is exceptionally well defined and homogeneous in sequence, with loss of introns c, d, e, f, and g also helping define it. The (DE)P subfamily has DP in its basal members, then after loss of intron e, the apical members have EP. The str subfamily is the smallest comprised of the two genes F57A8.3 and T26H5.a (the latter a pseudogene), which have few defining sequence features but consistently branch together with 100% bootstrap support and have lost their terminal introns a and h. The small DQ subfamily members also share loss of intron a (although they group with the str subfamily in Figure 3, this relationship has no bootstrap support and it is likely that intron a was independently lost in the ancestors of these two subfamilies). Members of the small D(PA) subfamily have lost introns g and h. Finally, the large D(SA) family has a subgroup that encodes DA. Although there is no bootstrap support for this subfamily [and the D(EP) subfamily], the members do consistently cluster together in phylogenetic analyses and do share recognizable sequence features.
Gene Duplication, Diversification, and Movement
The phylogenetic relationships of these chemoreceptors reveal interesting aspects of the molecular evolution of these families. Most prominently, the processes of gene duplication, diversification, and movement that must have led to these large gene families are ongoing. For example, the most recent duplication involves gene T08H10.2 in the D(SA) subfamily (Fig. 3), in which an inverse orientation duplication of 3126 bp that duplicates the 5′ half of the gene as pseudogene T08H10.a has occurred extremely recently because the duplicated sequences are identical.
An example of a somewhat older duplication are genes T03E6.1 and T03E6.4 in the (DE)P subfamily. Their encoded proteins are 97% identical, with seven of the eight amino acid changes in or near TM domain 4. These two genes are part of a 2.6-kb tandem duplication separated by a stretch of 6 kb that includes another chemoreceptor pseudogene, T03E6.2, and a zinc finger protein pseudogene, T03E6.3, in the opposite orientation. The exon regions of genes T03E6.1 and T03E6.4 are 97% identical, and 21 of the 29 base changes are silent. The introns are readily alignable, although they have several indels up to 100 bp and, excluding those, are 89% identical (88 changes in 817 bp). The 107 bp of 5′-untranslated region and 586 bp of 3′-untranslated region that complete the duplication differ by a few short indels and are 98% identical (16 changes in 692 bp). It is unclear why the introns should have diverged so much more rapidly in sequence and length than the flanking DNA.
A still older duplication led to F31F4.8 and F31F4.16 in thestl family, which encode proteins with 87% identity, the 44 amino acid differences distributed throughout the proteins in this case. The exons of these two genes are 84% identical, whereas the introns are unalignable. Two-thirds of these exon changes are silent or synonymous, and because the number of positions at which synonymous changes might occur is generally about one-quarter of the total, the occurrence of synonymous changes, Ks, is 11-fold higher than the occurrence of amino acid replacement or nonsynonymous changes, Ka (Ks = 0.79 ± 0.09; Ka = 0.07 ± 0.01), implying strong selection for functionality of these genes. All other comparisons of similarly or more divergent genes yield similar results, with Ks/Ka ratios above 10 and unalignable introns, and are comparable with the interspecific comparisons below. For example, gene F10D2.4 is the closest relative of the canonical odr-10 gene (C53B7.5), yet their translations are only 83% identical (54 differences of 314 alignable amino acids—the last exon is unalignable), whereas their alignable exons share only 73% DNA identity and their introns are unalignable.
Troemel et al. (1995) found several of their candidate chemoreceptor families as large series of duplicated genes in particular clones, and there are several such examples in this data set. Thus, most of the EP subfamily consists of 11 genes in various orientations in the overlapping clones F10A3 and K05D4 and the apex of the stlfamily consists of 10 genes in clone T03D3 alone with several closely related genes in other clones. On the other hand, clone C34D4 provides an example of four genes in the D(SA) subfamily, which duplicated recently, and then three became pseudogenes by virtue of multiple indels, including a 1940-bp insertion of multiple repeats of an 11-bp segment in C34D4.5.
Troemel et al. (1995) found the original five families of candidate chemoreceptors by searching for operons that might include chemoreceptors along with other components of the chemoreception transduction system, for example a transmembrane guanylyl cyclase; however, none of these genes appeared to be parts of operons. The same appears to be true of the genes described here, with no evidence of any of them being part of operons, either as tandem duplicated genes or with other chemoreceptors or other components of the transduction system. This conclusion is based on their separation from each other and other genes by at least 400 bp, most known operons having their tandemly arrayed genes separated by <400 bp (Spieth et al. 1993;Blumenthal and Steward 1997).
Intron Evolution
The intron/exon structures of these genes were extremely useful guides in their reconstruction, a feature noted for other large multigene families (e.g., Brown et al. 1995), and it soon became evident that ancestral intron arrangements could be established readily for the str and stl families. These are shown schematically in Figure 4, with their positions indicated more precisely in Figure 1. The common ancestors of these families appear to have had eight introns, roughly evenly distributed along the length of the gene, although the first exon is rather long. Comparison of these two family ancestors indicates that four introns (a, c, e, and g) are in identical positions, with respect to the aligned amino acids, and in the same phase. It seems reasonable to conclude that these introns were shared from a common ancestor of the two families rather than chance independent insertions in exactly the same positions, so they are given the same letters and treated as homologous. In contrast, the other four inferred ancestral intron placements in the two families are different, with introns b and j 28 bp apart, d and k 47 bp apart, f and l 39 bp apart, and h and m 101 bp apart (the first two and last pairs are therefore also in different phases). These pairs of four introns may have been gained independently in the ancestors of the two families, or particular introns may have been lost from a common ancestor and regained in the ancestor of one or the other family (for review, see Stoltzfus et al. 1997). Unfortunately, none of these introns is shared with the more distantly related srd family, so their origins are unclear.
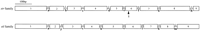
Reconstructions of the ancestral intron placements for the strand stl families of chemoreceptor genes. Exons are shown as open numbered boxes of roughly accurate length, whereas introns are shown as lettered lines. The phases of the introns are shown above them: (0) Between codons; (1) between the first and second bases of a codon; (2) between the second and third bases of a codon. (Arrowhead) The position of insertion of intron i.
Within the str and stl families, the vast majority of intron changes involve loss. Mapping these losses on the phylogenetic trees revealed that most are easily mapped parsimoniously (Fig. 3). The only obvious difficulty in assigning intron losses parsimoniously to particular branches involves gene T19H12.7 in the D(SA) subfamily, which is unlikely to have lost six introns independently; and slight rearrangement of the tree in this region, where it is not strongly supported by bootstrapping anyway, would yield a single intron loss for this lineage instead of six. It is difficult to include intron losses as characters in estimating the tree because it is unclear how heavily intron losses should be weighted relative to single amino acid changes, and inclusion of an intron presence/absence matrix greatly increases the computational complexity making analyses of this large data set intractable. Intron losses would have considerable value as phylogenetic characters, particularly in that losses are presumed to be irreversible, and would probably lead to minor rearrangements of the phylogenetic trees making the mapping of intron losses slightly more parsimonious [e.g., near the base of the (DN)P subfamily]. This mapping, nevertheless, demonstrates how frequent these losses are, involving many independent losses of each intron in disparate lineages. Within the stl family, the eight intron arrangement (Fig. 4) was apparently maintained until it had undergone at least four duplications (see thick branches in Fig. 3), until intron g was lost from the lineage leading to most of the family. The other four lineages apparently lost several introns independently, and altogether, 28 intron losses are inferred to have occurred in this family in theC. elegans lineage. Within the str family, all eight introns were apparently retained through 15 duplications. The EP subfamily is particularly unusual, with five introns lost in the founder of this subfamily and none subsequently. At least 137 intron losses are inferred to have occurred in the str family, excluding the likely inflation of losses of introns in the D(SA) subfamily noted above.
In contrast, there is just one instance of obvious intron gain within a family. In the str family, two closely related genes near the base of the D(SA) subfamily (C05E4.2 and C08F1.a) that form a clade on the basis of amino acid sequences (see Fig. 3) have acquired intron i 20 bp distal to the position of intron e, which they had lost earlier, with phase 0 instead of 2 (this intron i was subsequently lost from C08F1.7).
Given this high rate of intron loss, it is perhaps no surprise that no gene in the str or stl families has all eight ancestral introns; however, several have retained seven introns. In thestr family, these are C53B7.5 and F10D2.4 in the odr-10 subfamily, C50B6.10 at the base of the D(SA) subfamily, a group of genes at the base of the (DN)P subfamily (T08B6.3 and T08B6.6, F55B12.6, and ZK697.a), and a group near the tip of the (DE)P subfamily (C12D5.1, F58G4.6, M01D1.1, and T03E6.1 and T03E6.4). The only gene in the stl family retaining seven introns is the C. briggsae gene G46G14.a (see below). In contrast, four genes have just one intron remaining [F37B4.12, R13D7.1, C50H11.12, and R11G11.15 in the D(SA) subfamily]. No genes have lost all eight introns, perhaps just by chance, or perhaps because at least one intron is necessary for efficient expression of nematode genes (e.g., Okkema et al. 1993).
In other respects, the introns in these genes resemble those of otherC. elegans genes (for review, see Blumenthal and Steward 1997), particularly in being generally short, between 40 and 60 bp, with some longer introns including one of 2269 bp, which includes the gene F58G4.3 (see below). The vast majority have boundaries consistent with the consensi, in particular the GT/AG dinucleotides, as well as the T at −5 in the 3′ acceptor splice site. Most of those with variants from the consensi were in genes otherwise recognized as pseudogenes, whereas a few aberrant sites were in otherwise acceptable genes that might be pseudogenes. Only three convincing exceptions, the first intron of F58G4.5 (intron a), the first intron of R09E12.7 (intron c), and the fifth intron of F07B10.2 (intron g) begin with GC instead of GT. This is a functional exception seen previously at a similarly low frequency (Blumenthal and Steward 1997).
C. briggsae Homologs
Comparative methods often provide a wealth of information about gene evolution, and for this reason the Washington University GSC has begun to sequence clones from C. briggsae. Comparisons withC. briggsae have been employed previously to illuminate the conserved regions of promoters, because most noncoding sequences such as introns have diverged between these congeners (e.g., Zucker-Aprison and Blumenthal 1989; Heschl and Baillie 1990; Kennedy et al. 1993;Gilleard et al. 1997). With ∼4% of the genome sequenced, C. briggsae provides 17 genes on 6 clones to compare with theseC. elegans genes. None of these clones had been annotated and deposited in GenBank at the time of this writing; however, they are available from the Washington University GSC database (Genome Sequencing Center, pers. comm.). The phylogenetic relationships of these genes are shown in Figure 3, with the C. briggsae genes in boldface type (the clone numbers all begin with G), and details of the orthologous comparisons are shown in Table 1. The levels of divergence between orthologous genes are comparable with those seen previously for a variety of other genes (summarized in de Bono and Hodgkin 1996).
Comparison of C. briggsae Chemoreceptor Genes with Their C. elegans Orthologs in thestrFamily
Convincing C. elegans orthologs were available for 13 of the 17 C. briggsae genes, consistent with 80% of the C. elegans genome being completed. Convincing orthologs were considered to be those on clones that shared several other genes in reasonable, but not necessarily perfect, synteny (e.g., Kuwabara and Shah 1994). They generally encoded proteins that were colinear with each other, except that sometimes the amino and commonly the carboxyl termini differed in length. The carboxyl termini often were unalignable and, if so, these regions were excluded from the analyses.
The most remarkable comparisons are in the D(EP) and D(PA) subfamilies, in which clone G47M22 from C. briggsae has 11 genes that are clear orthologs of genes on the overlapping C. elegans clones F58G4 and C09H5. The spatial relationships of these genes to each other are shown in Figure 5. Several aspects of this comparison are informative. First, the ortholog of C. elegansgene C09H5.8 in C. briggsae has been duplicated into G47M22.f and g because the species split (the latter two share 81% amino acid identity, a single amino acid deletion near the carboxyl terminus relative to C09H5.8, and cluster together in the tree; Fig. 3). C09H5.8 appears to have become a pseudogene since then, having a mutated donor splice site in the first intron. Second, C09H5.4 and C09H5.5 are probably recently duplicated genes within C. elegans because C09H5.5 shares 85% amino acid identity with G47M22.k (unfortunately truncated by the end of the clone), whereas C09H5.4 shares 85% amino acid identity with C09H5.5 over this region and only 80% with G47M22.k. Third, the C. elegans ortholog of G47M22.h has apparently moved to clone M01D1 (or T03D3), and the ortholog of G47M22.i is missing (see Fig. 3 for relationships). Fourth, there is an unrelated gene (F58G4.3) within the first intron of C. elegansgene F58G4.2 that is not present in the C. briggsae ortholog G47M22.a, so it must have moved in one of the species. This is one of two possible examples of a gene within an intron in this data set, although it remains to be demonstrated that F58G4.2 is transcribed and processed correctly (F58G4.3 is annotated to encode a 247-amino-acid protein of unknown function) [the other example involves annotated gene C03E7.14, which is within an intron of a pseudogene, F26G5.a in the (DN)P subfamily, that starts in clone F26G5 and continues in C02E7].
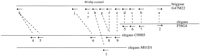
Schematic diagram of the chemoreceptor genes on C. briggsaeclone G47M22 and their C. elegans orthologs. The C. elegans clones F58G4 and C09H5 overlap. Broken lines indicate the orthologous relationships, with no ortholog identified for G47M22.i and M01D1.1 being the most likely ortholog for G47M22.h.
Two other C. briggsae clones with members of the (DN)P subfamily are G36C02 and G45J08. Their orthologs in C. elegans, genes C31E10.1, C06B3.1, and C06B3.9, respectively, are clear on the basis of degree of similarity, colinearity, synteny of adjacent genes, and phylogenetic relationships (Table 1; Fig. 3). InC. elegans, C06B3.9 appears to have been duplicated since the divergence from C. briggsae, with the duplicated gene (T09F5.4) sharing 75% amino acid identity and clustering confidently with C06B3.9 in the tree (Fig. 3). T09H5 is not an adjacent clone to C06B3.9, so this duplicated gene appears to have moved. These orthologs are less conserved between the two species (Table 1), sharing only 59% encoded amino acid identity on average, versus 80% on average for the G47M22 genes above, perhaps because they are either clearly pseudogenes with large deletions or insertions often causing frameshifts, or likely pseudogenes with aberrant splice junctions or missing start codons. Even seemingly functional genes such as G45J08.a and C06B3.9 might no longer be expressed. Orthologs could not be identified for a gene in the D(SA) subfamily (G40L08.a) and the two genes in the stlfamily (G45C02.a and G46G14.a).
Two other features of these interspecies comparisons are particularly interesting. First, as expected, the introns and most of the 5′- and 3′-flanking sequences have diverged so much that they are unalignable. Consistent with this level of divergence, the frequency of synonymous changes, Ks, is extremely high (averaging 2.0 where measurable, and generally 10- to 20-fold higher than the frequency of nonsynonymous changes) and commonly has reached saturation and is therefore unmeasurable. Even comparisons of pseudogenes between the species give Ks/Ka ratios of ∼10, indicating that they became pseudogenes after the species split. Second, although most introns are still shared in particular positions in these genes, four or 3% [4/(60 × 2) = 0.03] have been lost since the species split, remarkably all from C. briggsae genes.
DISCUSSION
These are the largest families of genes yet reported in theC. elegans genome and confirm the impression of Waterston et al. (1997) that seven TM G-protein-coupled or serpentine receptors will constitute the largest single fraction of the nematode genome. Thestr family alone constitutes at least 1% of the gene complement of this nematode, estimated at 14,000 genes by Waterston et al. (1997). This family alone is therefore proportional in size to the huge family of olfactory receptors in mammals. There is every reason to believe that these are all chemoreceptors given their close relationship to the only chemoreceptor in animals discovered by functional genetics and associated with perception of a particular chemical, the ODR-10 diacetyl receptor (Sengupta et al. 1996; Troemel et al. 1997; Zhang et al. 1997). It is difficult to imagine what other function such large families of genes might serve. Troemel et al. (1995) identified five families of candidate chemoreceptors of which the srd family was the smallest with two members. Broadly defined, this family currently has at least 55 members (see alsoSonnhammer and Durbin 1997). Preliminary examination of the others by TBLASTN searches of the combined Washington University and Sanger Centre GSC databases indicates that they are similarly large (see alsoTroemel et al. 1997), and there are at least another five small families and one large family of ∼200 serpentine receptor genes. This preliminary survey brings the total of candidate chemoreceptor genes and pseudogenes to ∼800 or 6% of the nematode gene complement. If only two-thirds are functional, as appears to be the case for the combined str and stl families, thenC. elegans may have 550 functional chemoreceptors constituting 4% of its proteins.
Presumably, these hundreds of receptor proteins are involved in detection of the many water-soluble and volatile chemicals that this nematode can perceive (Bargmann and Mori 1997). Troemel et al. (1995)demonstrated that representatives of their five families are probably expressed in the chemosensory neurons by examining expression of fusion genes under control of their promoter regions. There are just 32 chemosensory neurons, and it seems likely that each receptor gene is only expressed in one neuron (Troemel et al. 1995); therefore, on average, 17 different genes must be expressed in each cell. They are probably not expressed at high levels because there are no ESTs for any of the genes described here among the ±19,000 C. eleganssequences in dbEST.
The apparent absence of operon organization for these genes is surprising, given that ∼25% of C. elegans genes are expressed in operons (Spieth et al. 1993; Blumenthal and Steward 1997). It would seem efficient to have all the chemoreceptors that are expressed in a particular sensory neuron expressed as a single operon; however, that level of efficiency is perhaps beyond the evolutionary constraints imposed by the apparent evolutionary behavior of these genes, that is, frequent duplication and diversification to perceive new chemicals.
The patterns of gene evolution in these families are similar to those reported for other large families of genes (e.g., Nei et al. 1997), including the olfactory receptors of mammals (e.g., Ben-Arie et al. 1993; Sullivan et al. 1996). Particularly prominent are the ongoing duplication of genes, their rapid diversification, the large number of pseudogenes, and the frequent movement of genes around the genome. The high number of pseudogenes is apparently unusual for C. elegans and, even then, is probably a severe underestimate of the total number of pseudogenes ever generated, because most are expected to be lost fairly rapidly by deletion (see Petrov et al. 1996; Petrov and Hartl 1997). Perhaps most interesting is the pattern of intron evolution. Within the str and stl families there is only one instance of intron gain or movement versus 165 inferred intron losses. It seems very unlikely that any intron might be regained in the exact position and phase from which it was lost, because there is no known mechanism for homing of typical eukaryotic spliced introns. Furthermore, the pattern of intron loss is readily mapped in a parsimonious fashion on the phylogenetic trees of these families, indicating that reacquisition of a lost intron need not be invoked.
Following Lewin (1983) and Fink (1987), intron losses are usually explained as resulting from homologous recombination with a reverse transcript of the mRNA from a gene. A reasonable prediction of this model would be that introns should commonly be lost together, unless these gene conversion tracts are for some reason uniformly short. The pattern of intron losses in Figure 3 does not fit this prediction because in most cases introns are lost individually. Sixty-one losses can be assigned individually to single branches of the tree. When multiple losses are assigned to individual branches, 57 are not adjacent introns, and so are unlikely to have been lost simultaneously. The remaining 21 adjacent pairs and three adjacent triplets of losses might best be explained as independent events that happened to occur during the time before a particular gene was duplicated. The only clear exception is the loss of introns c, d, e, f, and g during formation of the EP subfamily, which might have involved simultaneous loss of all five adjacent introns by homologous recombination with a reverse transcript of the ancestral gene. The overwhelming pattern of individual losses of introns suggests that most occur by a different mechanism, most likely simple in-frame deletions. These might involve nonhomologous recombination stimulated by the common occurrence of short direct repeats in or near the 5′ and 3′ splice sites. Exons commonly end in sequences remarkably similar to the 3′ splice consensus of TTTTCAG, and the first base of introns is always G, which is commonly the first base of the next exon (see Blumenthal and Steward 1997; Long et al. 1998). Hence, direct repeats of 3–5 bp, and often longer, are common precisely at the end of one exon and the start of the next, and deletions between them that also remove one of the repeats would be in-frame and would lead to precise loss of the intron. For example, intron e of gene T03D3.2 in the stl family is flanked by TTTCAG/g at the 5′ end and tttcag/G at the 3′ end. Spontaneous deletions at short direct repeats are commonly seen in bacteria (e.g., Albertini et al. 1982), hamster cells (e.g.,Nalbantoglu et al. 1986), and humans (e.g., Henthorn et al. 1990), as well as inside P elements in Drosophila melanogaster (Engels 1989, p448) and Helena retrotransposons in Drosophila virilis and relatives (Petrov and Hartl 1997); although somewhat enigmatically the only systematic study in C. elegans did not find short direct repeats at the ends of most spontaneous deletions (Pulak and Anderson 1988).
Peering back into the history of these two families suggests that the mode of intron evolution may have been somewhat different when the ancestral genes were forming and first diversifying. First, the ancestral genes of these two families clearly differ by four introns, and these must have been gained independently by at least one of the ancestral genes. Second, during their early duplications and diversifications, there were no losses of introns for at least the first 4 duplications in the stl family and 15 duplications in the str family. Thus, the ancient pattern of intron evolution in these genes would appear to have involved more intron gains and fewer intron losses. These intron gains were presumably via insertions of transposons that are efficiently spliced from pre-mRNAs (e.g.,Rushforth and Anderson 1996). Alternatively, there were many duplications and diversifications of the ancestral genes, with just these two families persisting. For comparison, the pattern of intron evolution in the srd family is also mostly intron loss; however, there are also 12 inferred intron gains within that broadly defined family, perhaps reflecting its greater antiquity (H.M. Robertson, unpubl.).
Comparisons with confident orthologs in the congener C. briggsae confirm these patterns of molecular evolution, with gene duplication, diversification, movement, and intron loss all evident. Remarkably, all four intron losses in these orthologous gene comparisons during this time period occurred in the C. briggsae lineage, a bias that has been observed previously (e.g.,Xue et al. 1992; Kennedy et al. 1993; de Bono and Hodgkin 1996), indicating that even these two closely related nematodes have diverged at least in their tempo of intron evolution. Unfortunately, the antiquity of the separation of these two species cannot be confidently determined, because there is no fossil record to guide calibration of molecular clocks for this group. Estimates range from 10 to 100 million years ago; however all are highly speculative. Even the most careful treatment to date (Kennedy et al. 1993), which best estimates the numbers of synonymous changes between genes of these two species, relies on the equivalent rate of Drosophila gene divergence for dating. This is unlikely to be appropriate, given the rapid rates of evolution of other genes in nematodes relative even to these flies (Aguinaldo et al. 1997), presumably resulting from their extremely short generation times (for an example of effects of generation time on rates of molecular evolution, see Hafner et al. 1994). It is therefore not yet possible to estimate the rates of intron loss, gene duplication, and other interesting gene evolution patterns in these nematodes. Examination of the other candidate chemoreceptor families will determine whether these patterns of gene evolution are general to them all, and examination of other nematodes and other invertebrates might allow determination of when the families themselves formed, either before or during the evolution of nematodes.
METHODS
Preliminary searches of the nonredundant protein database maintained by the NCBI (GenBank CDS translations+PDB+SwissProt+PIR) for matches to the ODR-10 amino acid sequence (GenBank accession no. U49449) using BLASTP version 1.4 (Altschul et al. 1990) yielded tens of significant matches (noted by Sengupta et al. 1996). Few of these had comparable lengths, however, in retrospect, because most were annotated as incomplete or fused genes. Therefore, searches of the nonredundant DNA database at NCBI (Benson et al. 1998) were conducted using TBLASTN version 1.4 to recover the intron/exon arrangements of these genes, which were then aligned by eye in the editor of PAUP version 3.1.1 for the Macintosh (Swofford 1993). This process was repeated iteratively until most of the str family had been identified. It became obvious early on that the members of this family shared a subset of eight introns at exactly the same positions, with odr-10 itself having seven of these introns (Sengupta et al. 1996), so these intron/exon boundaries became useful landmarks, especially for alignment of pseudogenes. In addition, the NSPL program of GeneFinder was utilized from the Baylor College of Medicine WWW site (http://dot.imgen.bcm.tmc.edu:9331/gene-finder/gf.html) to help identify intron boundaries. A distinct group of related sequences with somewhat different intron placements was defined as the stlfamily, and the gene structures for this family were assembled separately as above. The encoded translations were similarly aligned by eye in the PAUP editor, and their alignments and relationships refined by successive phylogenetic analyses (alignments of the putatively functional proteins are available from Pfam (Sonnhammer et al. 1998); alignments of all translations and the genes are available from the author at hughrobe{at}uiuc.edu). Alignments of TM regions 1, 2, 3, 6, and 7 are unambiguous, being easily anchored by several highly conserved amino acids (see Fig. 1). The boundaries of TM domains 4 and 5 were sometimes difficult to align confidently within the strfamily and between the two families. Alignment of a representative subset of 95 sequences using Clustal W version 1.5 at default settings (Thompson et al. 1994) yielded the same blocks of aligned amino acids for the TM domains and differed only in minor points regarding placement of gaps between them. All amino acid positions were employed for the phylogenetic analyses to provide the maximum possible information within families and subfamilies, with any ambiguously aligned regions between families and subfamilies simply contributing to their level of distinction in the trees. Phylogenetic analysis was performed with maximum parsimony as implemented by PAUP version 3.1.1 for the Macintosh (Swofford 1993), using the heuristic algorithm for 12 replicate searches, each with random addition of sequences and tree-bifurcation-and-reconnection branch swapping (each search on a 120-MHz PowerMac 8500 took >18 hr and examined >150 million trees). Bootstrap analyses of subsets of the encoded proteins employed the heuristic algorithm and at least 100 replications. Molecular evolution of pairs of genes was assessed by computing the frequencies of synonymous (Ks) and nonsynonymous (Ka) base changes following Nei and Gojobori (1986) using the Macintosh program KsKaCalc (H. Akashi, pers. comm.).
Acknowledgments
I thank the Genome Sequencing Centers at Washington University, St. Louis, MO, and the Sanger Centre, Cambridge, UK, for communication of DNA sequence data prior to publication, John Spieth and Steve Jones for their encouragement and assistance in annotating these nematode genes, and David Lampe, Christina Nordholm, and two anonymous reviewers for comments on the manuscript. This work was supported by National Science Foundation grant IBN 96-04095.
The publication costs of this article were defrayed in part by payment of page charges. This article must therefore be hereby marked “advertisement” in accordance with 18 USC section 1734 solely to indicate this fact.
Footnotes
-
↵1 E-MAIL ; FAX (217) 244-3499.
-
- Received December 8, 1997.
- Accepted March 13, 1998.
- Cold Spring Harbor Laboratory Press


