
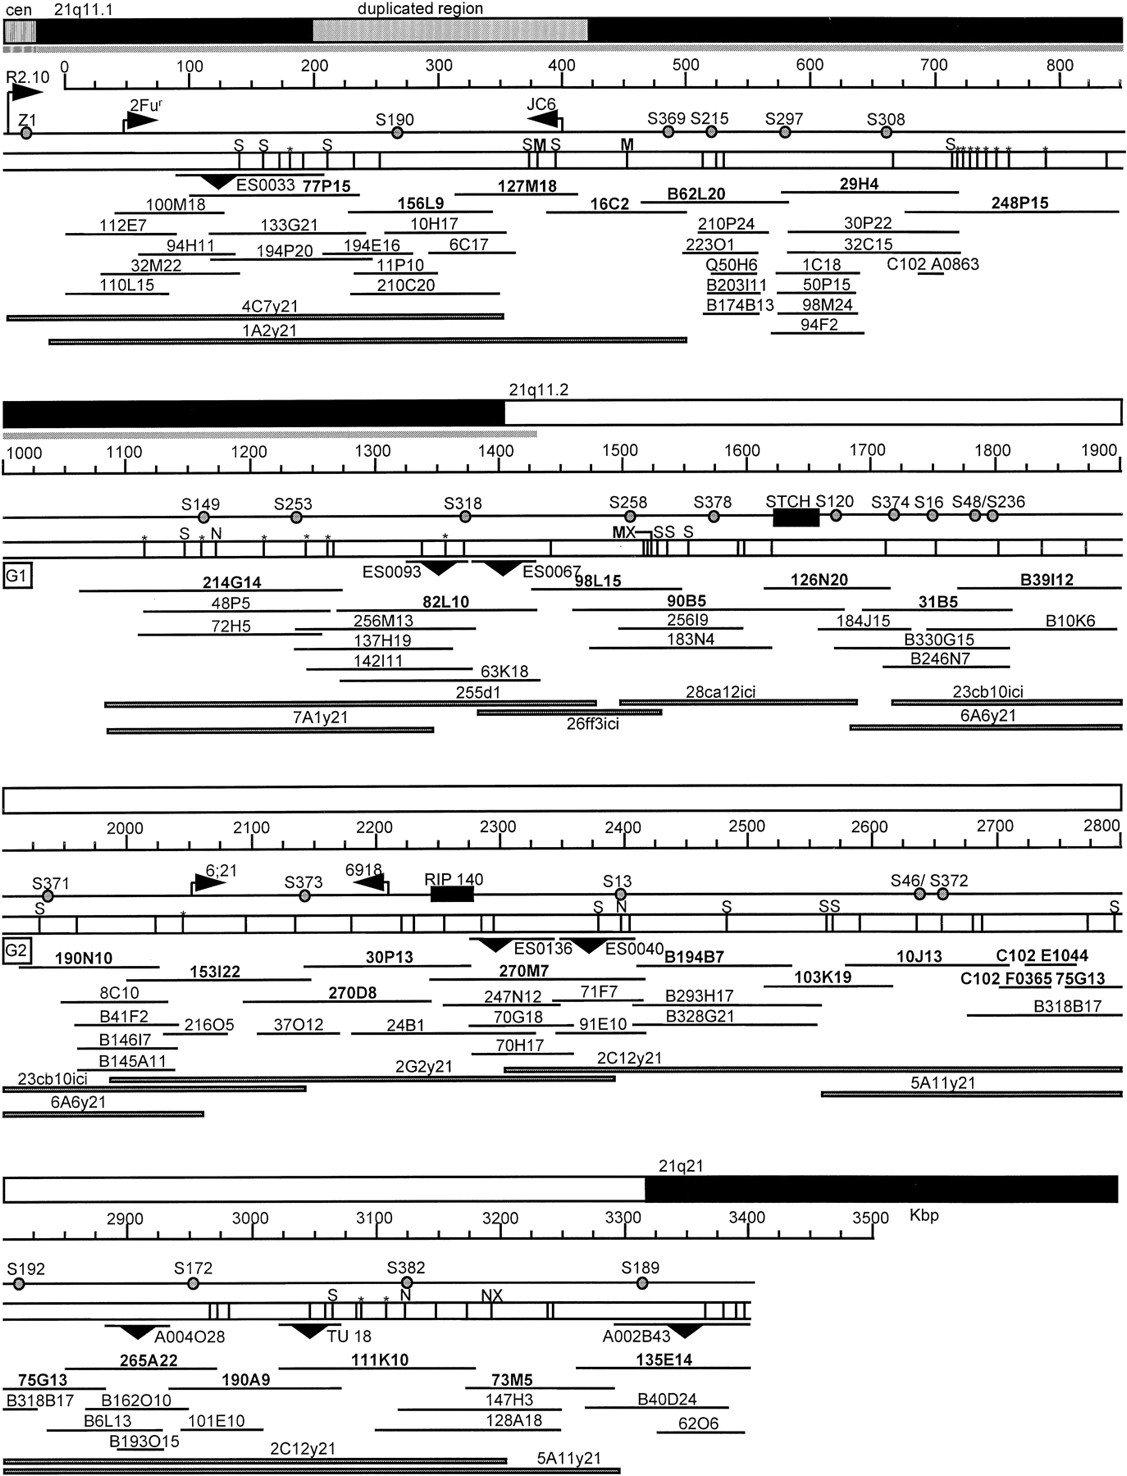
The integrated map of the 21q11–q21 region. The tophorizontal bars represent the cytogenetic (dark and light) bands, the direction of the centromere is indicated, and the region around D21S190 that is duplicated once more on 21q22.1 (Dutriaux et al. 1994) is shaded. The region of homology to other chromosomes is shown as a thin horizontal gray bar immediately underneath the cytogenetic bar level. The next horizontal level is the scale (in kb), followed by the line representing genomic DNA, containing symbols: (circles) STS or hybridization markers (D21 is omitted in their names); (solid rectangles) fully characterized genes; (bent arrows, pointingleft and right) segments contained within somatic cell hybrids on rodent background (whose names are given above the arrows) that were checked against STSs by PCR; below is an open bar representing the restriction map, vertical lines are restriction sites for XhoI (no letters or X), SalI (S), andNotI (N). Asterisks represent XhoI sites whose respective order in that segment could not be precisely determined. TheMluI sites described in text are shown as bold M restriction mapped to exact positions within PACs used (see Results). The only two gaps in the map are shown as open squares labeled G1 and G2 for gap 1 and gap 2, respectively, as referred to in the text. Lines underneath this bar with solid triangles pointing down represent limits of localization of ESs derived by cDNA selection or exon trapping, described in Cheng et al. (1994), Yaspo et al. (1995), and Schuler et al. (1996). The next level represents the PACs (from the library byIouannou et al. 1994), BACs (B in front of the clone name, from the library by Shizuya et al. 1992), or cosmids [c102 or Q in front of the clone name, for the library by Nizetic et al. (1991a) or the Lawrence Livermore library, respectively] drawn to scale. The clones contained in the MTP are shown in boldface type. The restriction map above refers only to these clones. The YAC clones described in Nizetic et al. (1994)are shown in the bottom horizontal level as thin gray bars.


