
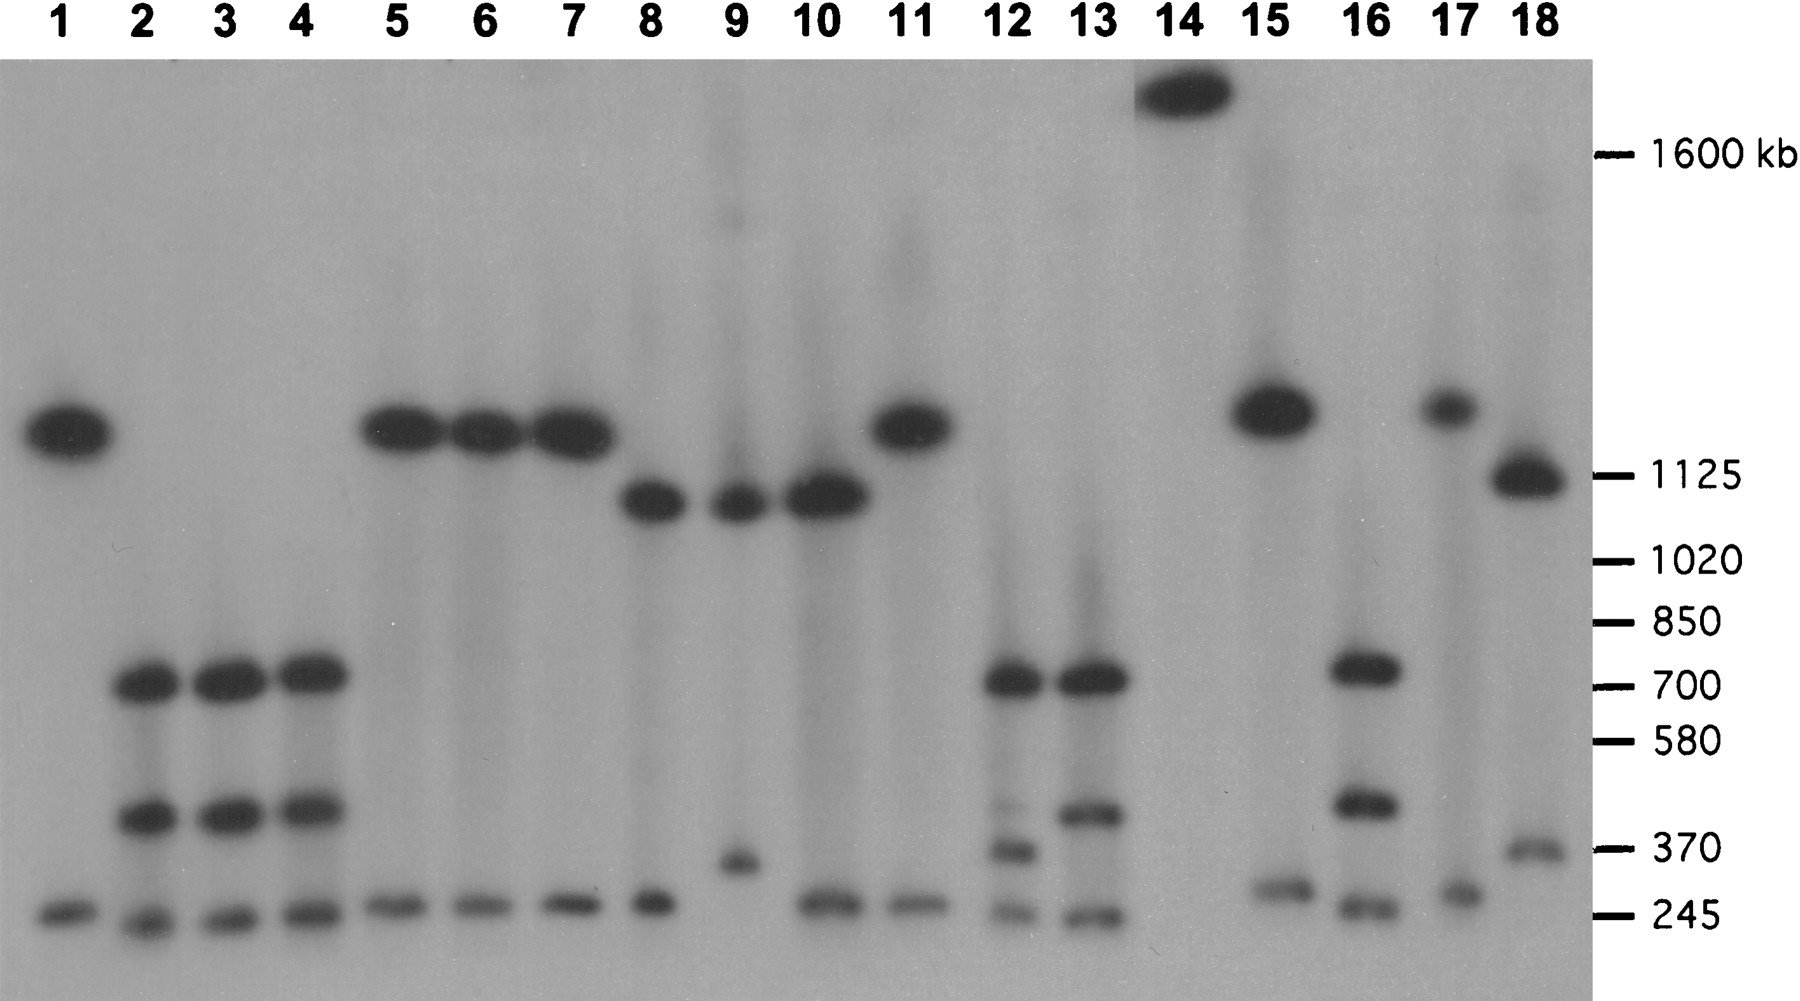
Pulsed-field gel analysis of the DXZ1 array in LT690. High molecular weight DNA was digested with one or two restriction enzymes, separated by electrophoresis, and probed with a DXZ1-specific probe. Fragment sizes were used to derive the restriction map shown in Fig 1A. Enzymes used for each digestion are BglI (lane 1);BglI/BglII (lane 2);BglII (lane 3);KpnI/BglII (lane 4); KpnI (lane 5); BglI/KpnI (lane6); BglI (lane 7);BglI/ScaI (lane 8); ScaI (lane 9); ScaI/KpnI (lane 10);KpnI (lane 11); ScaI/BglII (lane 12); BglII (lane 13);ApaI (lane 14); ApaI/BglI (lane 15); ApaI/BglII (lane16); ApaI/KpnI (lane 17);ApaI/ScaI (lane 18). The image is composed of two halves of the same gel, electronically spliced between lanes13 and 14. Selected S. cerevisiae size markers are shown at the right.


