
Figure 11.
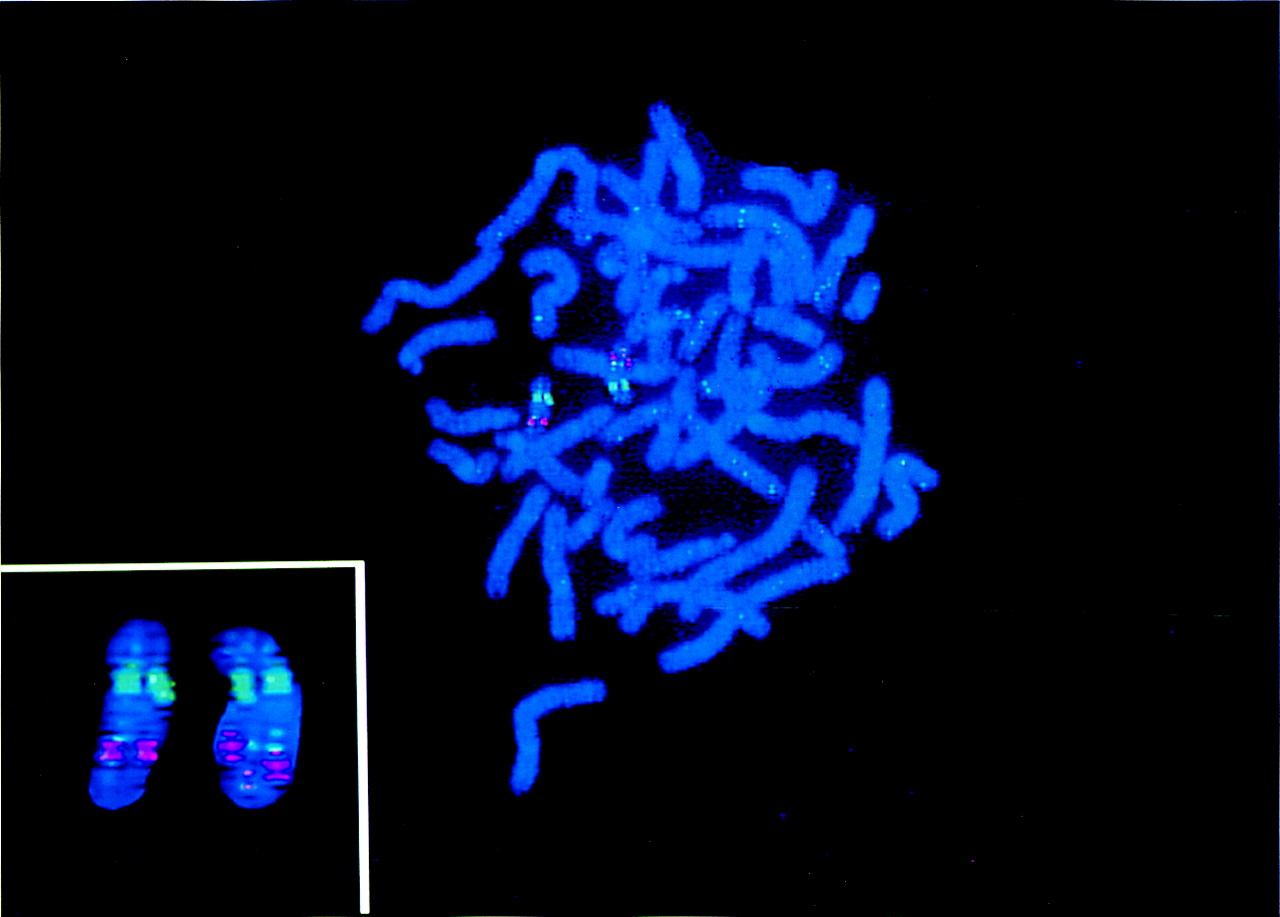
Cytogenetic mapping. BAC DNA is visualized by the light blue signal. The red signal is derived from the 19q13.1-specific probe. (Inset) Both chromosome 19 homologs enlarged.
(Downloading may take up to 30 seconds. If the slide opens in your browser, select File -> Save As to save it.)
Click on image to view larger version.
Cytogenetic mapping. BAC DNA is visualized by the light blue signal. The red signal is derived from the 19q13.1-specific probe. (Inset) Both chromosome 19 homologs enlarged.
 CiteULike
 Delicious
 Digg
Digg Facebook
 Google+
 Reddit
 Twitter
