
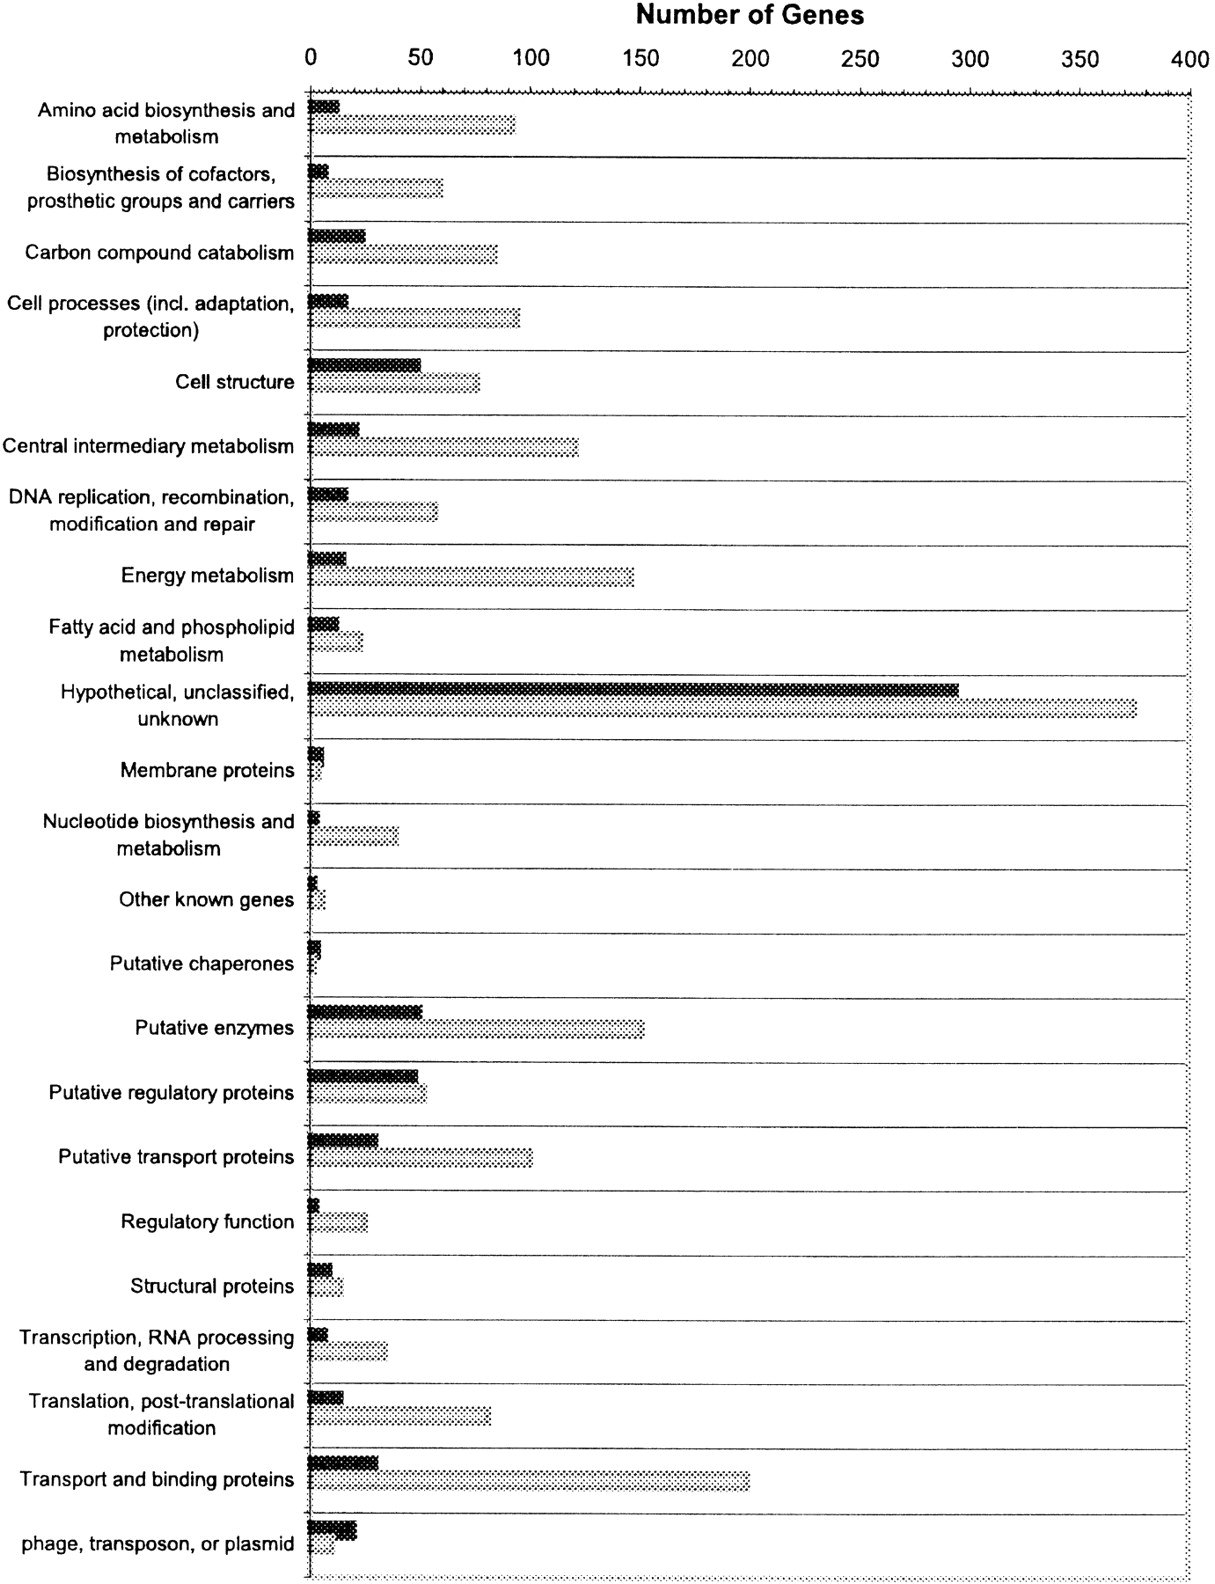
Figure 8.
Distribution of functional categories of the E. coli genes in the typical and atypical (type A) ORF clusters obtained by two-means clustering. (solid bars) Atypical; (shaded bars) typical.


