
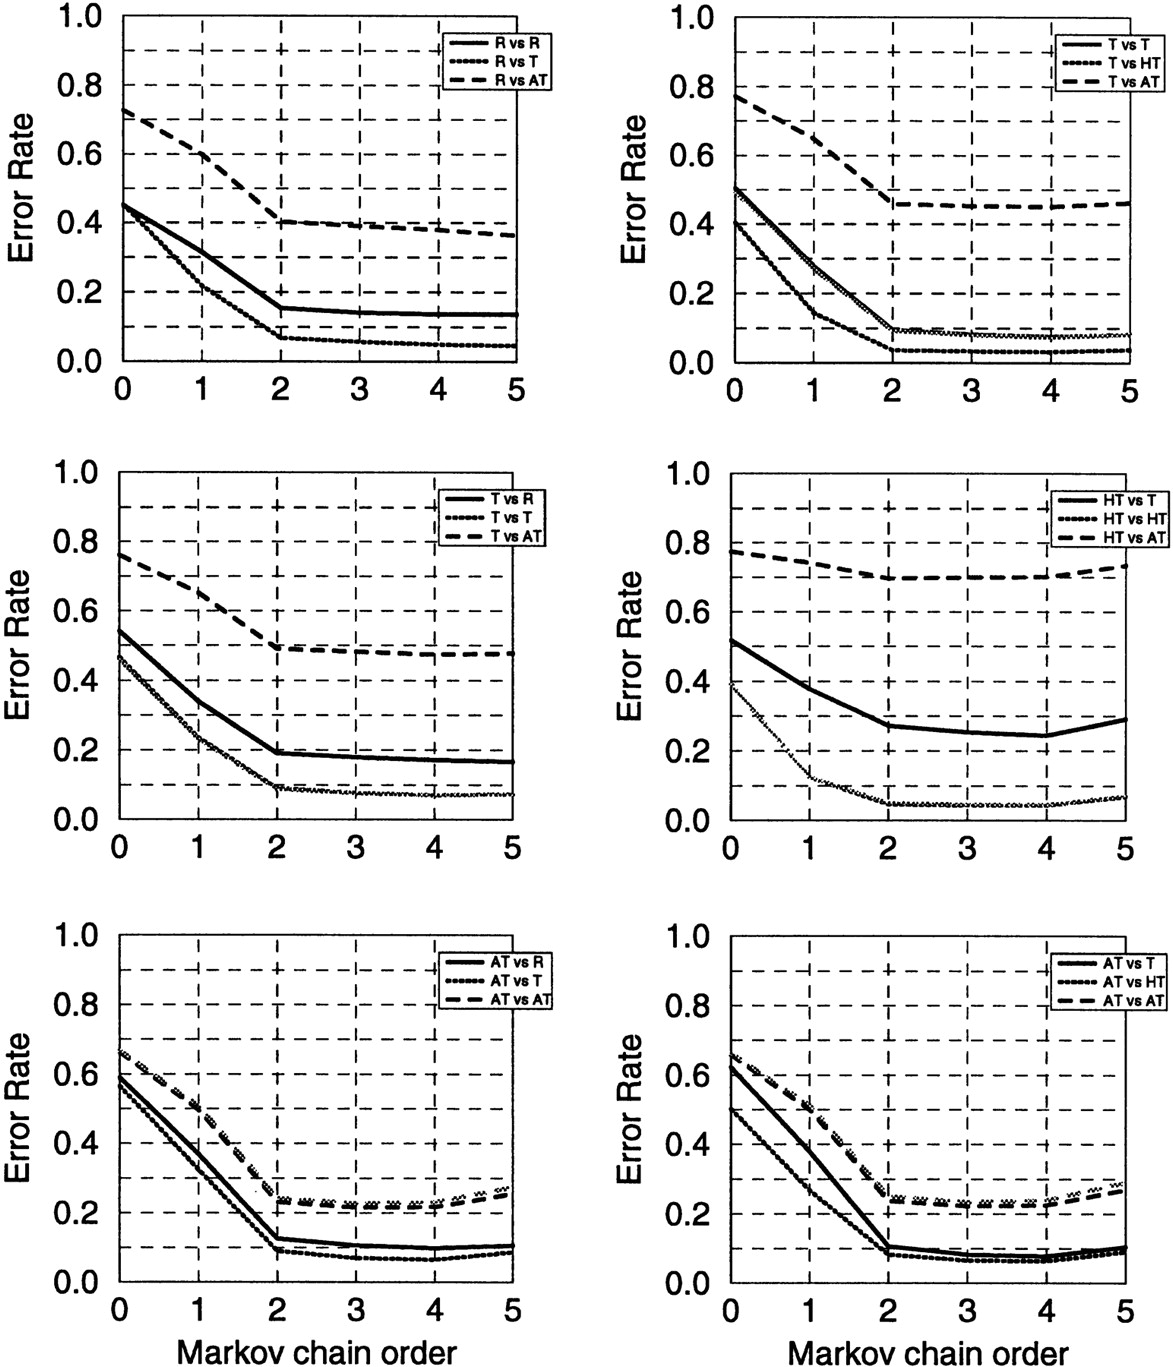
Figure 3.
The accuracy graphs for the E. coli genome analysis(see text). Average false-positive error rates were 0.055 for the Root model; 0.43 for the typical and 0.060 for the atypical models, respectively, obtained by two-means clustering; 0.055 for the typical, 0.036 for the highly typical, and 0.071 for the atypical model obtained by three-means clustering.


