
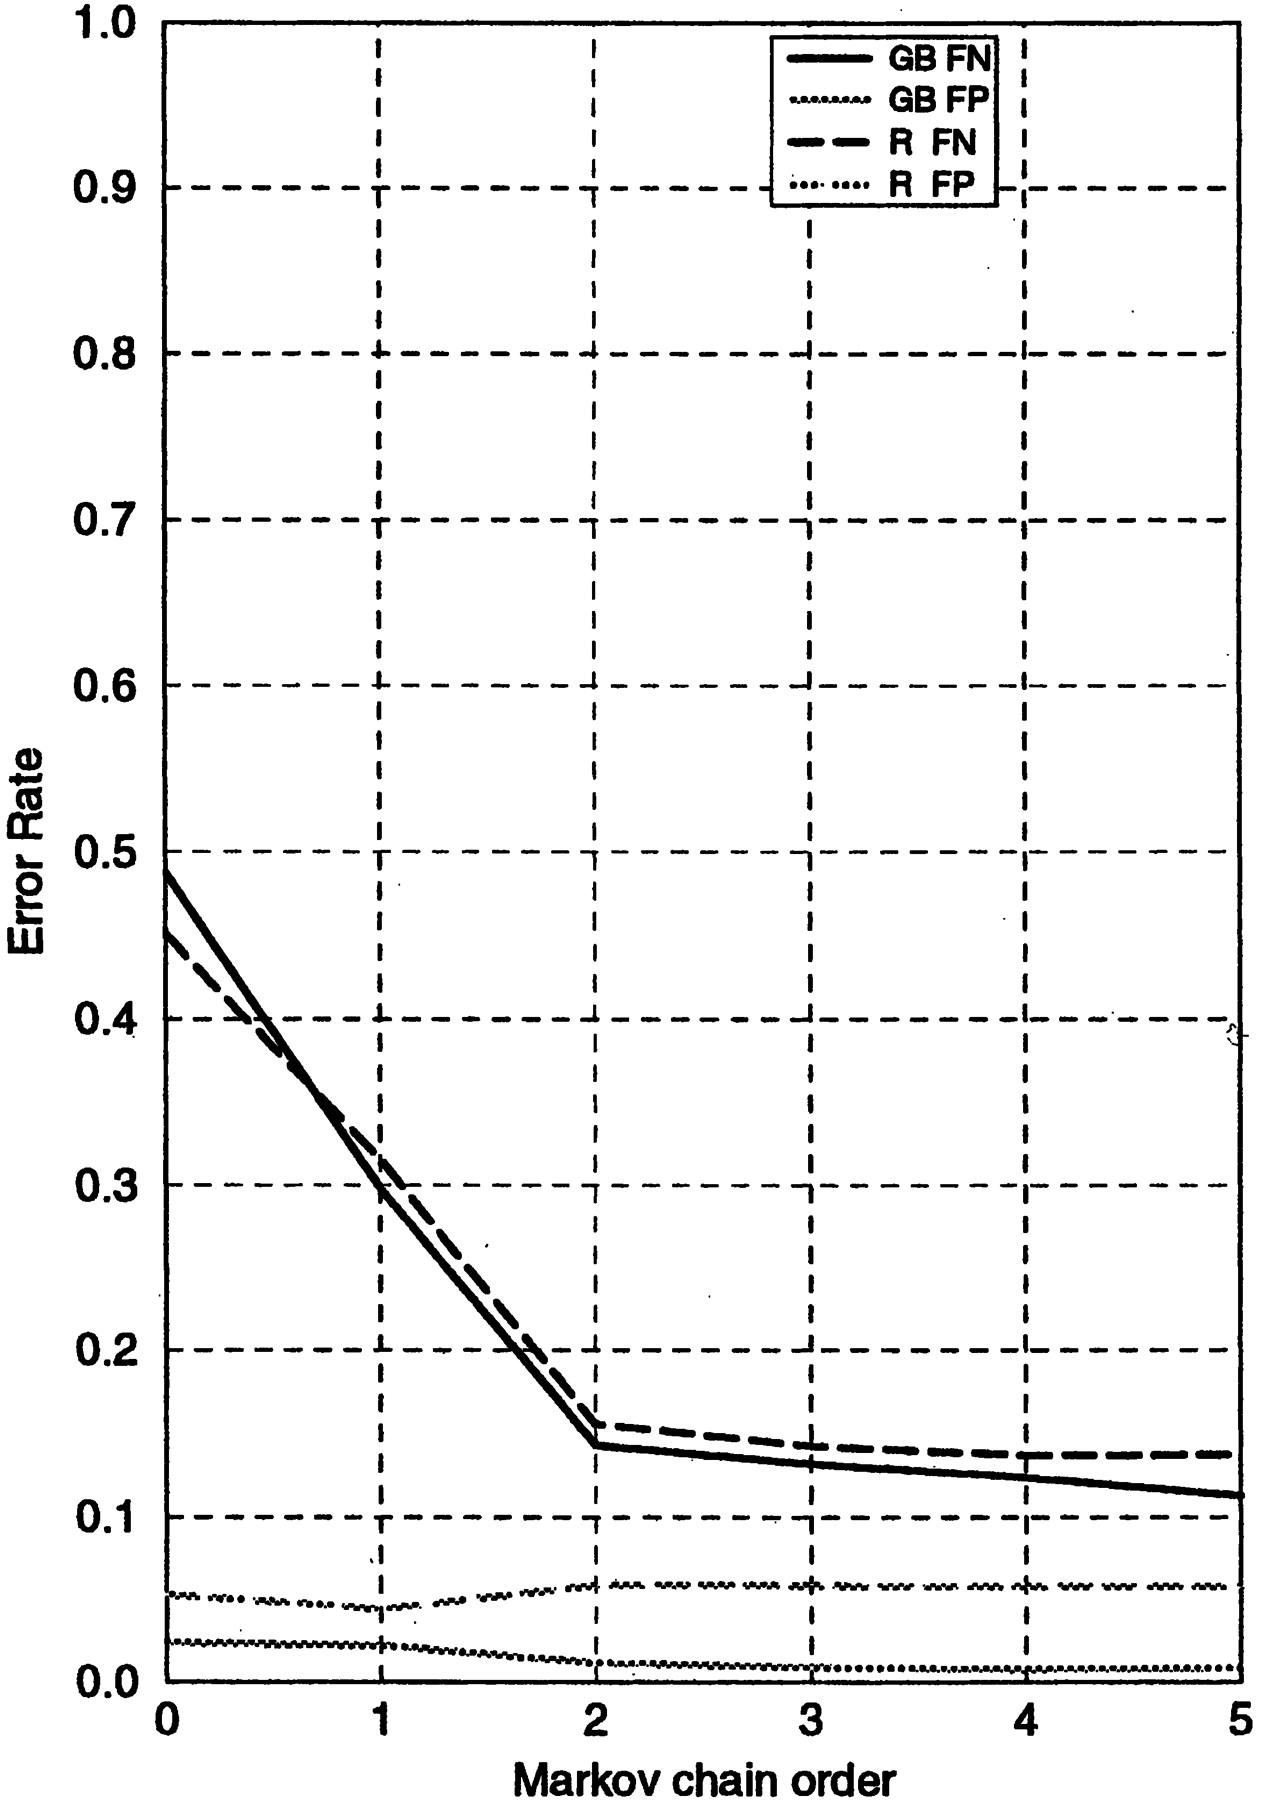
Figure 1.
False-negative (FN) and false-positive (FP) prediction error rates observed in the short fragment identification procedure implemented theE. coli genome. The Root and GenBank models were employed in the GeneMark program making the predictions. Similar graphs are called accuracy graphs (see Figs. 2 and 3, below).


