
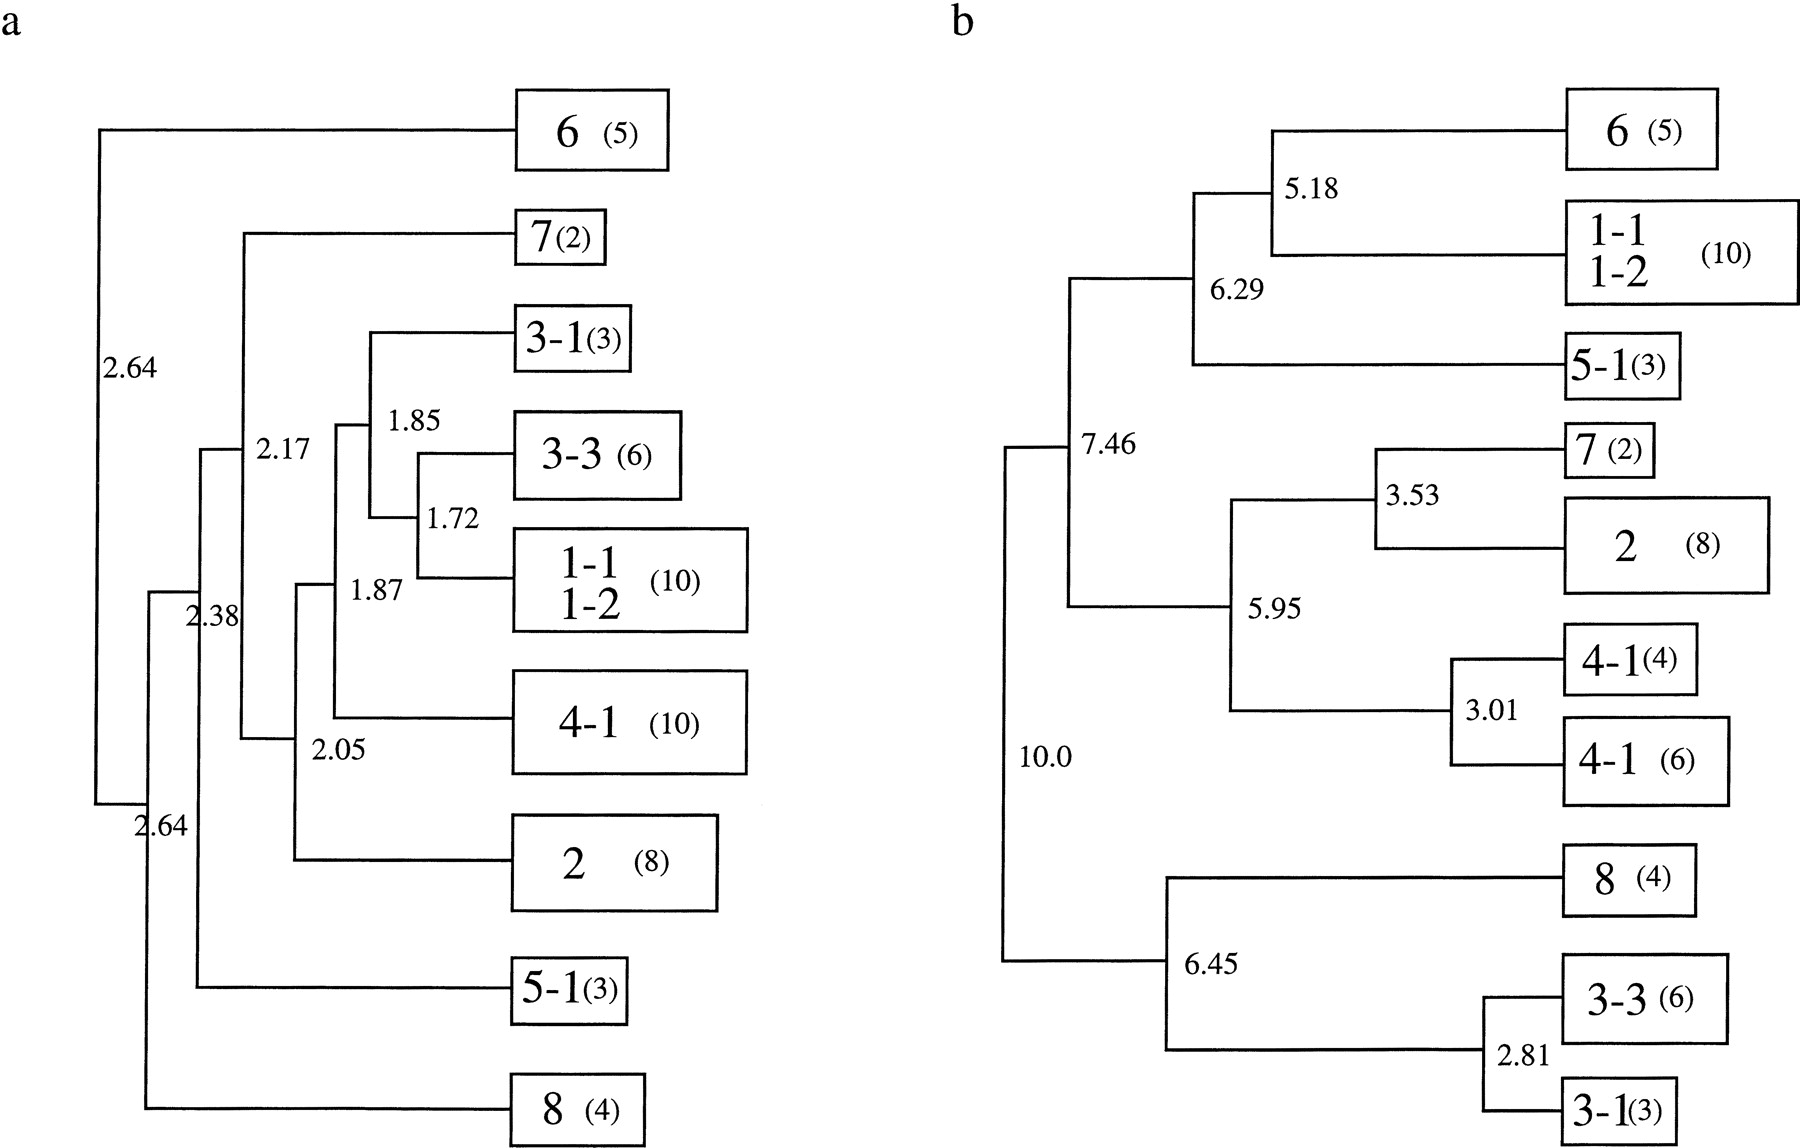
Figure 1.
A schematic representation of the results of the hierarchical cluster analysis for the ATP-binding proteins in E. coli. For convenience, only the basal clusters are depicted according to (a) the single-linkage cluster analysis and (b) the complete-linkage cluster analysis. The distances are denoted at their branchpoint. Each box represents a group with the group number (Table2) and the number of sequences in parentheses.


