
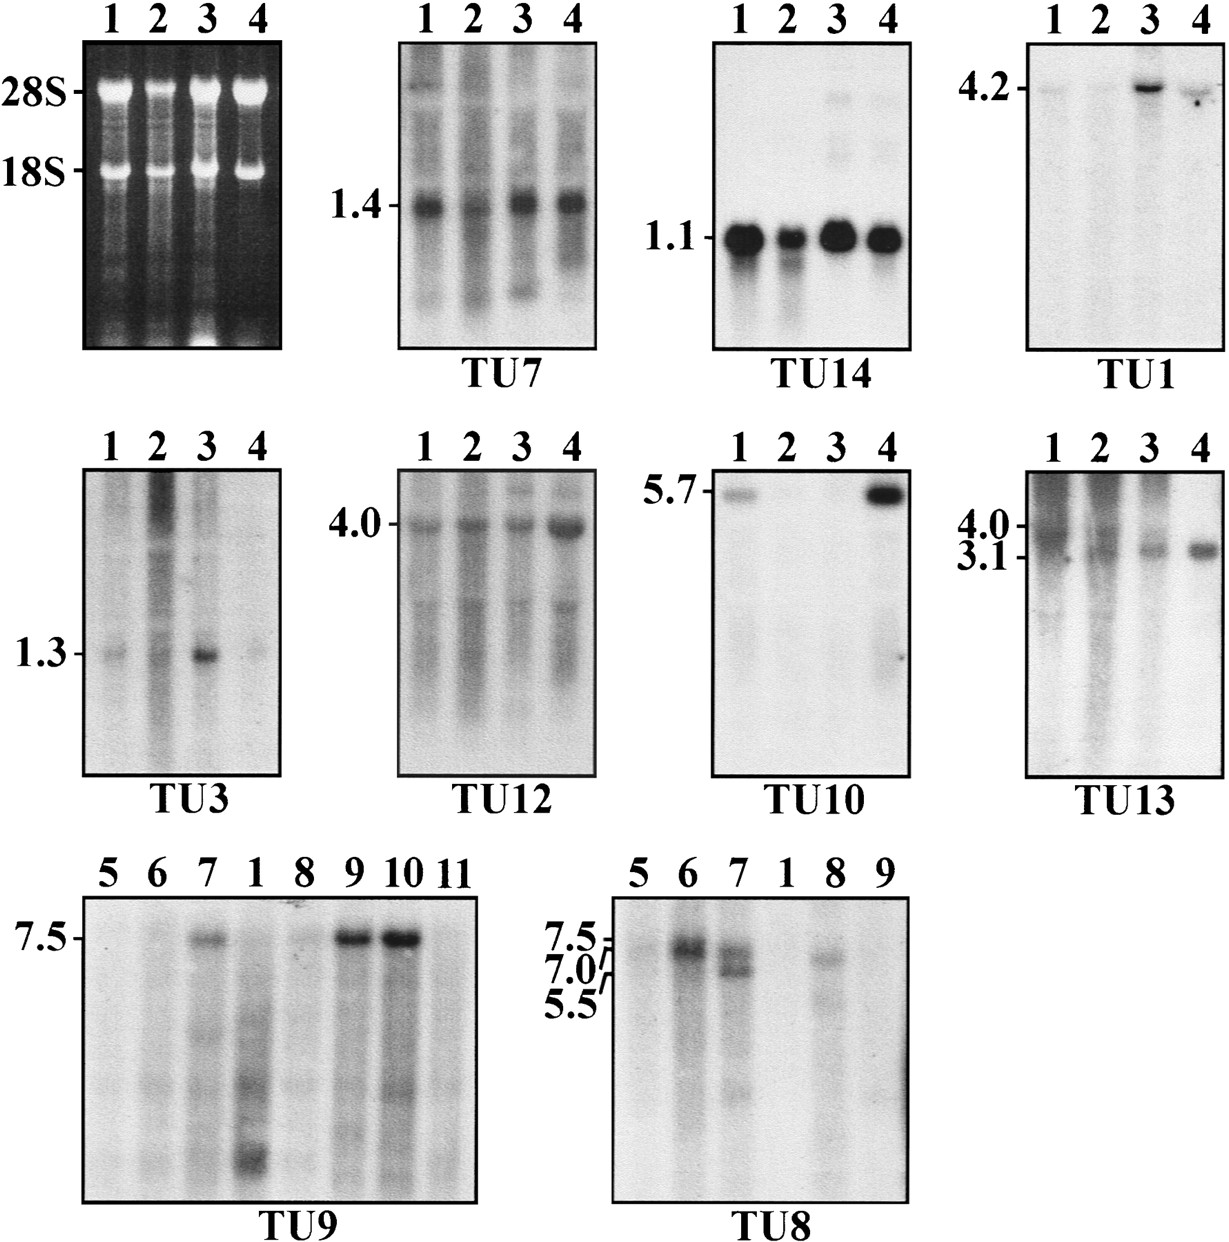
Figure 2.
Northern blot analyses of cDNA fragments corresponding to the (TUs) as indicated (see Fig. 1). Examples are given to demonstrate the various expression profiles in lung (lane 1), cerebellum (lane2), retina (lane 3), retinal pigment epithelium cell line ARPE-19 (lane 4), and heart (lane 5), brain (lane 6), placenta (lane 7), liver (lane 8), skeletal muscle (lane 9), kidney (lane 10), and pancreas (lane 11). The transcript sizes are indicated atleft in kilobases.


