
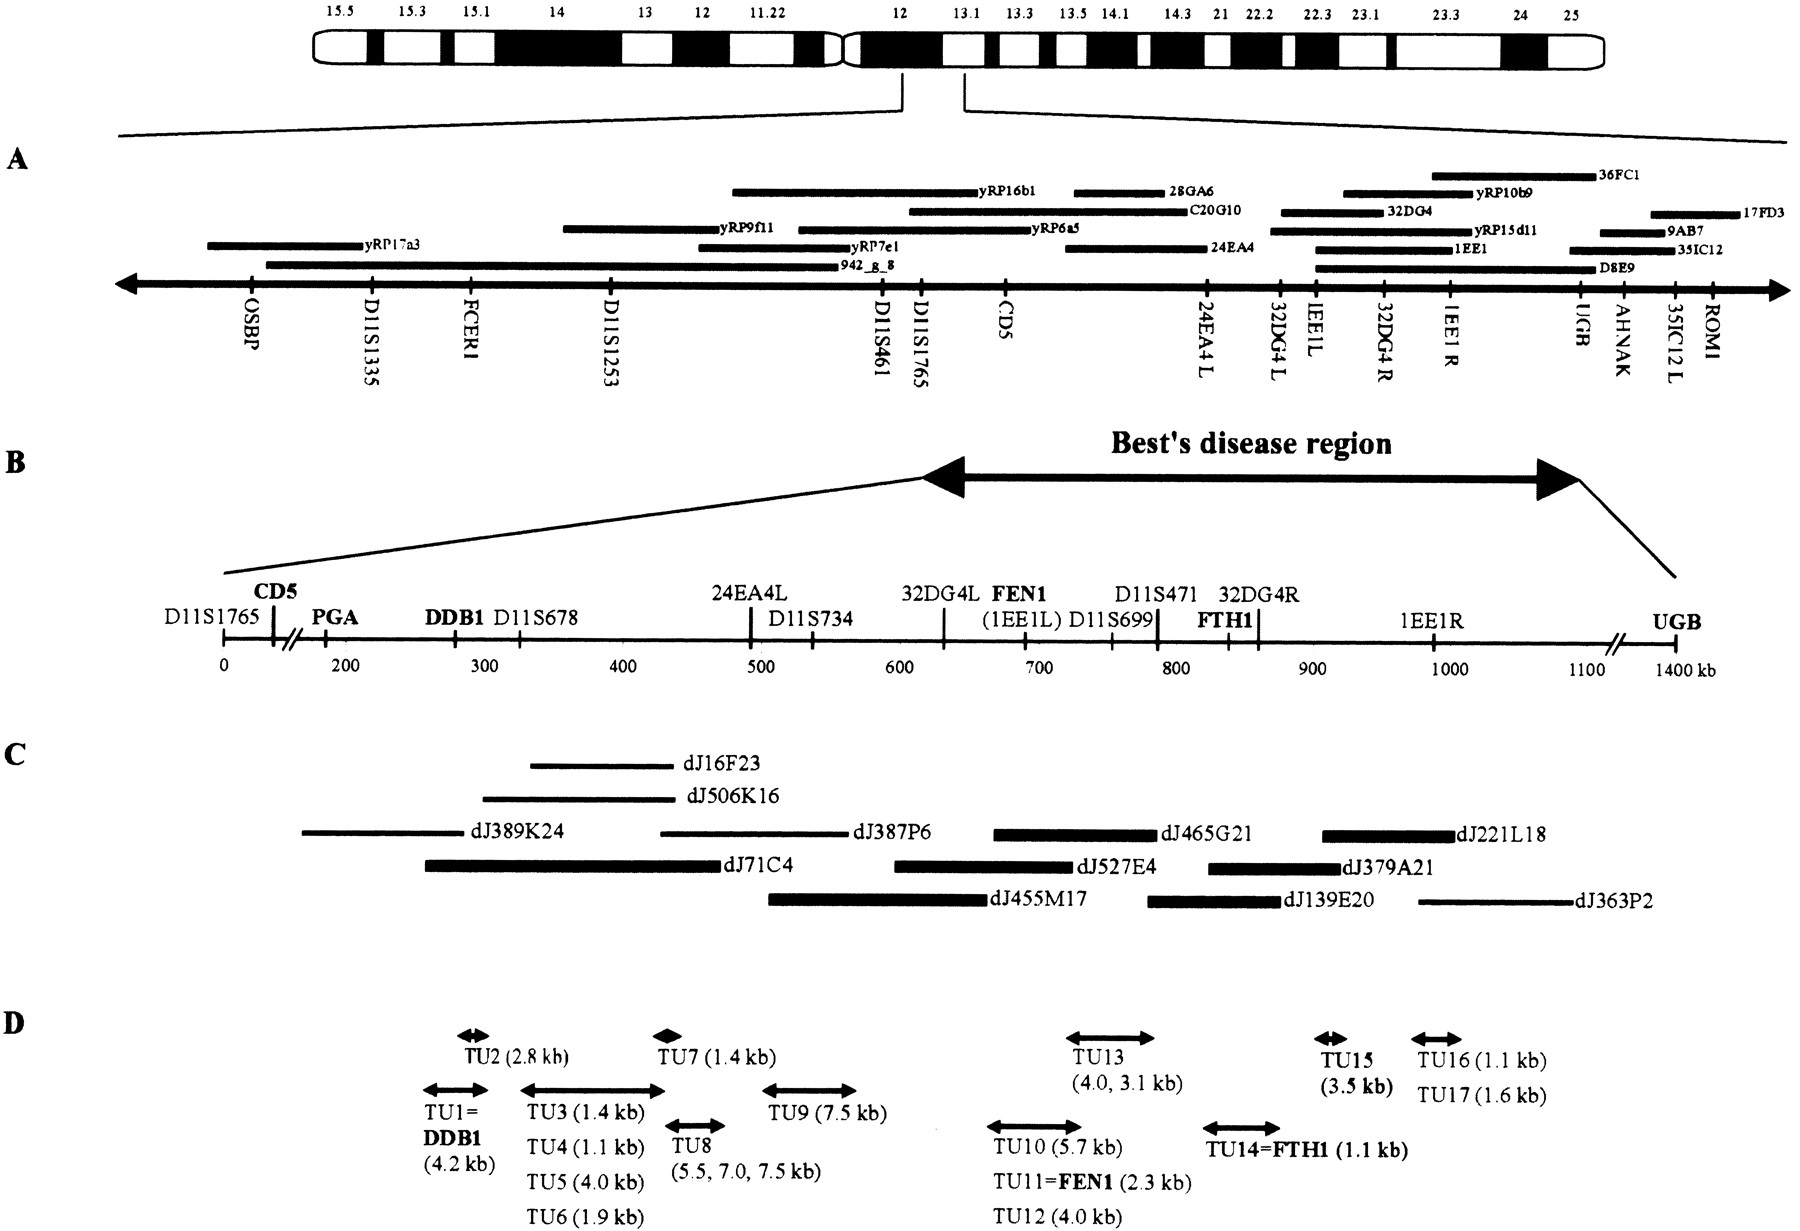
Schematic representation of the physical and transcript map of the Best’s disease locus. (A) Two nonoverlapping YAC contigs extending the Best’s disease region proximally and distally. The order and location of genes and anonymous DNA markers were determined by STS content mapping. (B) The minimal Best’s disease interval between DNA markers at D11S1765 and UGB. The physical size of the region and the position of known genes and STSs is shown. (C) A selected set of overlapping PAC clones (Cooper et al. 1997) covering ∼1 Mb of genomic DNA of the candidate region was used to localize 17 distinct transcription units (TUs). Bold bars indicate PAC clone DNAs used for cDNA selection. (D) Regional assignment of 17 distinct TUs. The transcript sizes obtained by Northern blot analysis are in parentheses.


