
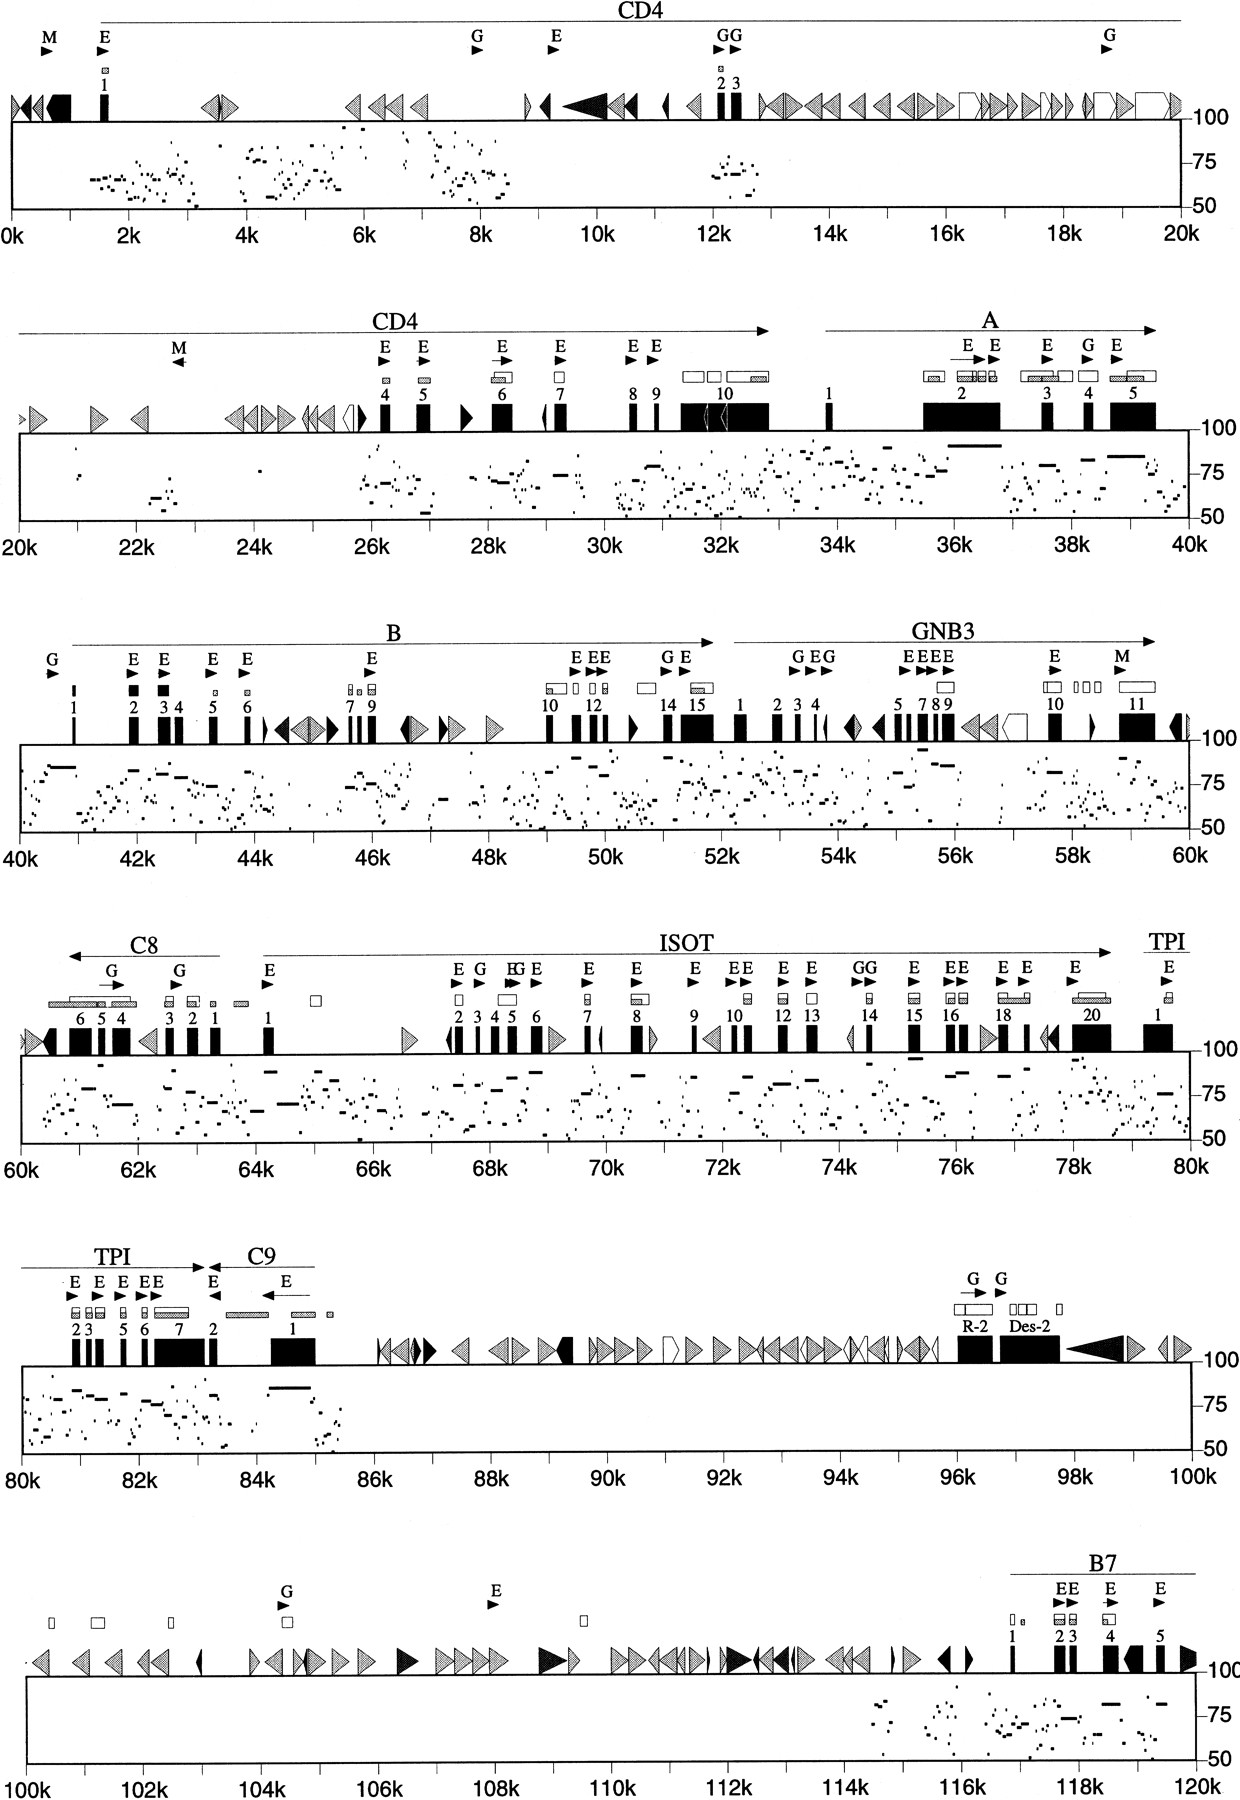
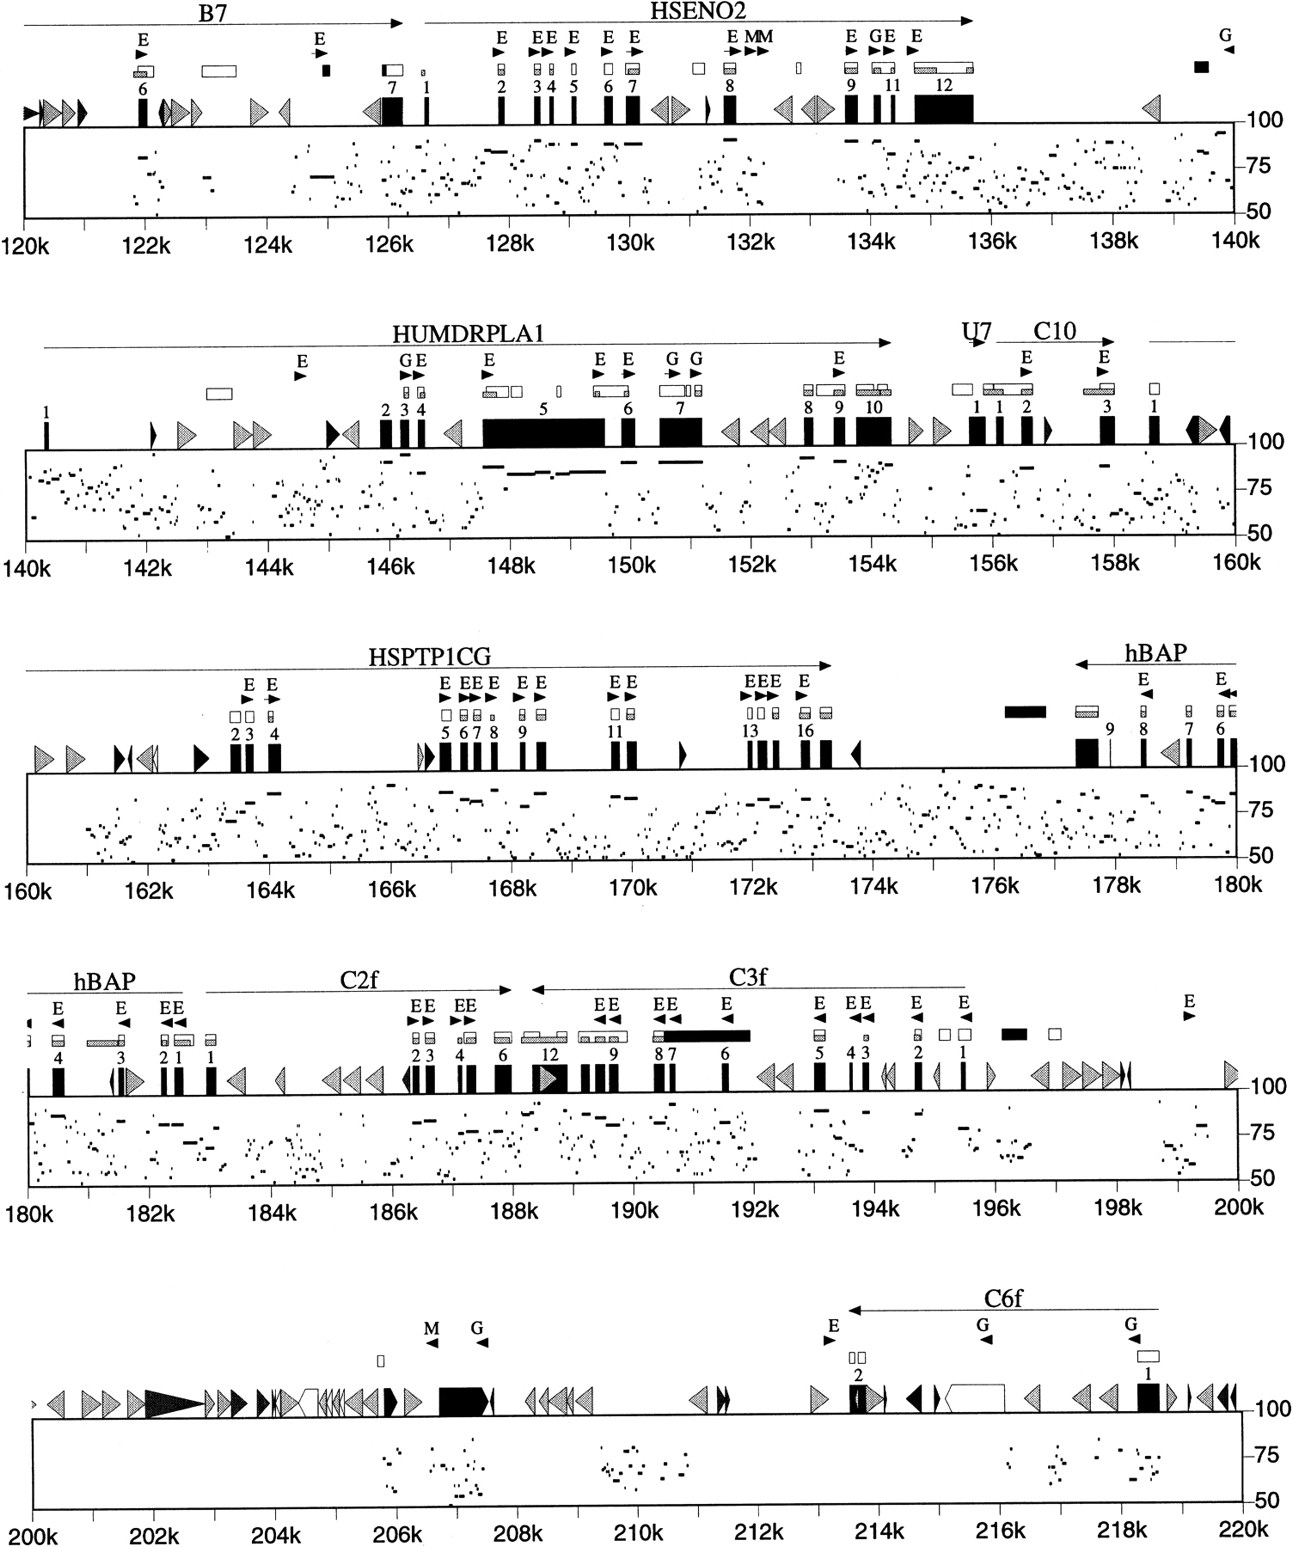
The PIP. The nucleotide position for the human sequence is shown in thex-axis, and the percent sequence identity (50%–100%) is shown in the y-axis. Exons (numbered black boxes), and repeats (SINEs other than MIR are light gray triangles pointing toward the A-rich 3′ end; LINE1s are open arrow boxes; MIR and LINE2 elements are black triangles and pointed boxes, respectively; other interspersed repeats are dark gray triangles) are indicated above the main boxes; BLAST hits in dbEST as shorter white (human), gray (mouse); or black (ESTs discussed in the text) boxes above that; and GRAIL-2 exon predictions (email to grail{at}ornl.gov) above EST matches. The GRAIL-2 hits show direction, extent, and quality [(E) excellent; (G) good; (M) marginal].


