
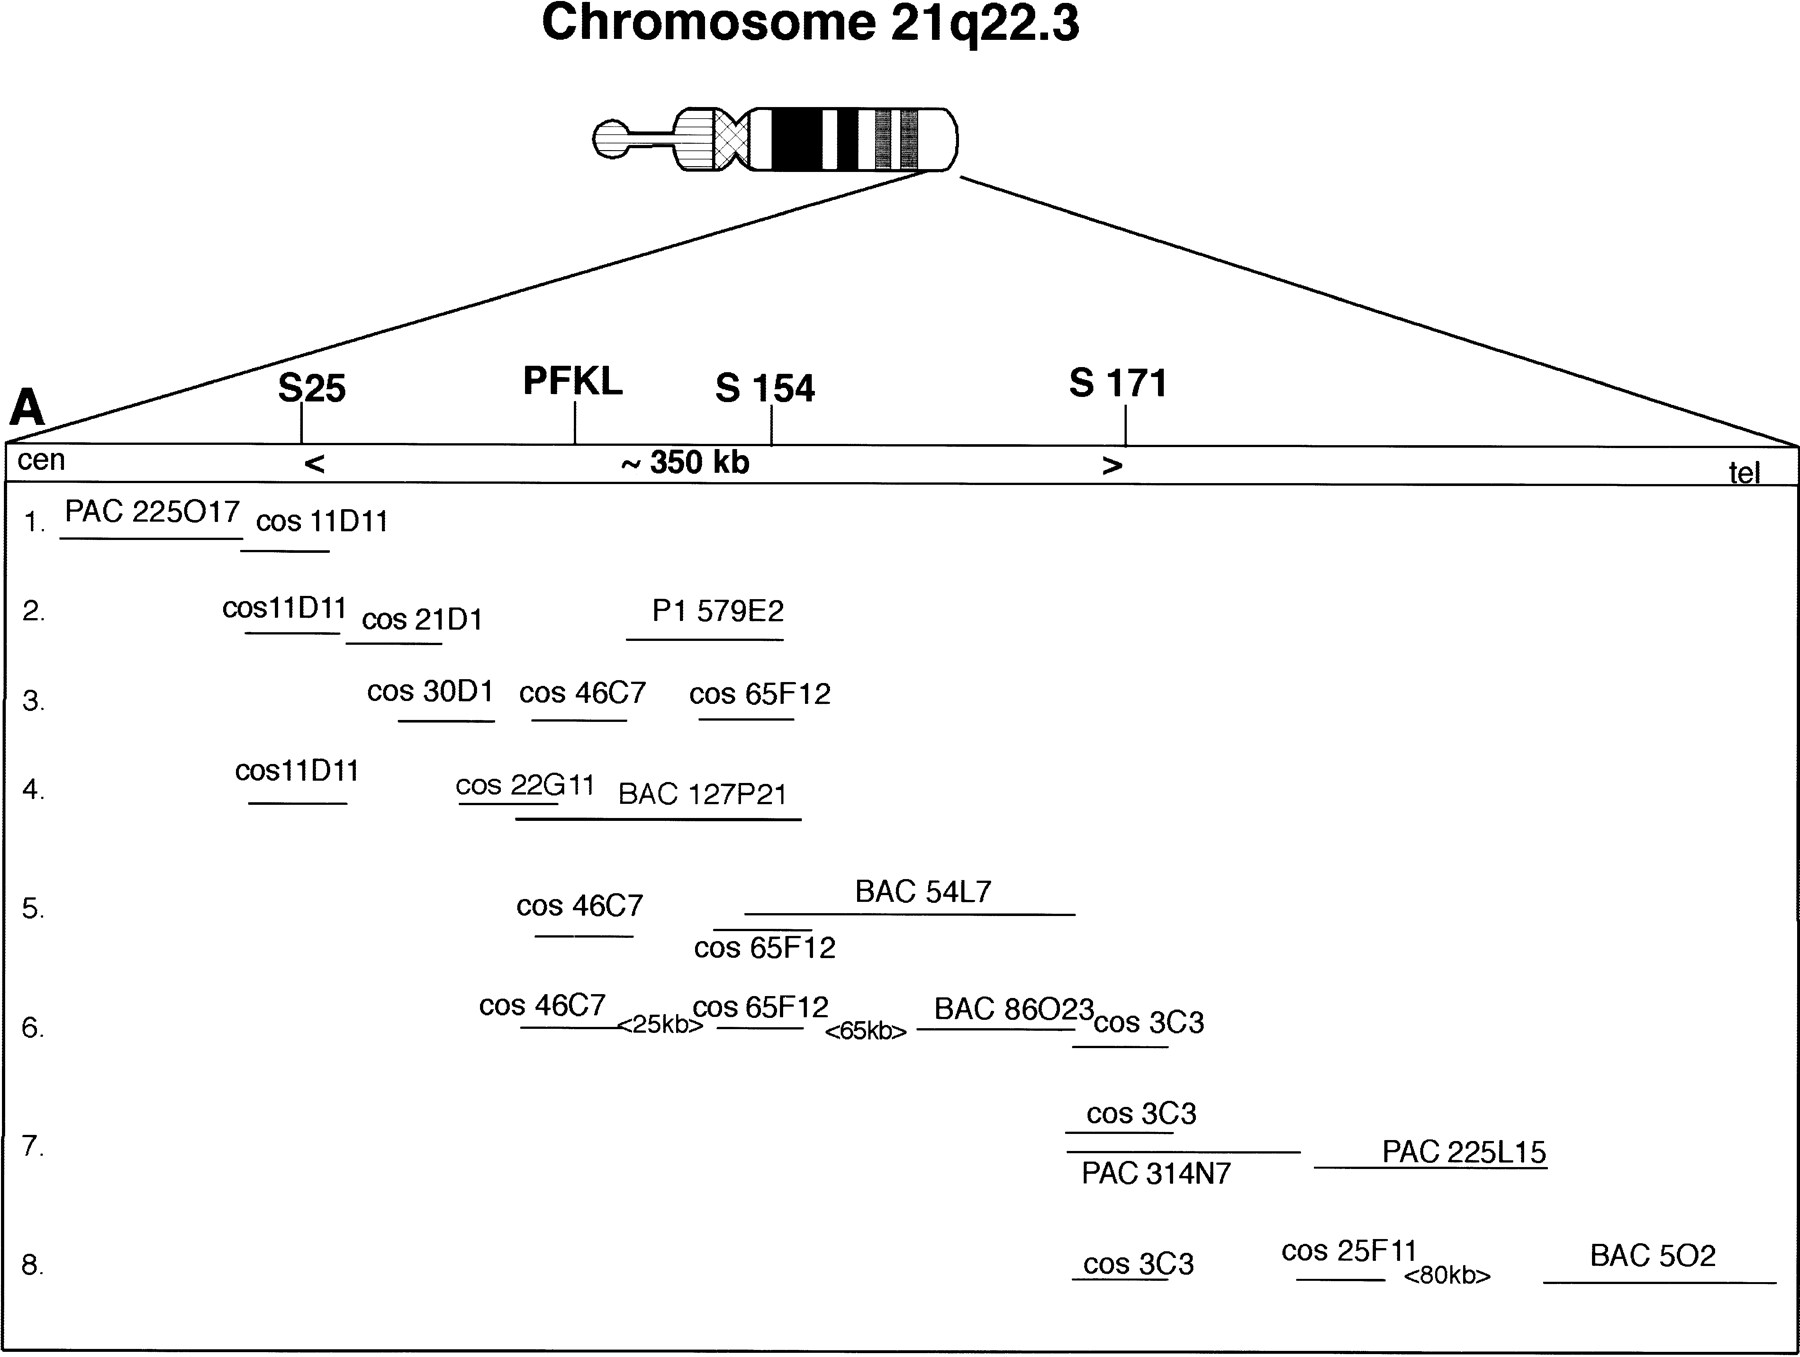
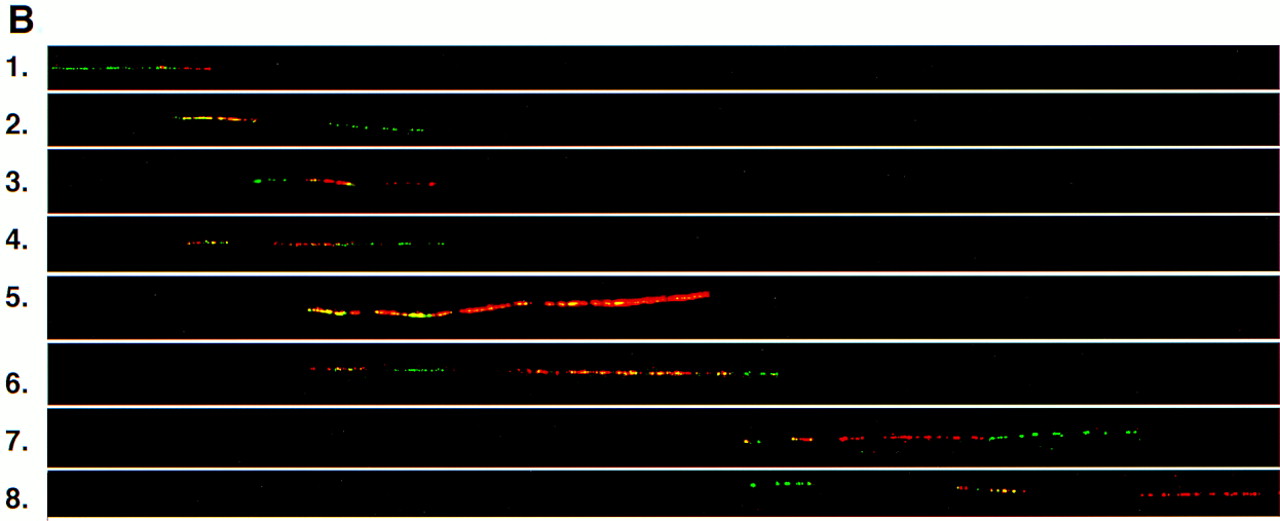
Figure 3.
The physical map of ∼800 kb on chromosome 21q22.3 including the flanking markers D21S25 and D21S171 for theAPECED critical region. The clones shown here represent the minimal tiling pathway. (A) A graphical illustration of the clone contig and interclone distances determined by fiber FISH. (B) The fiber FISH images, with each line (1–8) representing the corresponding line in A and demonstrating one FISH image.


