
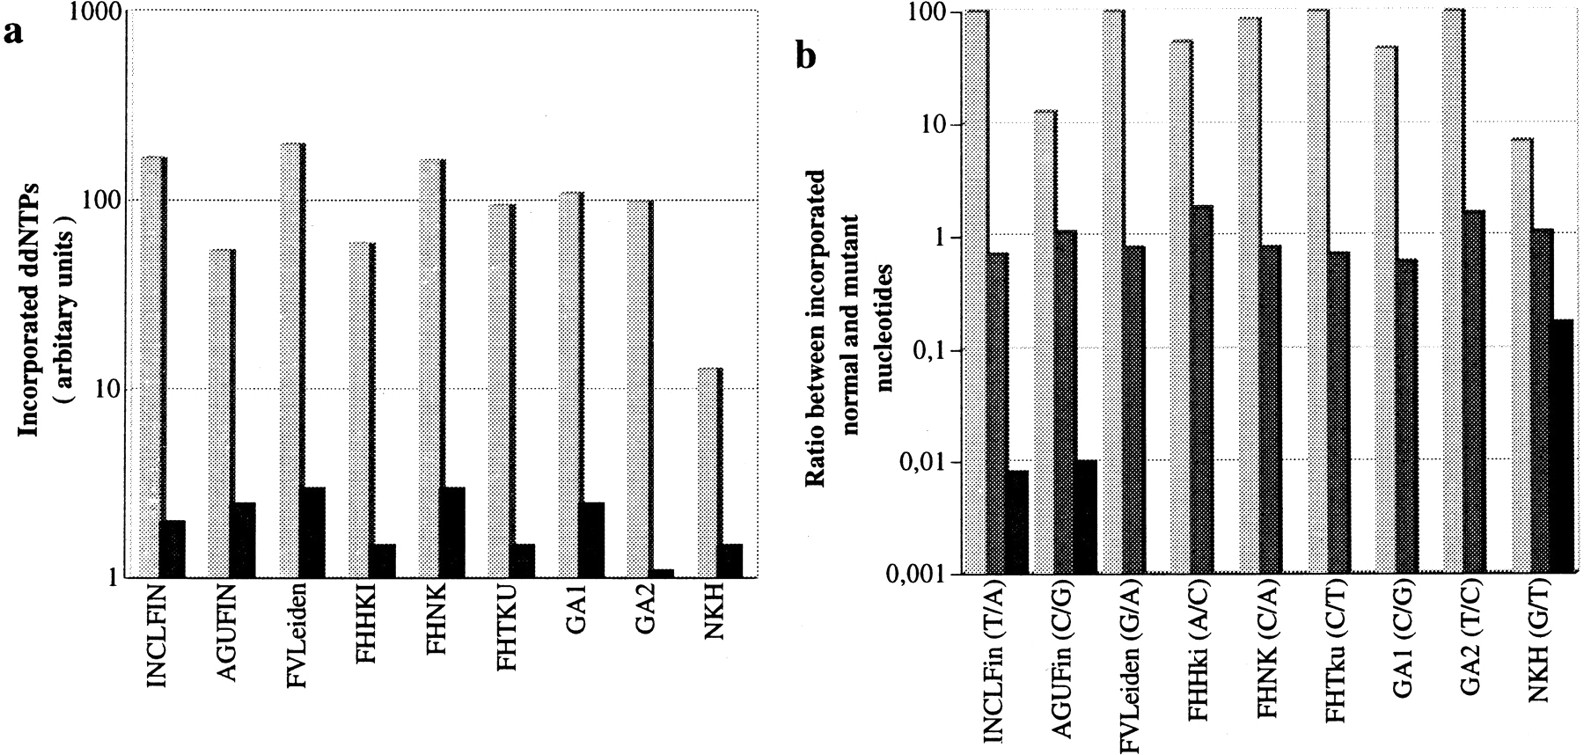
Multiplex detection of nine mutations in samples from heterozygous and homozygous individuals. (a) The signal intensities given for the correctly incorporated nucleotide (lightly shaded bars) at each site are the mean values obtained in 12 samples. The misincorporation signals (dark bars) are the mean value observed in the minisequencing reactions detecting the three other nucleotides at each site in the same 12 samples. (b) The ratio between the signal obtained in the minisequencing reaction corresponding to the normal nucleotide and the signal in the reaction for the mutant nucleotide are plotted on a logarithmic scale for each mutation site. The mutant and normal nucleotides at each position are indicated below. The lightly shaded bars correspond to homozygous normal genotypes. The intermediately shaded bars are heterozygous genotypes, and the dark bars are from individuals homozygous for the mutant allele.


