
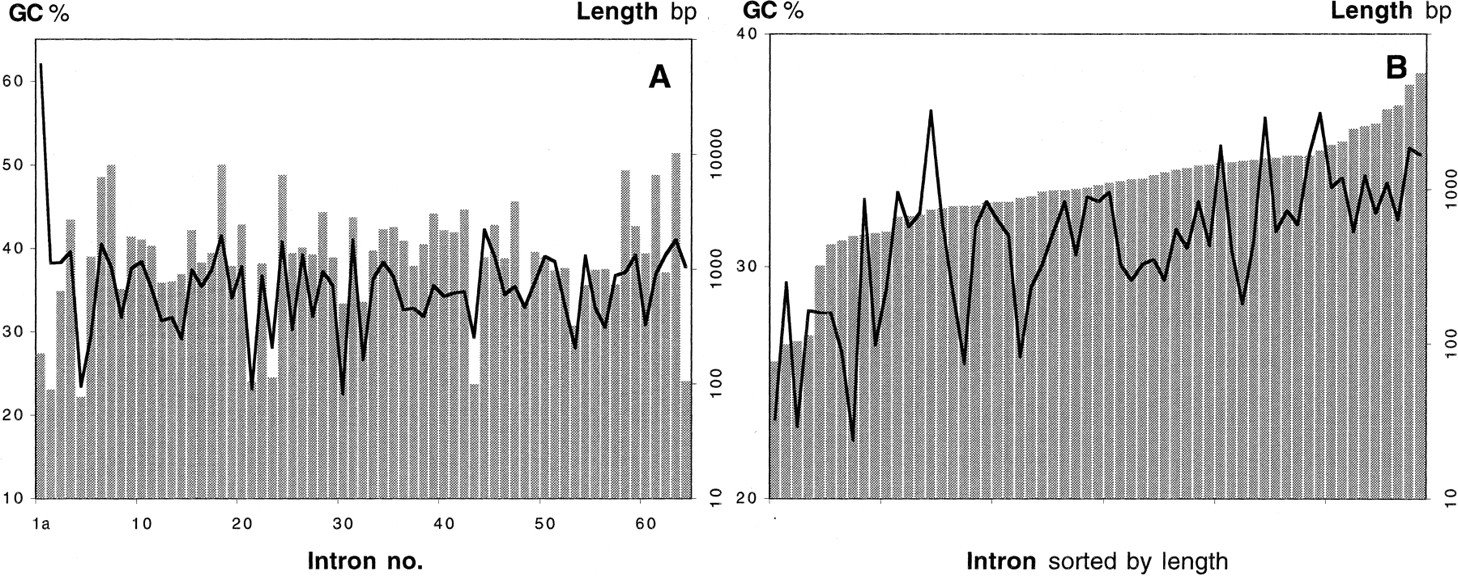
Figure 5.
Correlation of intron length and G + C content. (A) Introns sorted by number. (B) Introns 3–61 relieved from genome-wide repeats sorted by length. (Shaded bars) Intron length; (solid line) G + C content.


