
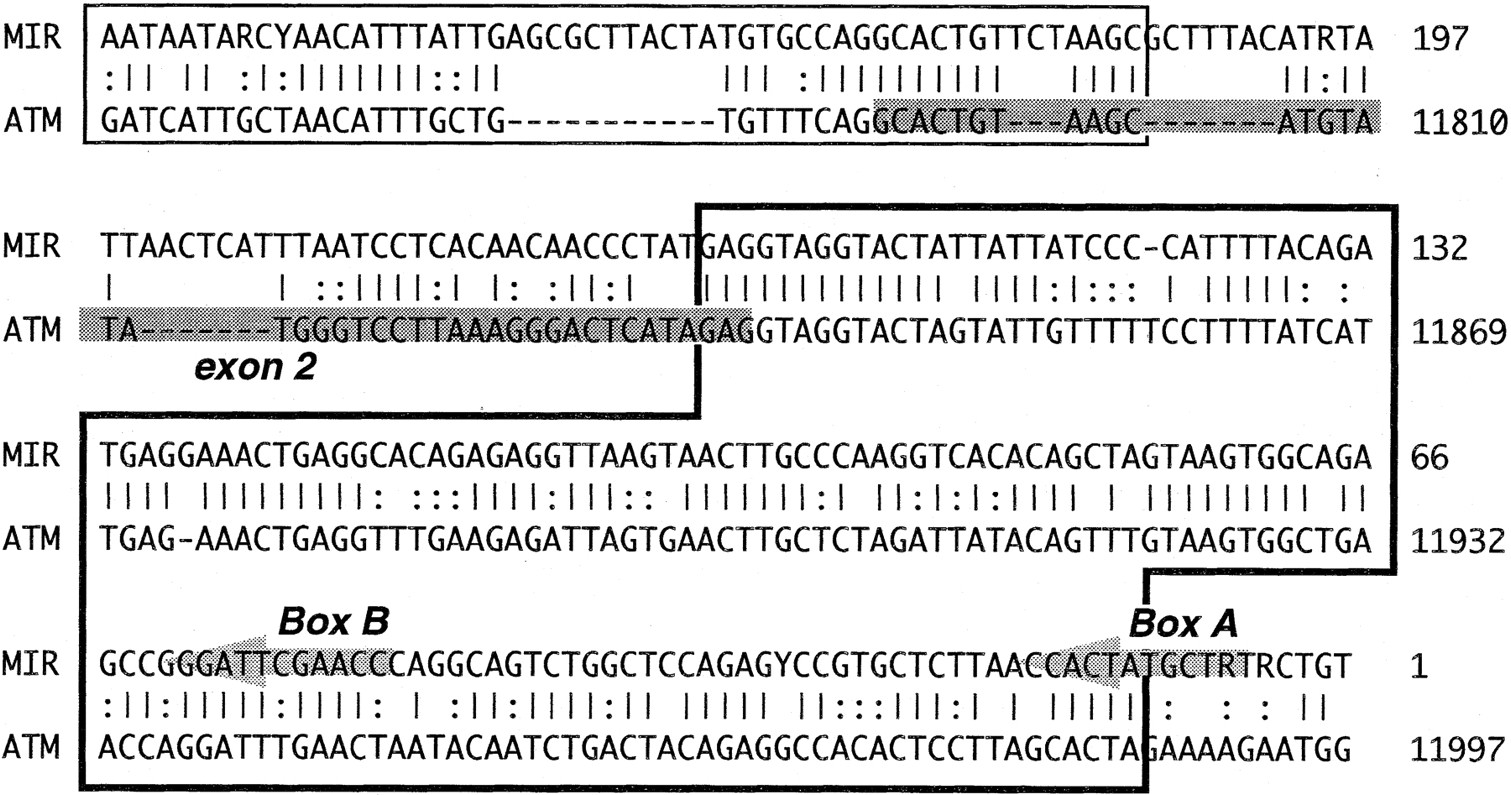
Figure 3.
Sequence comparison of ATM exon 2 and the consensus of the genome-wide MIR repeat. Dark shaded regions indicate exons, lightly shaded arrows characteristic elements of the repeats, (Vbr) Identities; (:) base transitions. Homology region withP(270) = 3.4 × 10⁻¹⁵ is located in the thick-lined box, the region with P(65) = 0.0059 in the thin-lined box.


