
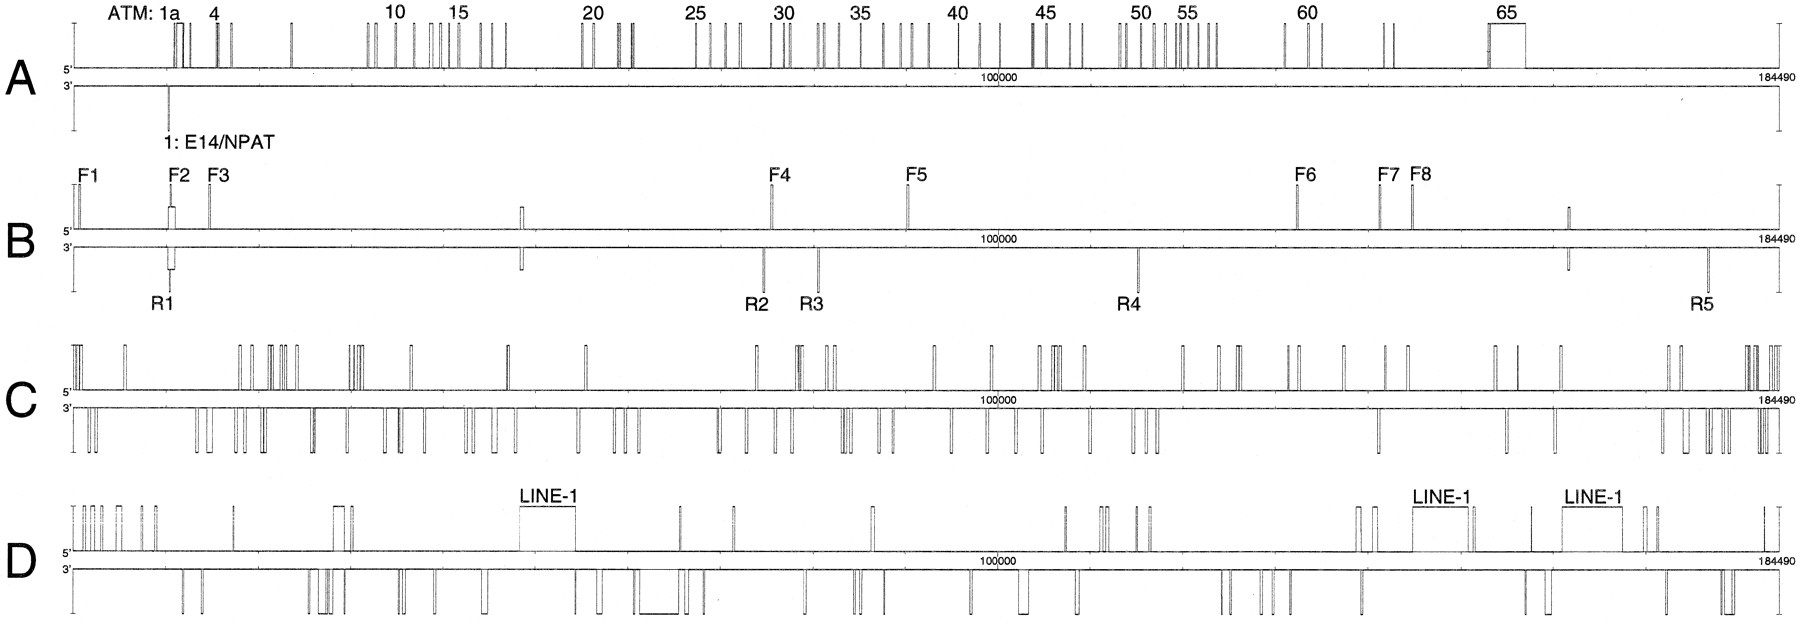
Figure 2.
Schematic representation of the sequenced ATM locus. Boxes above the line represent features oriented toward the telomere; below the line, toward the centromere. (A) Exons identified by cDNAs. (B) CpG islands and predicted promoters (CpG islands are 0.5-high peaks; promoter regions are indicated by F and R in respect to their orientation). (C) SINEs. (D) LINEs, DNA transposons, and unclassified repeats.


